

Sunday Synopsis #32: Give You

Another week freaking folks out but if you were here last week most things kept with the plan and you should have been relatively calm. This week I think there is reason to ‘give you hope’ as I kinda think we’ll be seeing the lowest prices on assets this coming week before the market starts the next uptrend.
BTC/USDT Weekly Structure
https://www.tradingview.com/chart/4v8qizyI/
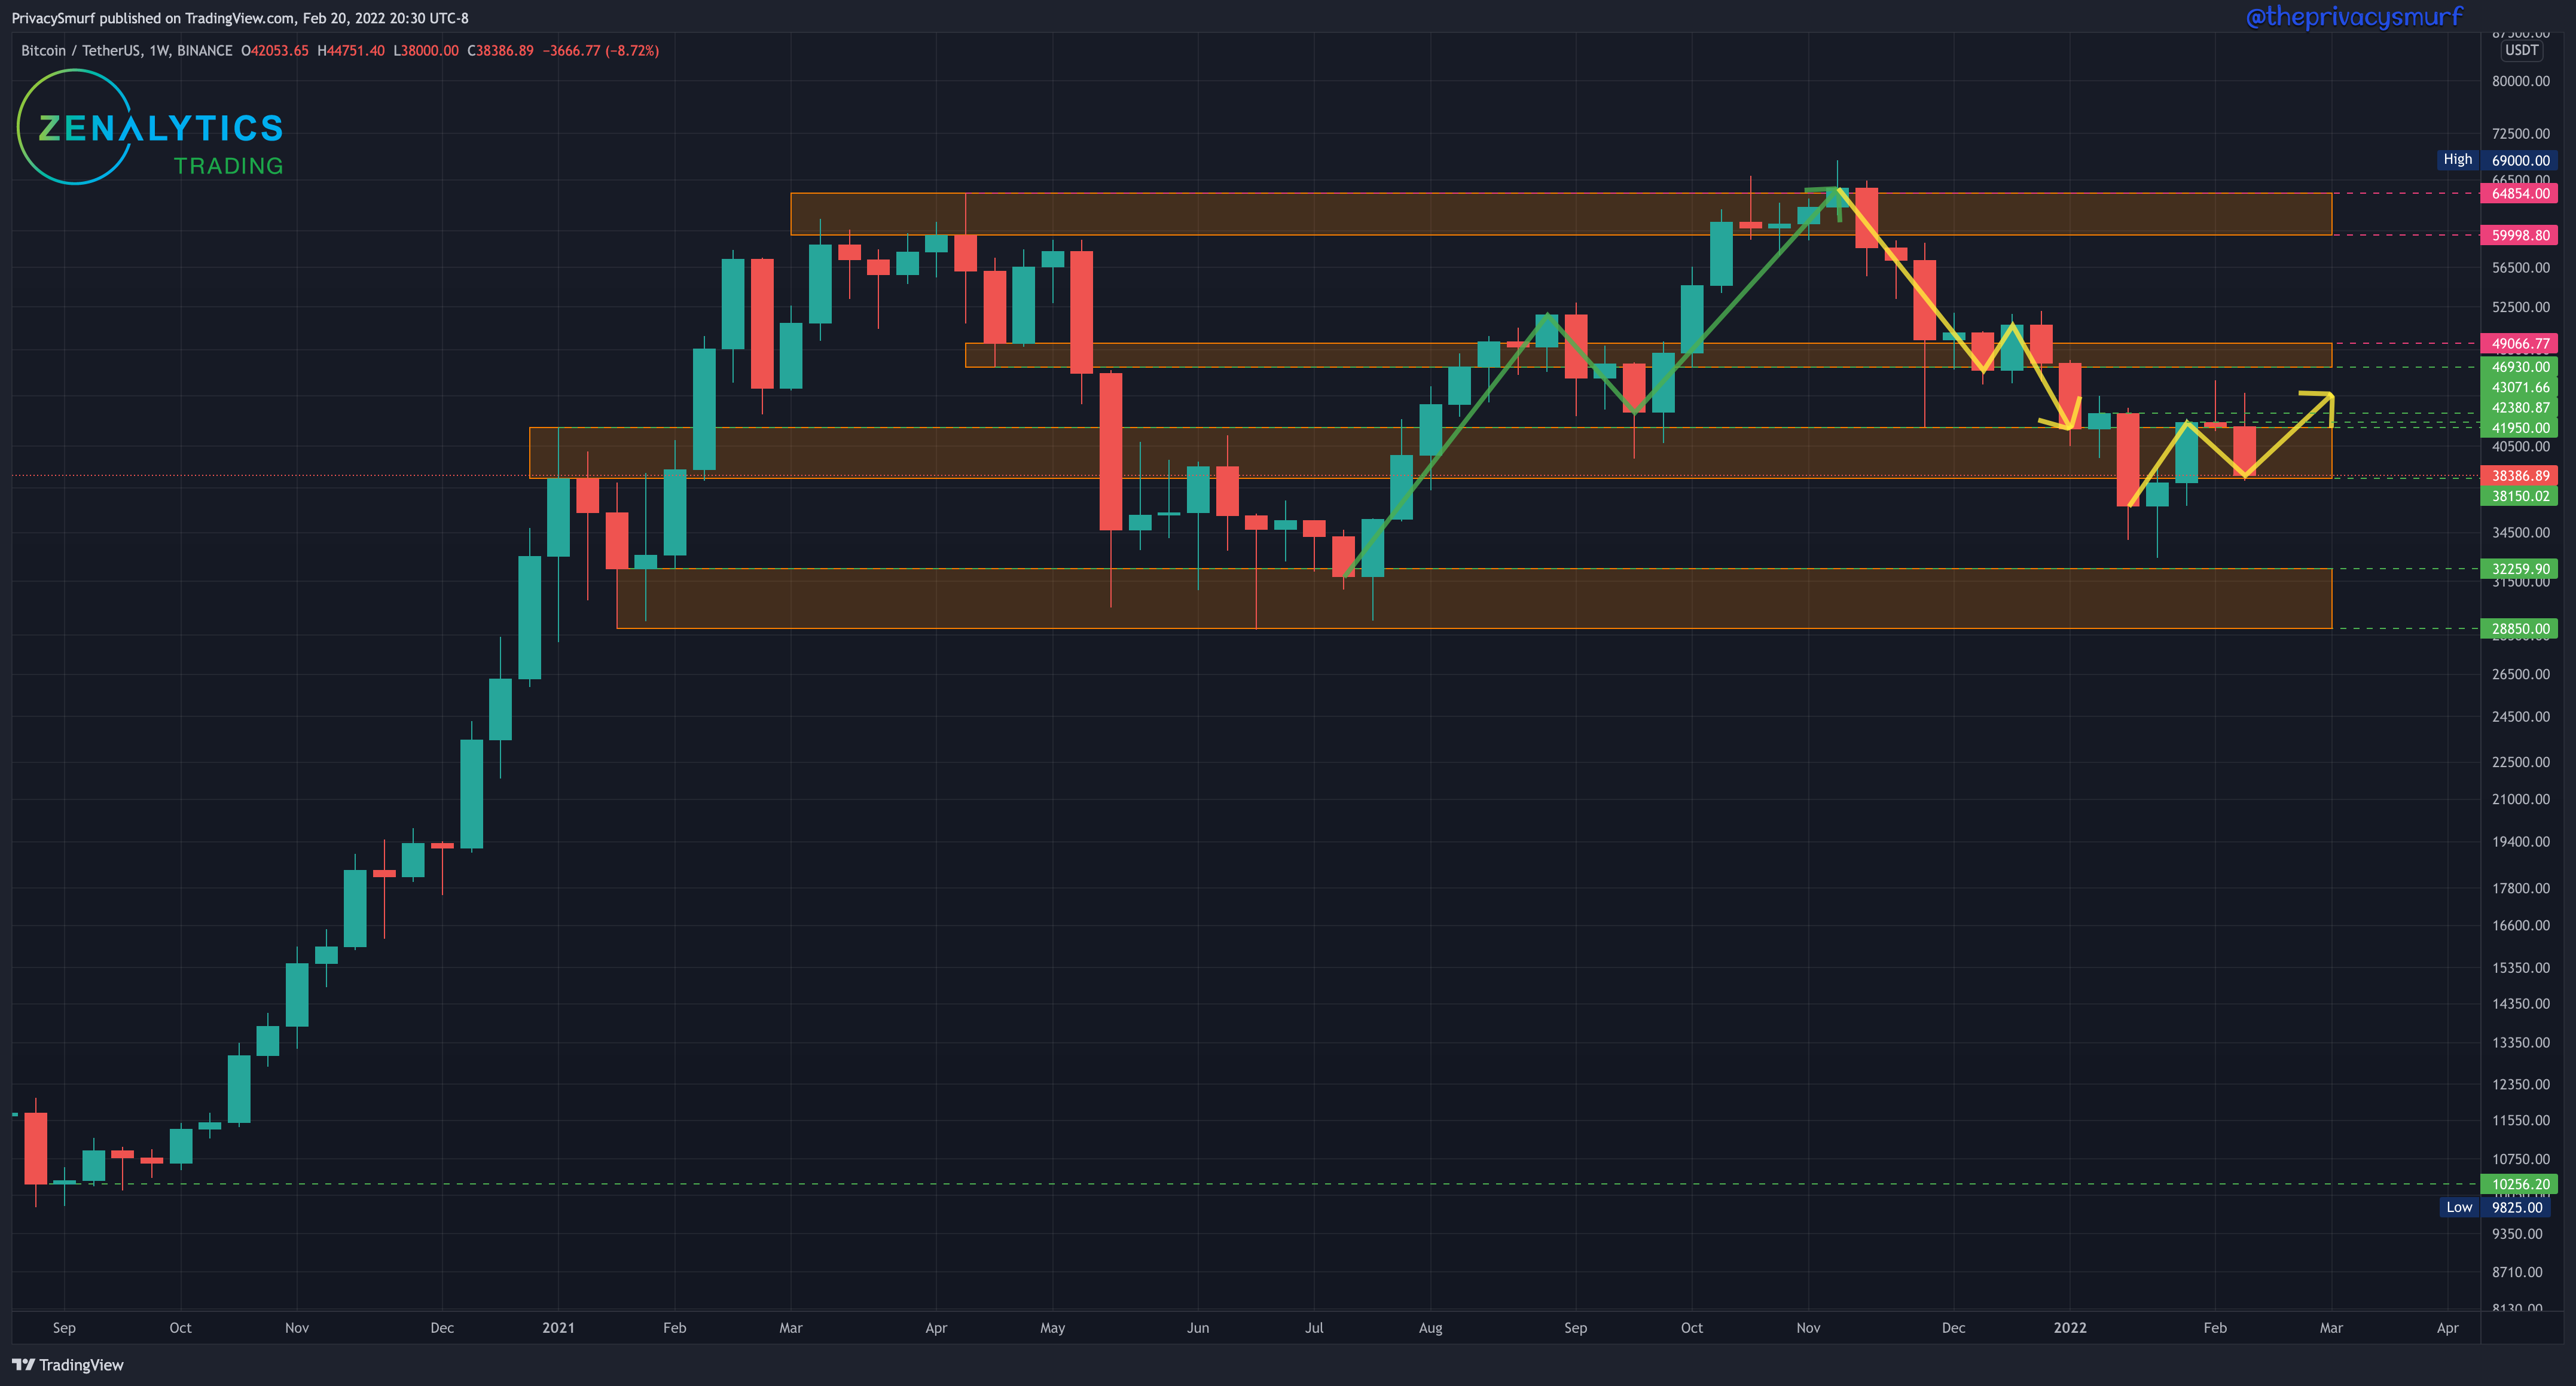
As anticipated and suggested we saw a retracement to the support that was the first resistance of the big bull run in late 2020. If prices rebound from here next week we will set a higher low pivot point. If prices this week or next week close above $43k we’ll have closed above the last highest high close pivot and will establish a new market structure bullish trend. That’s a tall order as there is proving to be plenty of selling at that level. This week I’d expect the same range as last week with wicking action possibly reaching a bit lower than this past week. While I had preset buy orders for my long-term bag at $38k, and lower just in case, I wouldn’t be adding any based on price action until the weekly market structure trend turns bullish again.
BTC/USDT Daily Chart
https://www.tradingview.com/chart/jjSdFW4b/
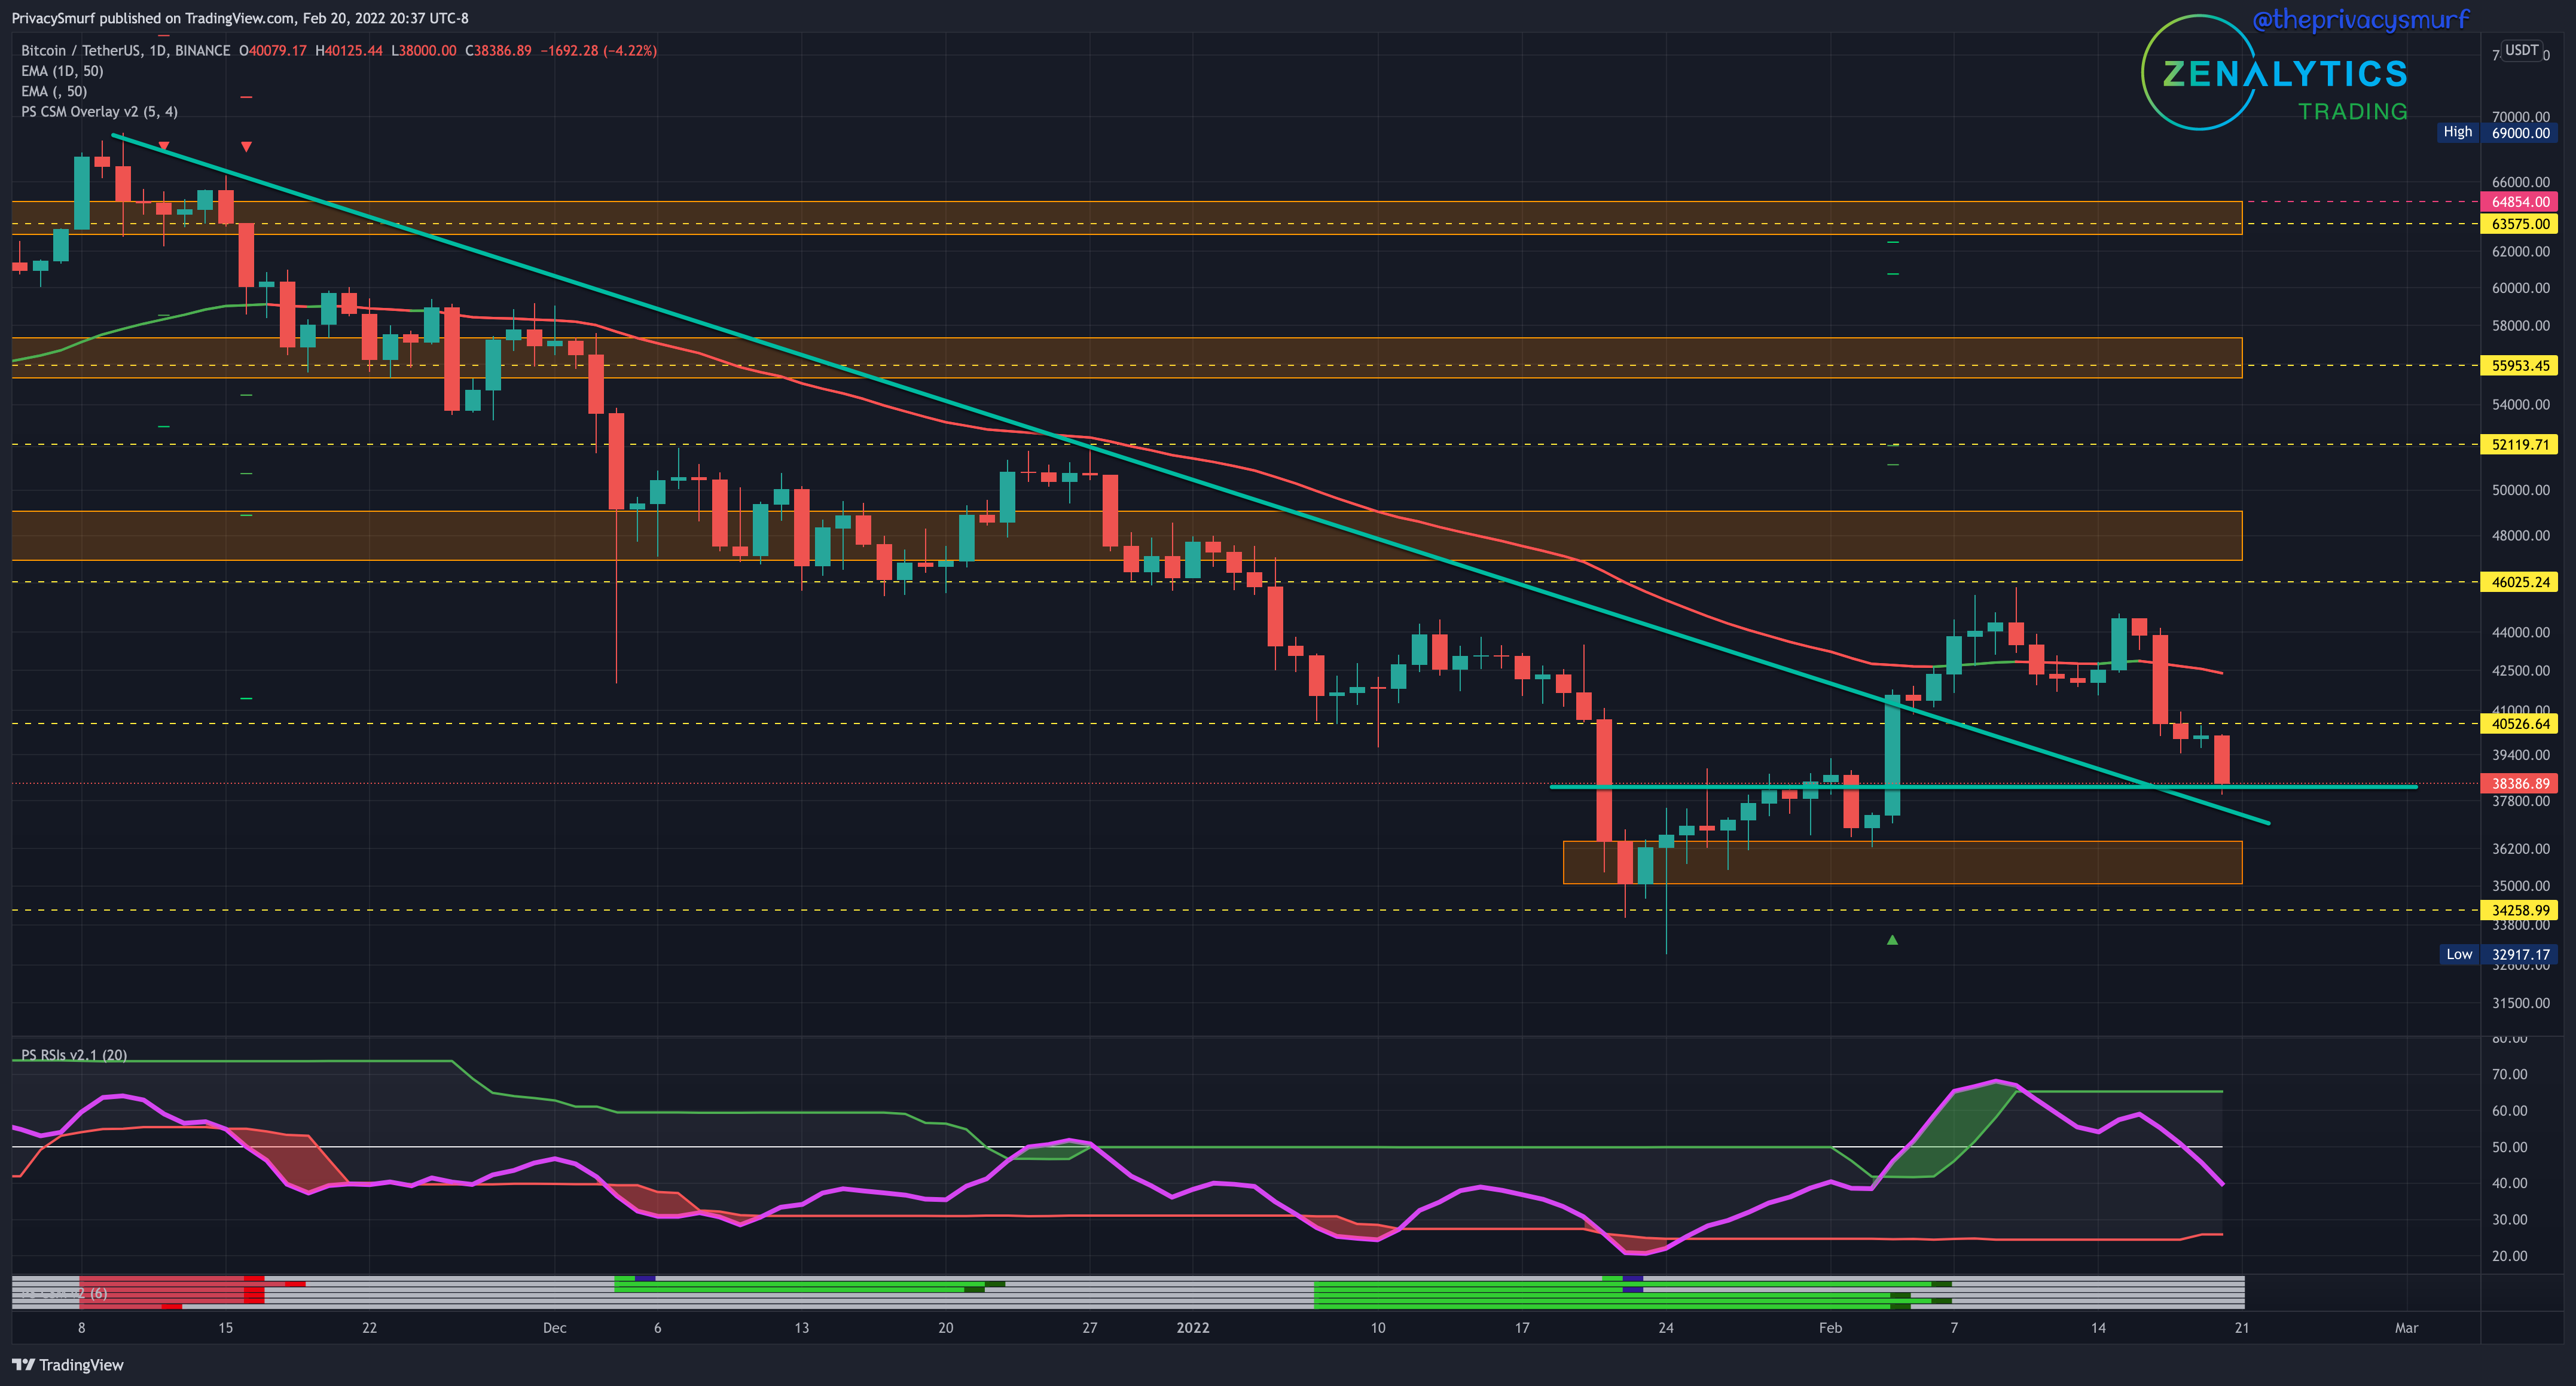
The daily chart of BTC shows a break but rejection of the 50-Day EMA and the holding of resistance up at $45k. While the 38-40k level has held up with the Sunday close I don’t trust it to hold entirely with the RSI trending down in line with the price. It’s possible we get some price action trading below this support around the descending trendline (~$36-$37k). At worst the floor is around 35k, but I’m not expecting that with current technicals and the midweek update may give us a better idea on that possibility. The price action I’m expecting this week with the current picture is $36 to $43k up at the 50-Day EMA. The low end of the range is due to the price being at support. There’s a stronger potential for stop-loss runs under $38k which would if filled would cause a quick burst of sell pressure.
ETH/BTC Weekly Structure
https://www.tradingview.com/chart/sacHlXOv/

The weekly chart of ETH/BTC closed BARELY bullish with nearly the same body range as the last 2 weeks. I’m just gonna repeat myself from last week. The bias is slightly more bearish with this week being a Doji candle, showing price rejection from the top of the daily range.
This consolidation is not going to last long. I’d make no long-term moves here rotating to BTC or ETH. If the mark price gets down to the 0.625 support buying some ETH with BTC would be a long-term area of value and I’d expect a rally from there. The daily chart may give some insight to the possible break of consolidation.
ETH/BTC Daily Chart
https://www.tradingview.com/chart/gTkSjkj6/
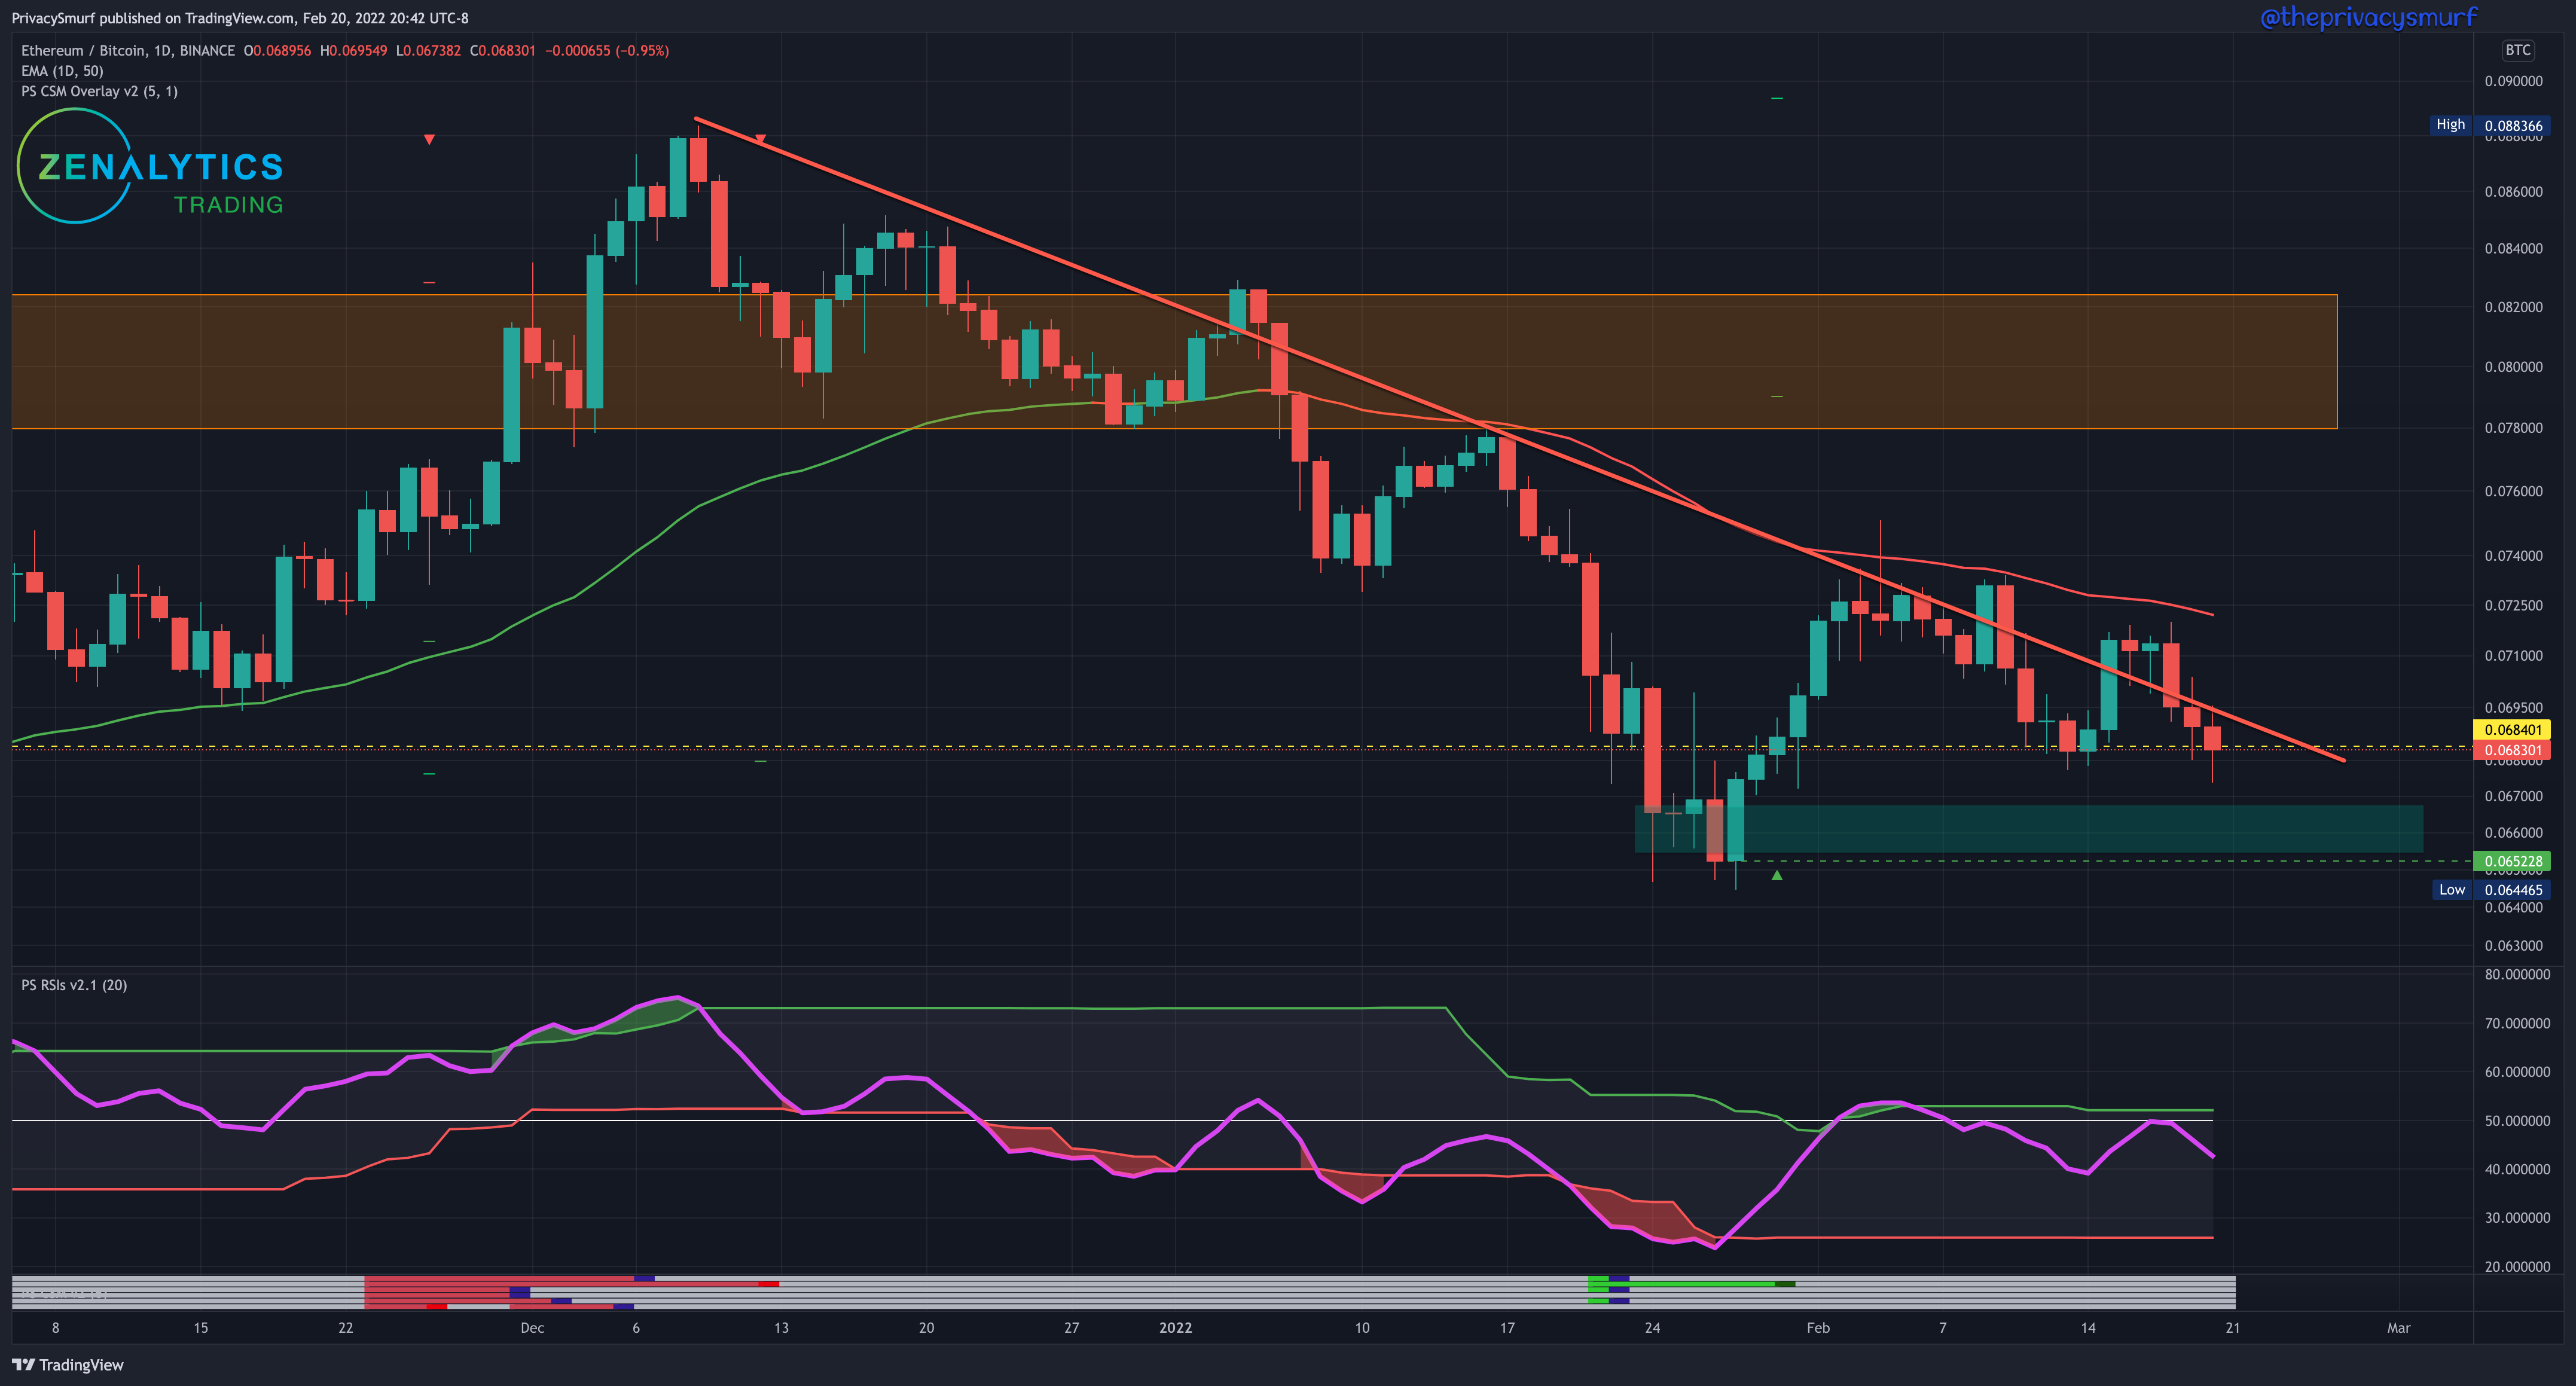
With last week’s projection being on point and the picture largely unchanged I’m just going to repeat myself here too.
On the daily chart, the 0.68 test suggested last week came to pass. A bounce there or a creates a new pivot point for an ascending triangle. The declining RSI measurements don’t give me a lot of confidence in a bullish break
at the moment but I’m not expecting a breakdown yet.The 50-Day EMA, which is in line with the longer descending trendline,will likely be tested again as resistance before prices come down to the 0.068 level again. If the EMA is broken to the upside it’s likely that ETH will have a slight price increase advantage on BTC for the near term.
The pressure here is building. The RSI at the moment doesn’t support the idea of a bullish break but that may change this week. Without looking at technicals on smaller timeframes I’d expect the bearishness to continue with the low support zone being the main floor around 0.0665. Price action below that zone will likely put the ETH/BTC chart into bullish divergence since the RSI is higher than before the mark price was at that level last time in late January suggesting a bullish reversal.
ETH/USDT Weekly Structure
https://www.tradingview.com/chart/JPTp0aXw/
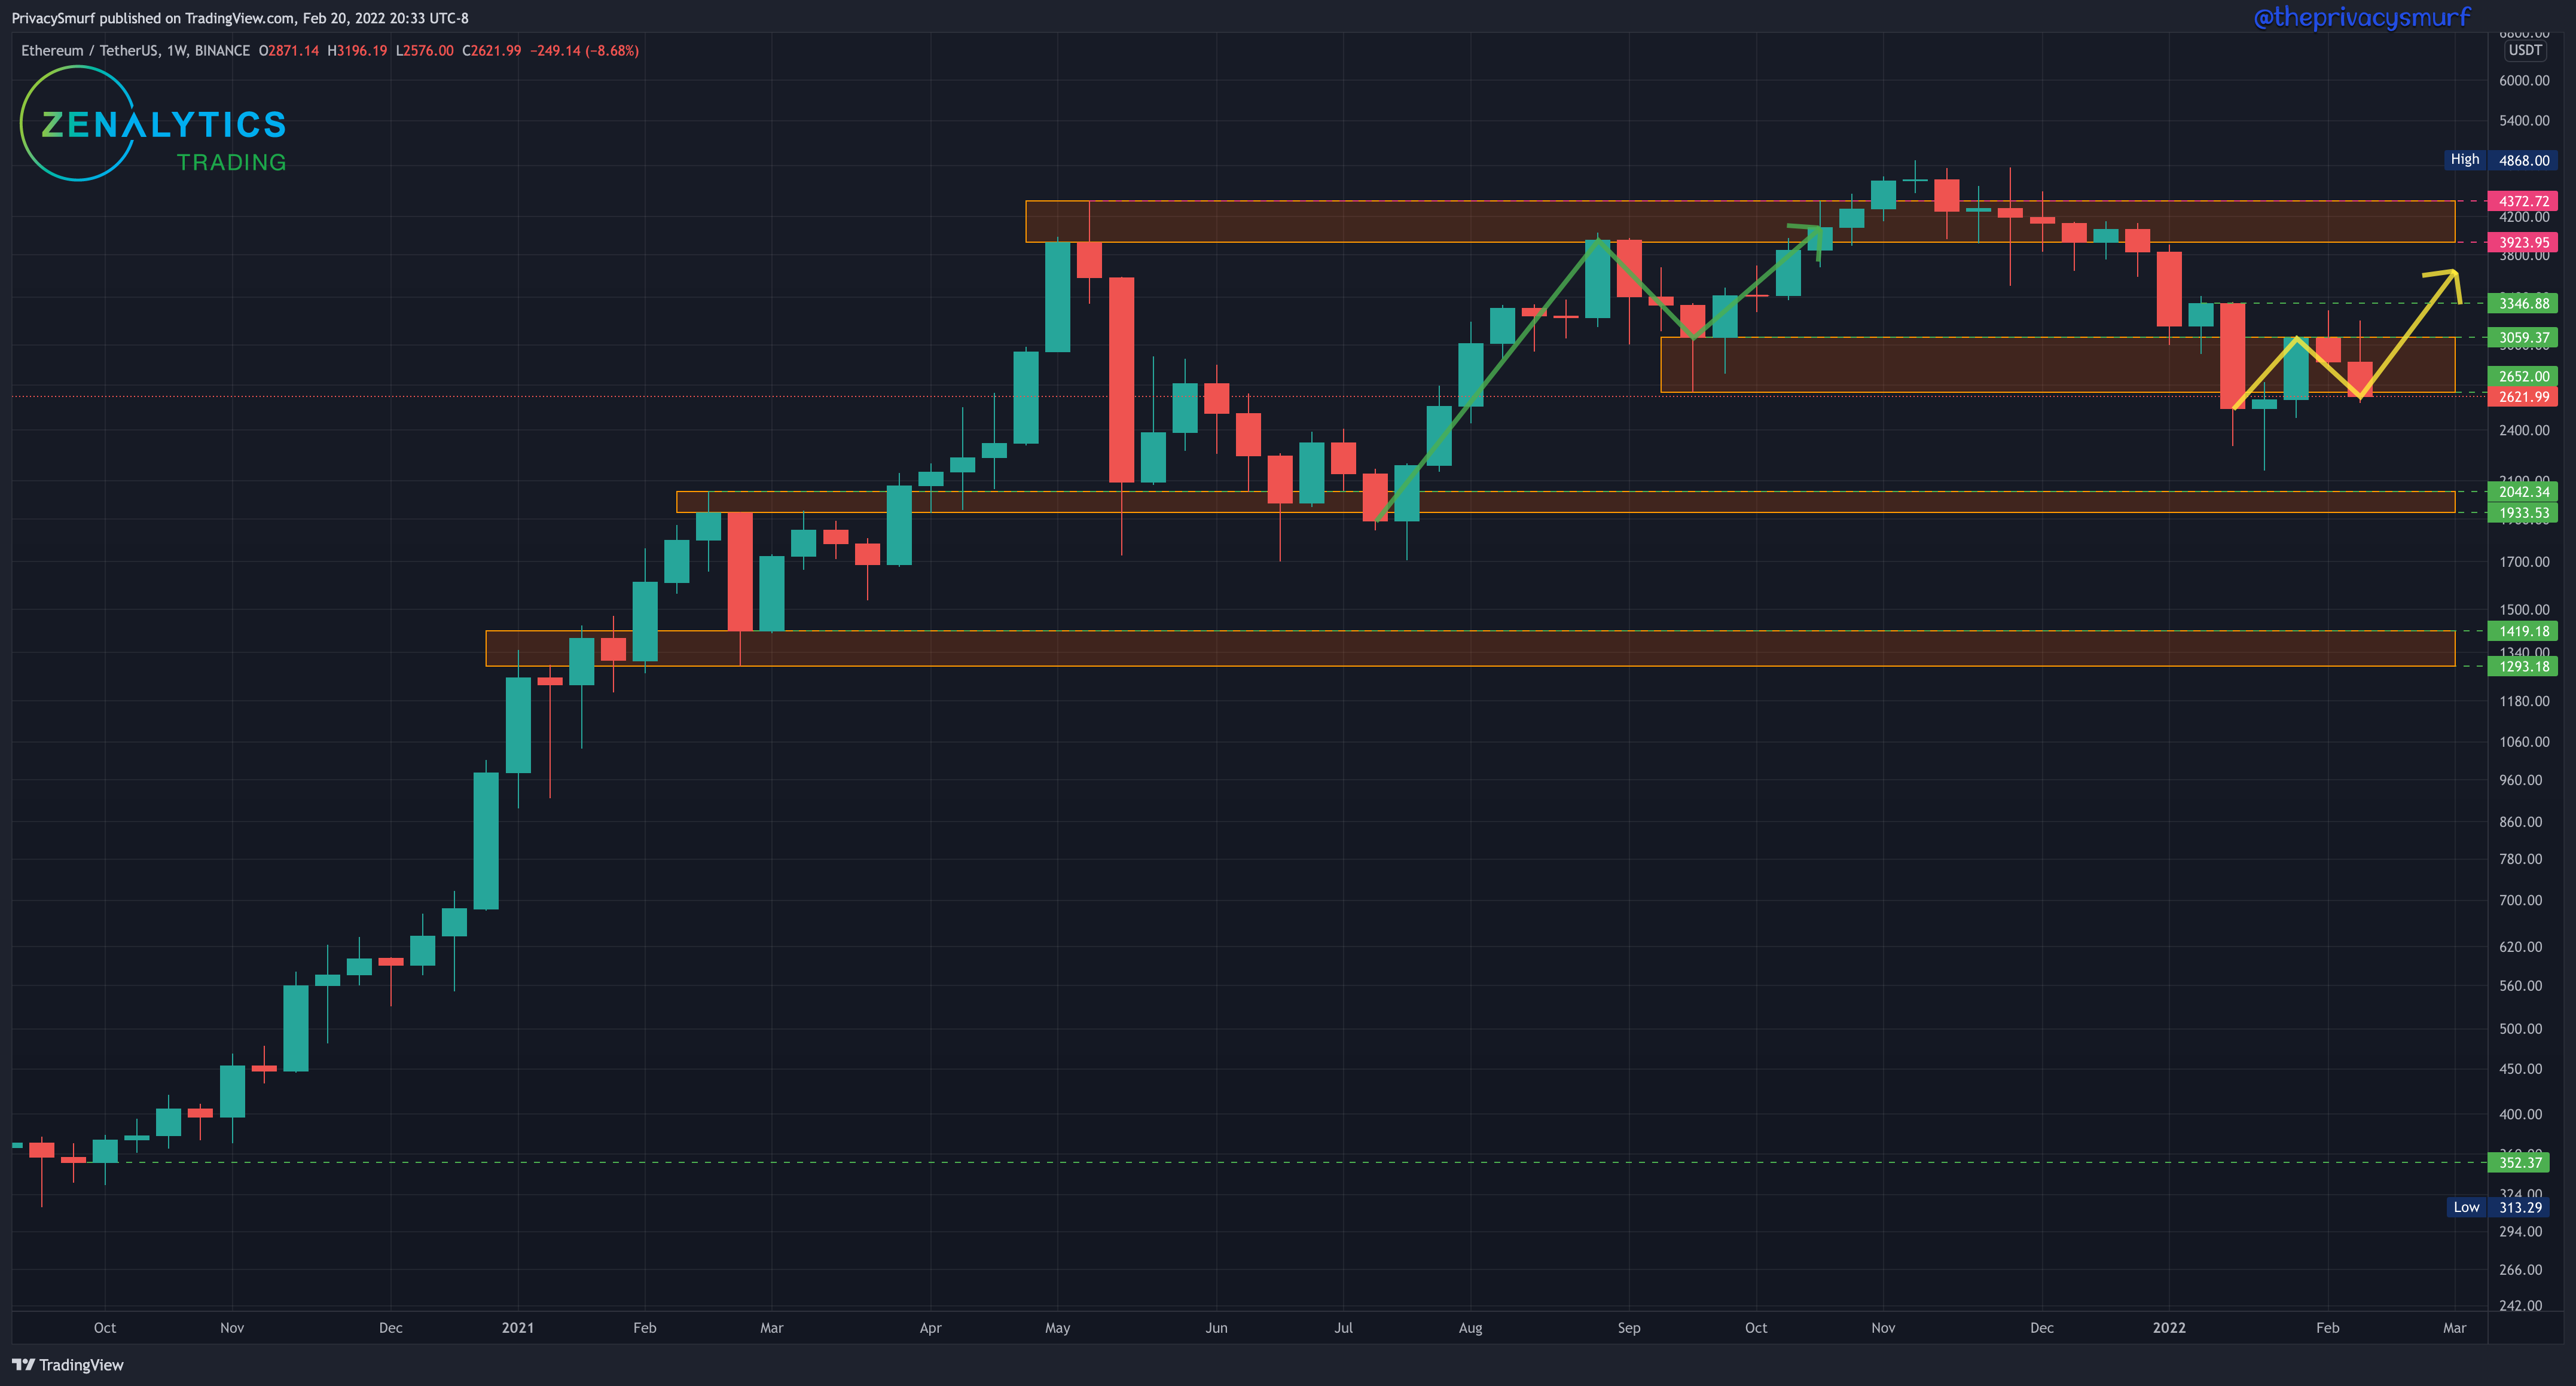
The ETH/USDT weekly chart met and slightly exceeded expectations to the short side last week. If this next part sounds familiar it’s because ETH is currently setting up the same as BTC. If prices rebound from here next week we will set a higher low pivot point. If prices this week or next week close above $3346 we’ll have closed above the last highest high close pivot and will establish a new market structure bullish trend. This week I’d expect the same range inside this support zone as last week with wicking action possibly reaching a bit lower than this past week. While I have lower limit orders at the next lower support just in case for my long-term bags, I wouldn’t be adding any based on price action until the weekly market structure trend turns bullish again.
ETH/USDT Daily Chart
https://www.tradingview.com/chart/xbB6lkZu/
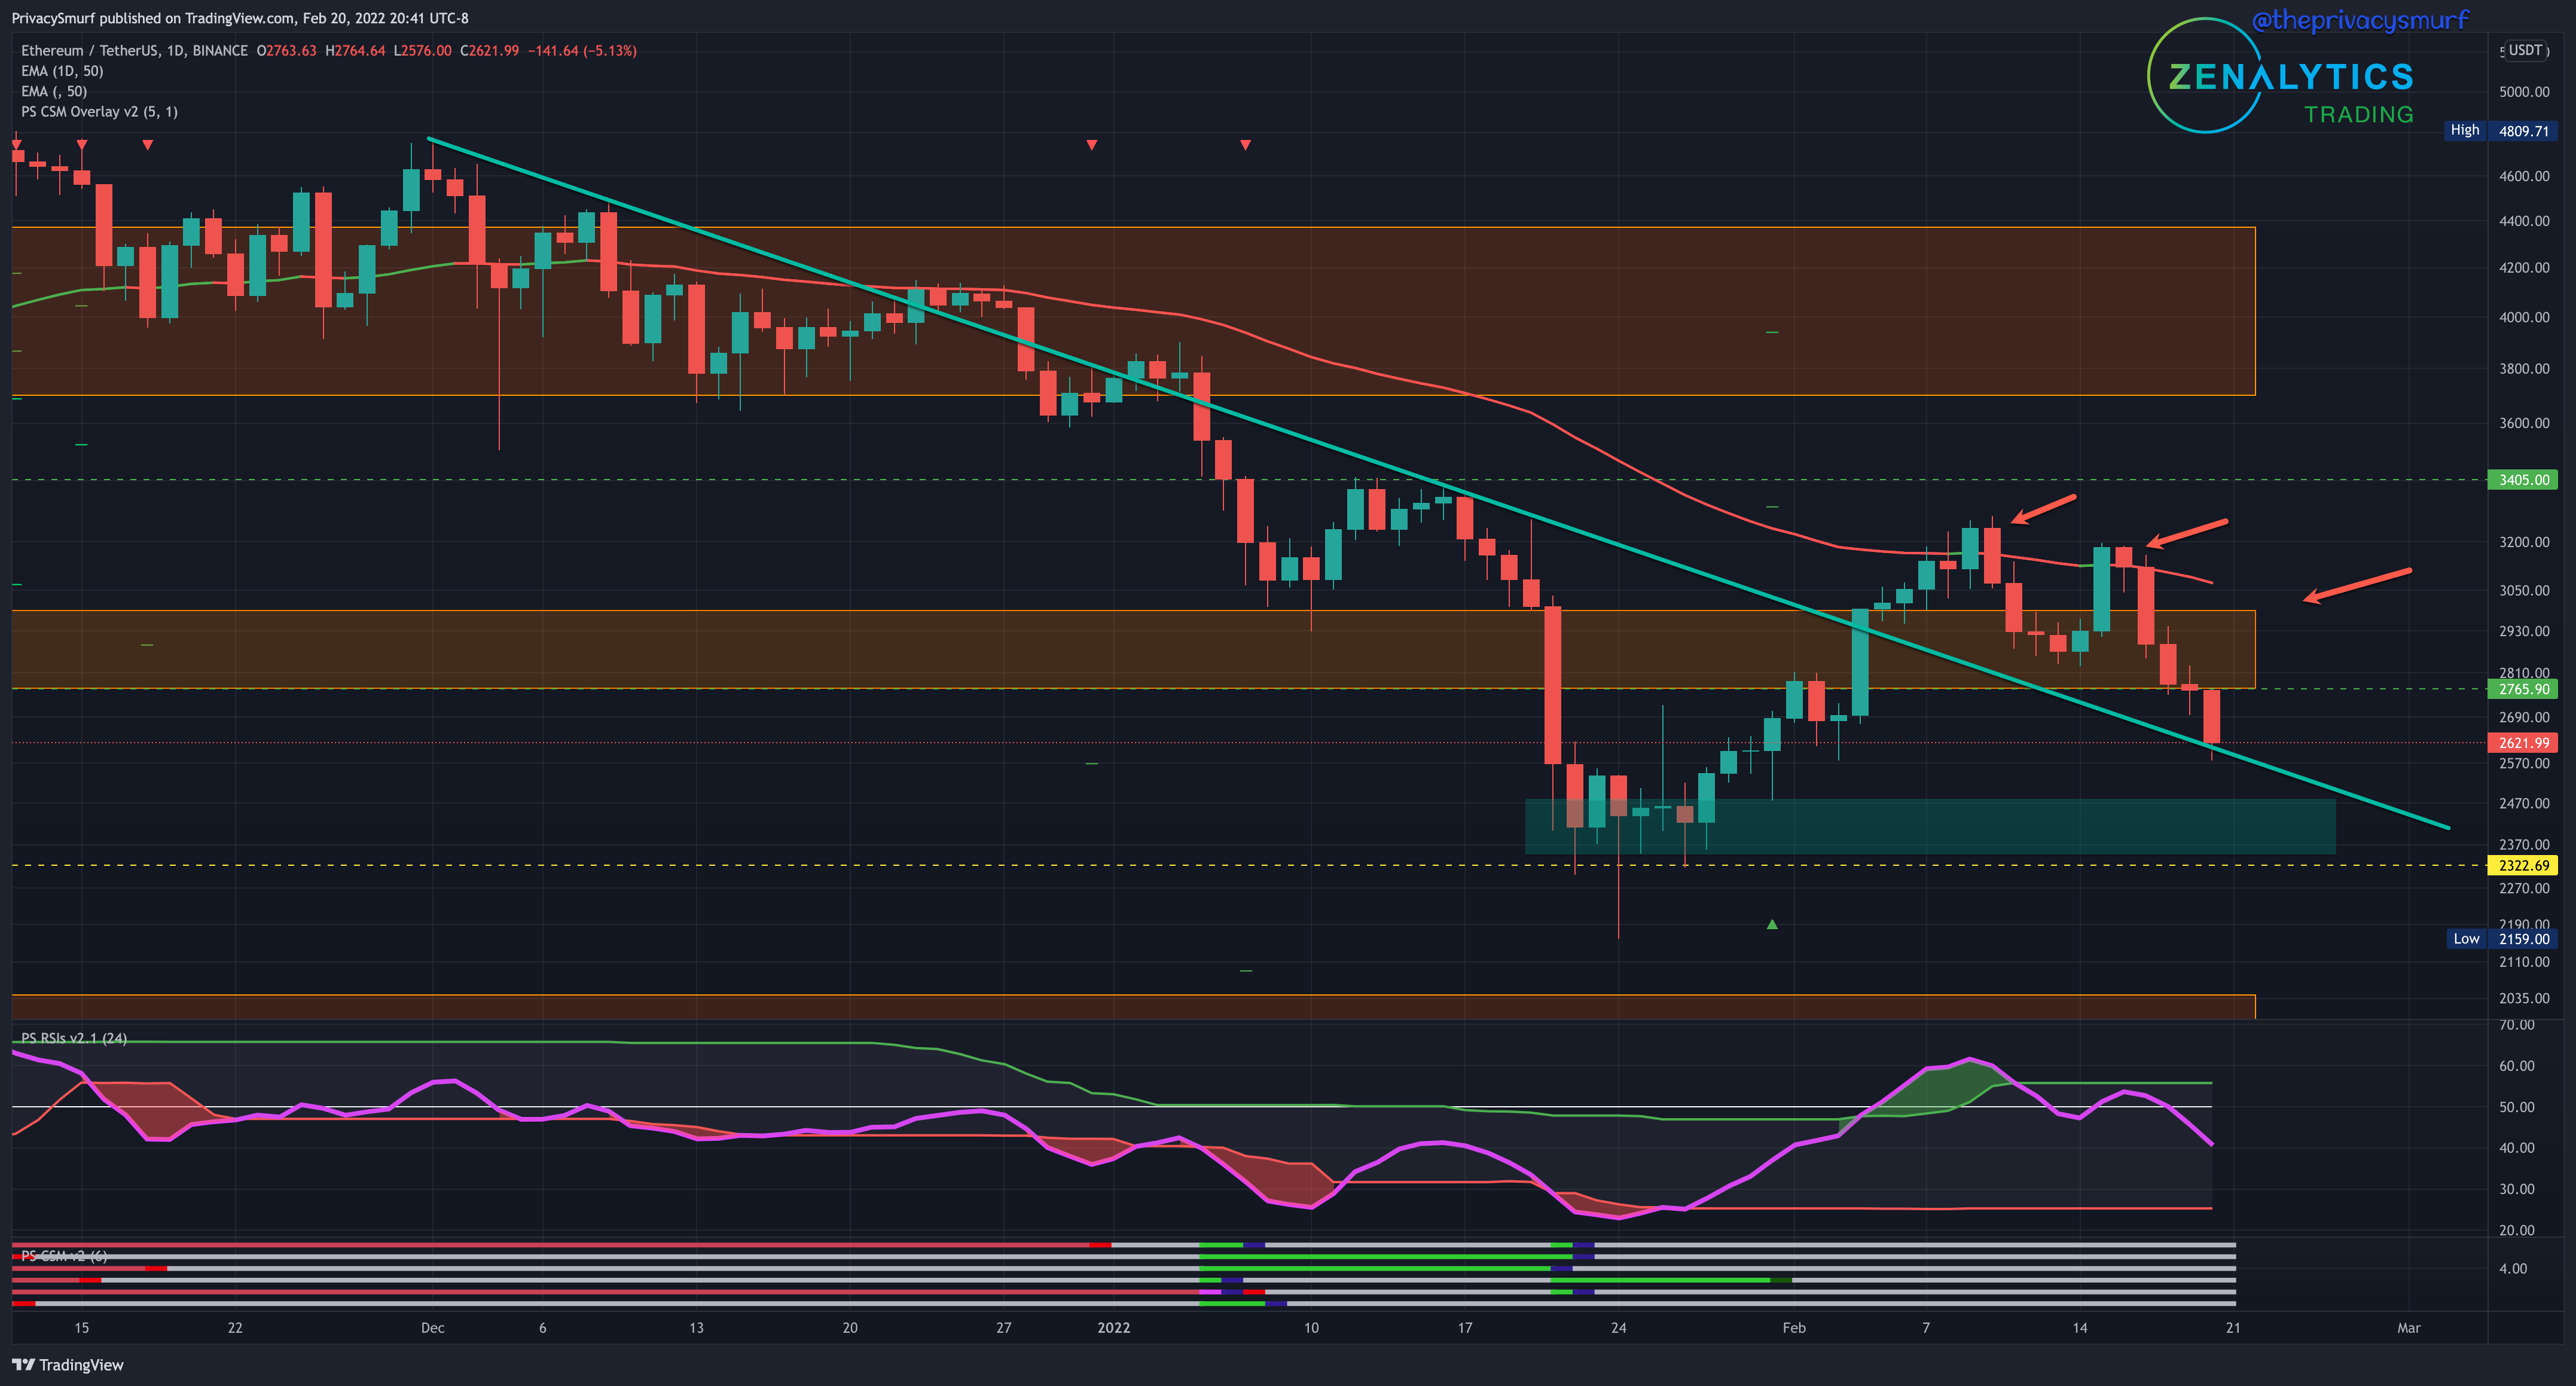
The 50-Day EMA held again as resistance and ETH failed to set a higher high and broke lower than the higher low close pivot at 2871 establishing a daily bearish trend again. It is testing the descending trendline that was broken prior as support but with the RSI trending down in line with the price this week it may test a bit lower. The floor is around $2400. The price action I’m expecting this week with the current picture isn’t wicks around $2500 and highs around $3075.
As I was saying earlier I think there’s a good chance for some bullish action and also some more capitulation this week but I think all the price action to the downside this week will be as bad as it gets. The cycle forecast and suggestions from 2022Q1 are still playing out perfectly and technicals are continuing to support it.

I highly suggest you jump over to the paid side just to get access to these quarterly reports. The 2021Q3 forecast showed the bottom in July and the potential top in Oct/Nov. The 2021Q4 forecast also suggested a cyclical top and I provided things I watch for to exit the market around these peaks. The 2022Q2 forecast will be really important to get an idea of what the new bullish trend will look like, whether it’s a return to all-time highs or just a weaker macro bullish cycle in a larger sideway and/or potentially bearish market.
Have a great week. Again, don’t freak out about some nasty bearish price action. It’s totally possible but things are still not bad yet for the near to short term. I shouldn’t have to say that the long term is fine. Of course, BTC will be up long term.
@theprivacysmurf