

Sunday Synopsis #34: Sober Touch
Sunday Synopsis #34: Sober Touch
This post deserved one after Friday's shenanigans.

Comin at you dry tonight. :-p
BTC/USDT Weekly Structure
https://www.tradingview.com/chart/4v8qizyI/

Another week and another shooting star for BTC. The close BARELY stayed above the most recent lowest close staying above $37699. There is plenty of selling in the market but there’s still enough buying to keep closing prices up. A double shooting star is a bearish indication and often a sign of reversals during bullish trends (see the relevant patterns I like by clicking here). This week, I am carrying over the possibility of lower prices wicking below the $36k level. As long as weekly closes stay above $36.2k the bearish trend is still possible in the near term. That level to declare a bullish trend would be closing above $42.3k.
BTC/USDT Daily Chart
https://www.tradingview.com/chart/jjSdFW4b/
I posted a chart in a private group this past week illustrating that despite all the volatility BTC was still setting higher closes and there’d be no reason to start being concerned about weakness until those levels started failing.

Apparently, BTC heard me and said “hold my beer” and promptly closed lower than the last pivot point at $38k. While that is an unfortunate step backward for the structure of the forming of a bullish trend prices are still firmly in the established range seen by the white dotted lines below.
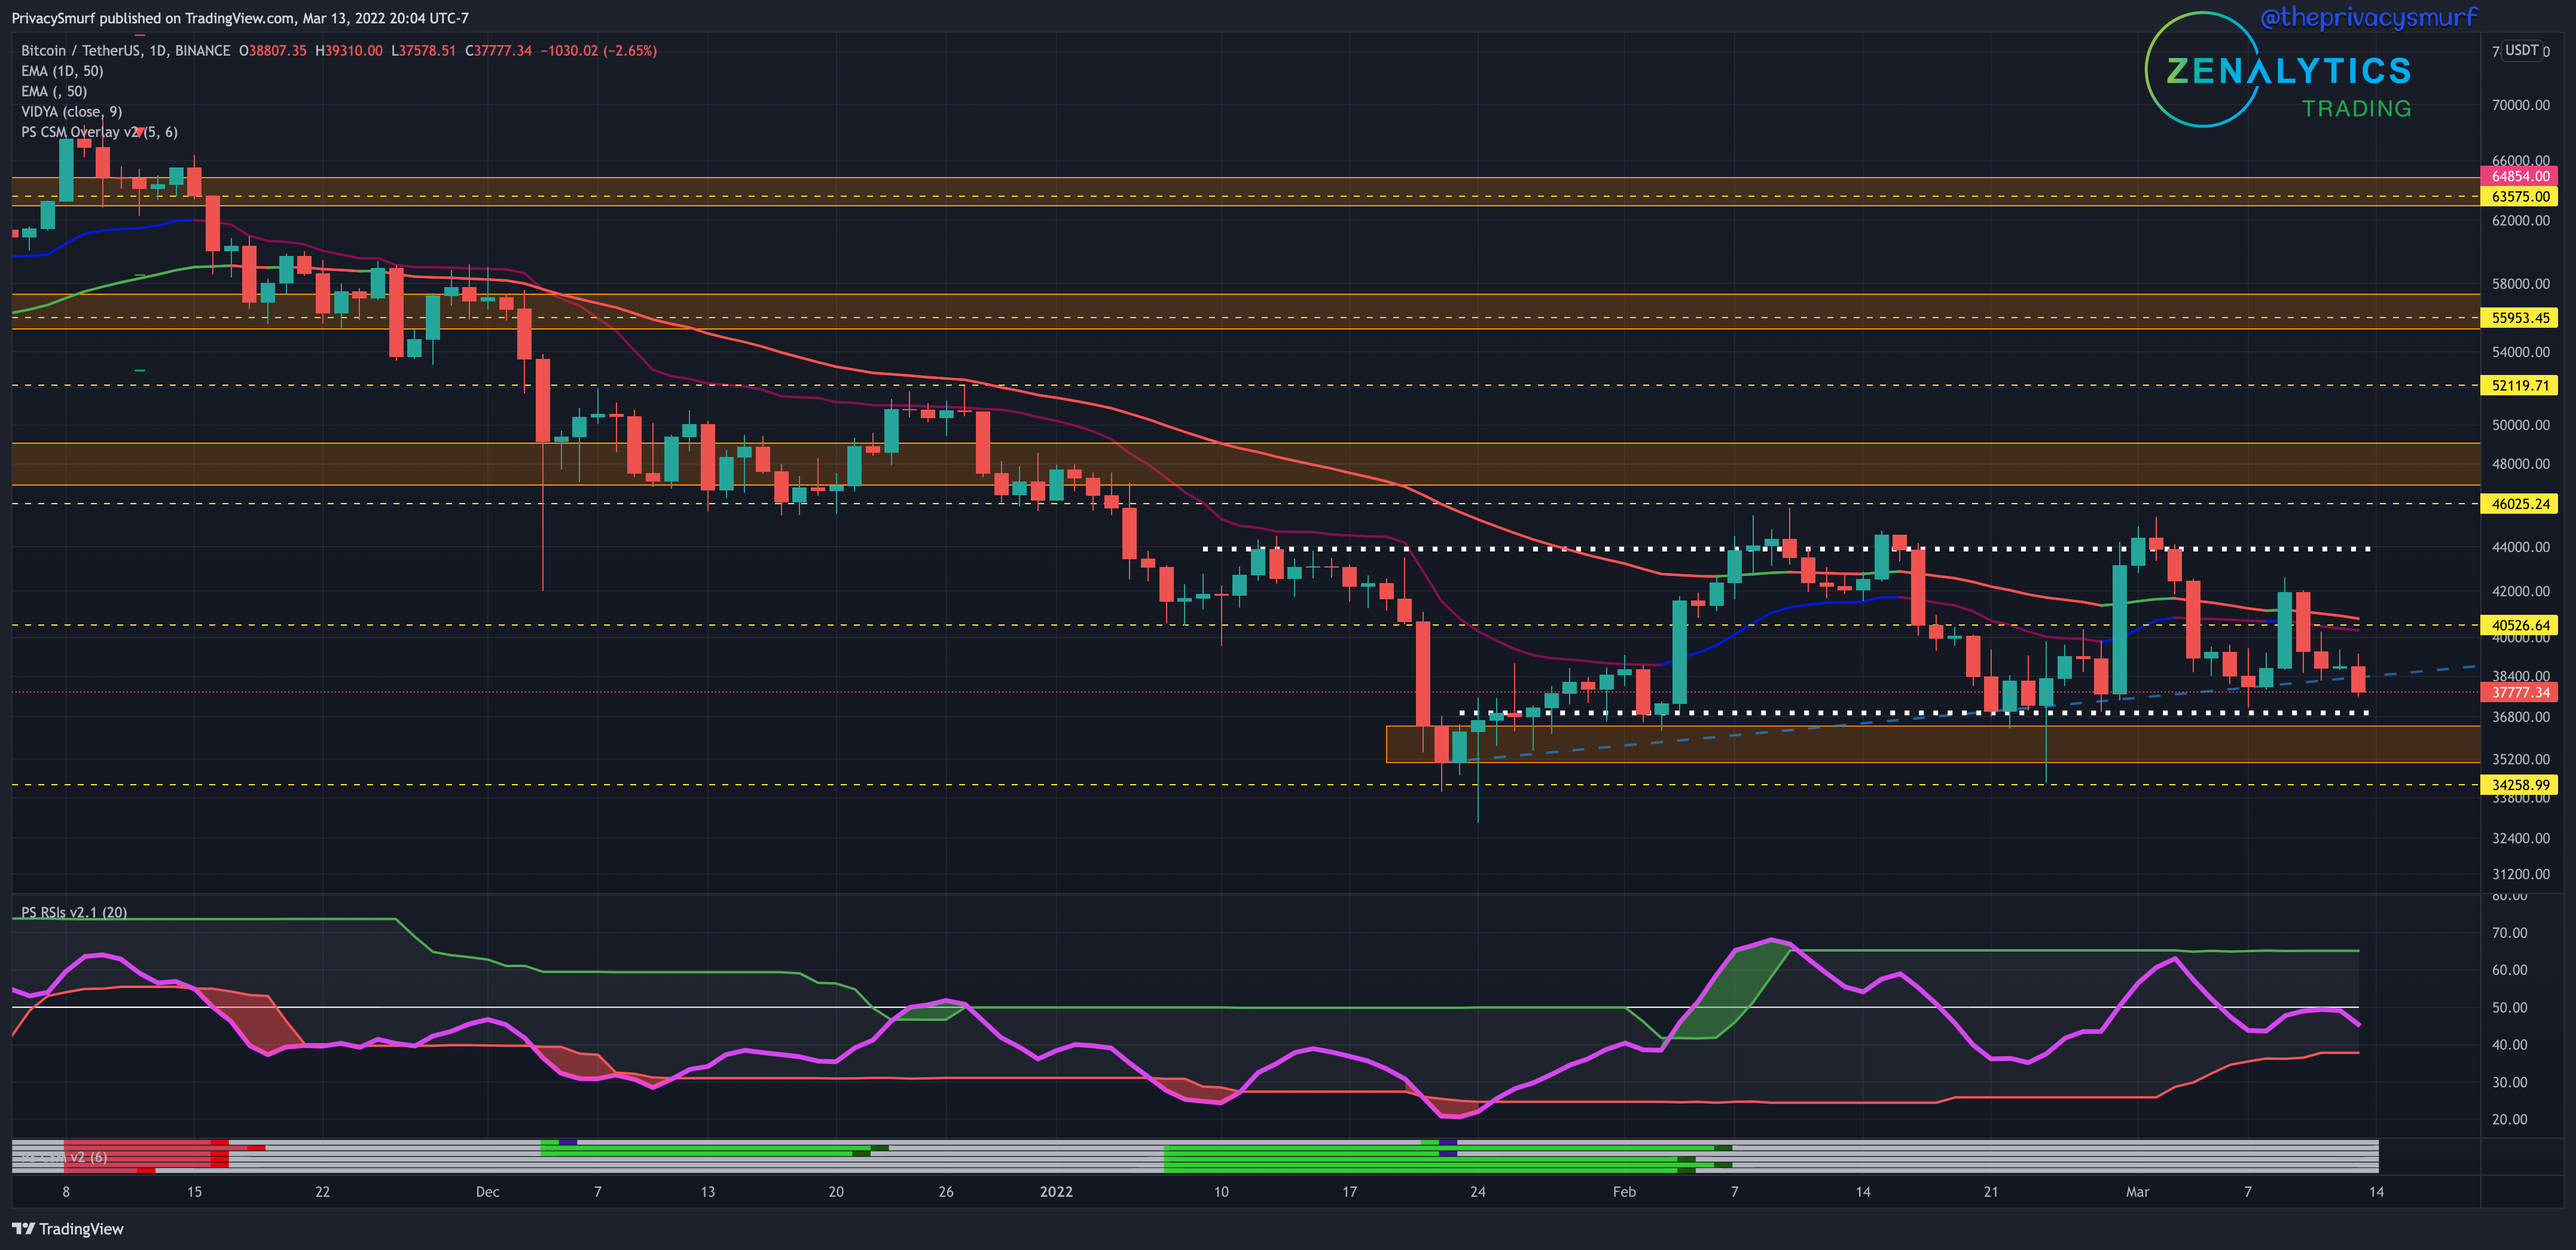
With the RSI bottom band creeping up and the RSI failing a test of the midline trending towards a bottom band break I’d expect prices to return to the bottom support range this week minus the presence of bulls at the weekday open. I haven’t shared many details on the preparation for the q2 forecast but I did send out a sneak peek on twitter expressing why I wasn’t worried about decreasing prices in the near term. All is going according to projections.


It’s entirely possible we need a capitulation wick below the support zone to wipe out some leverage but that’s high speculation. The positioning of daily closes is still the thing to monitor and as to not be swayed into abandoning bullishness on what could easily be bottom wicks by the time the closing bell comes in for the day.
ETH/BTC Weekly Structure
https://www.tradingview.com/chart/sacHlXOv/
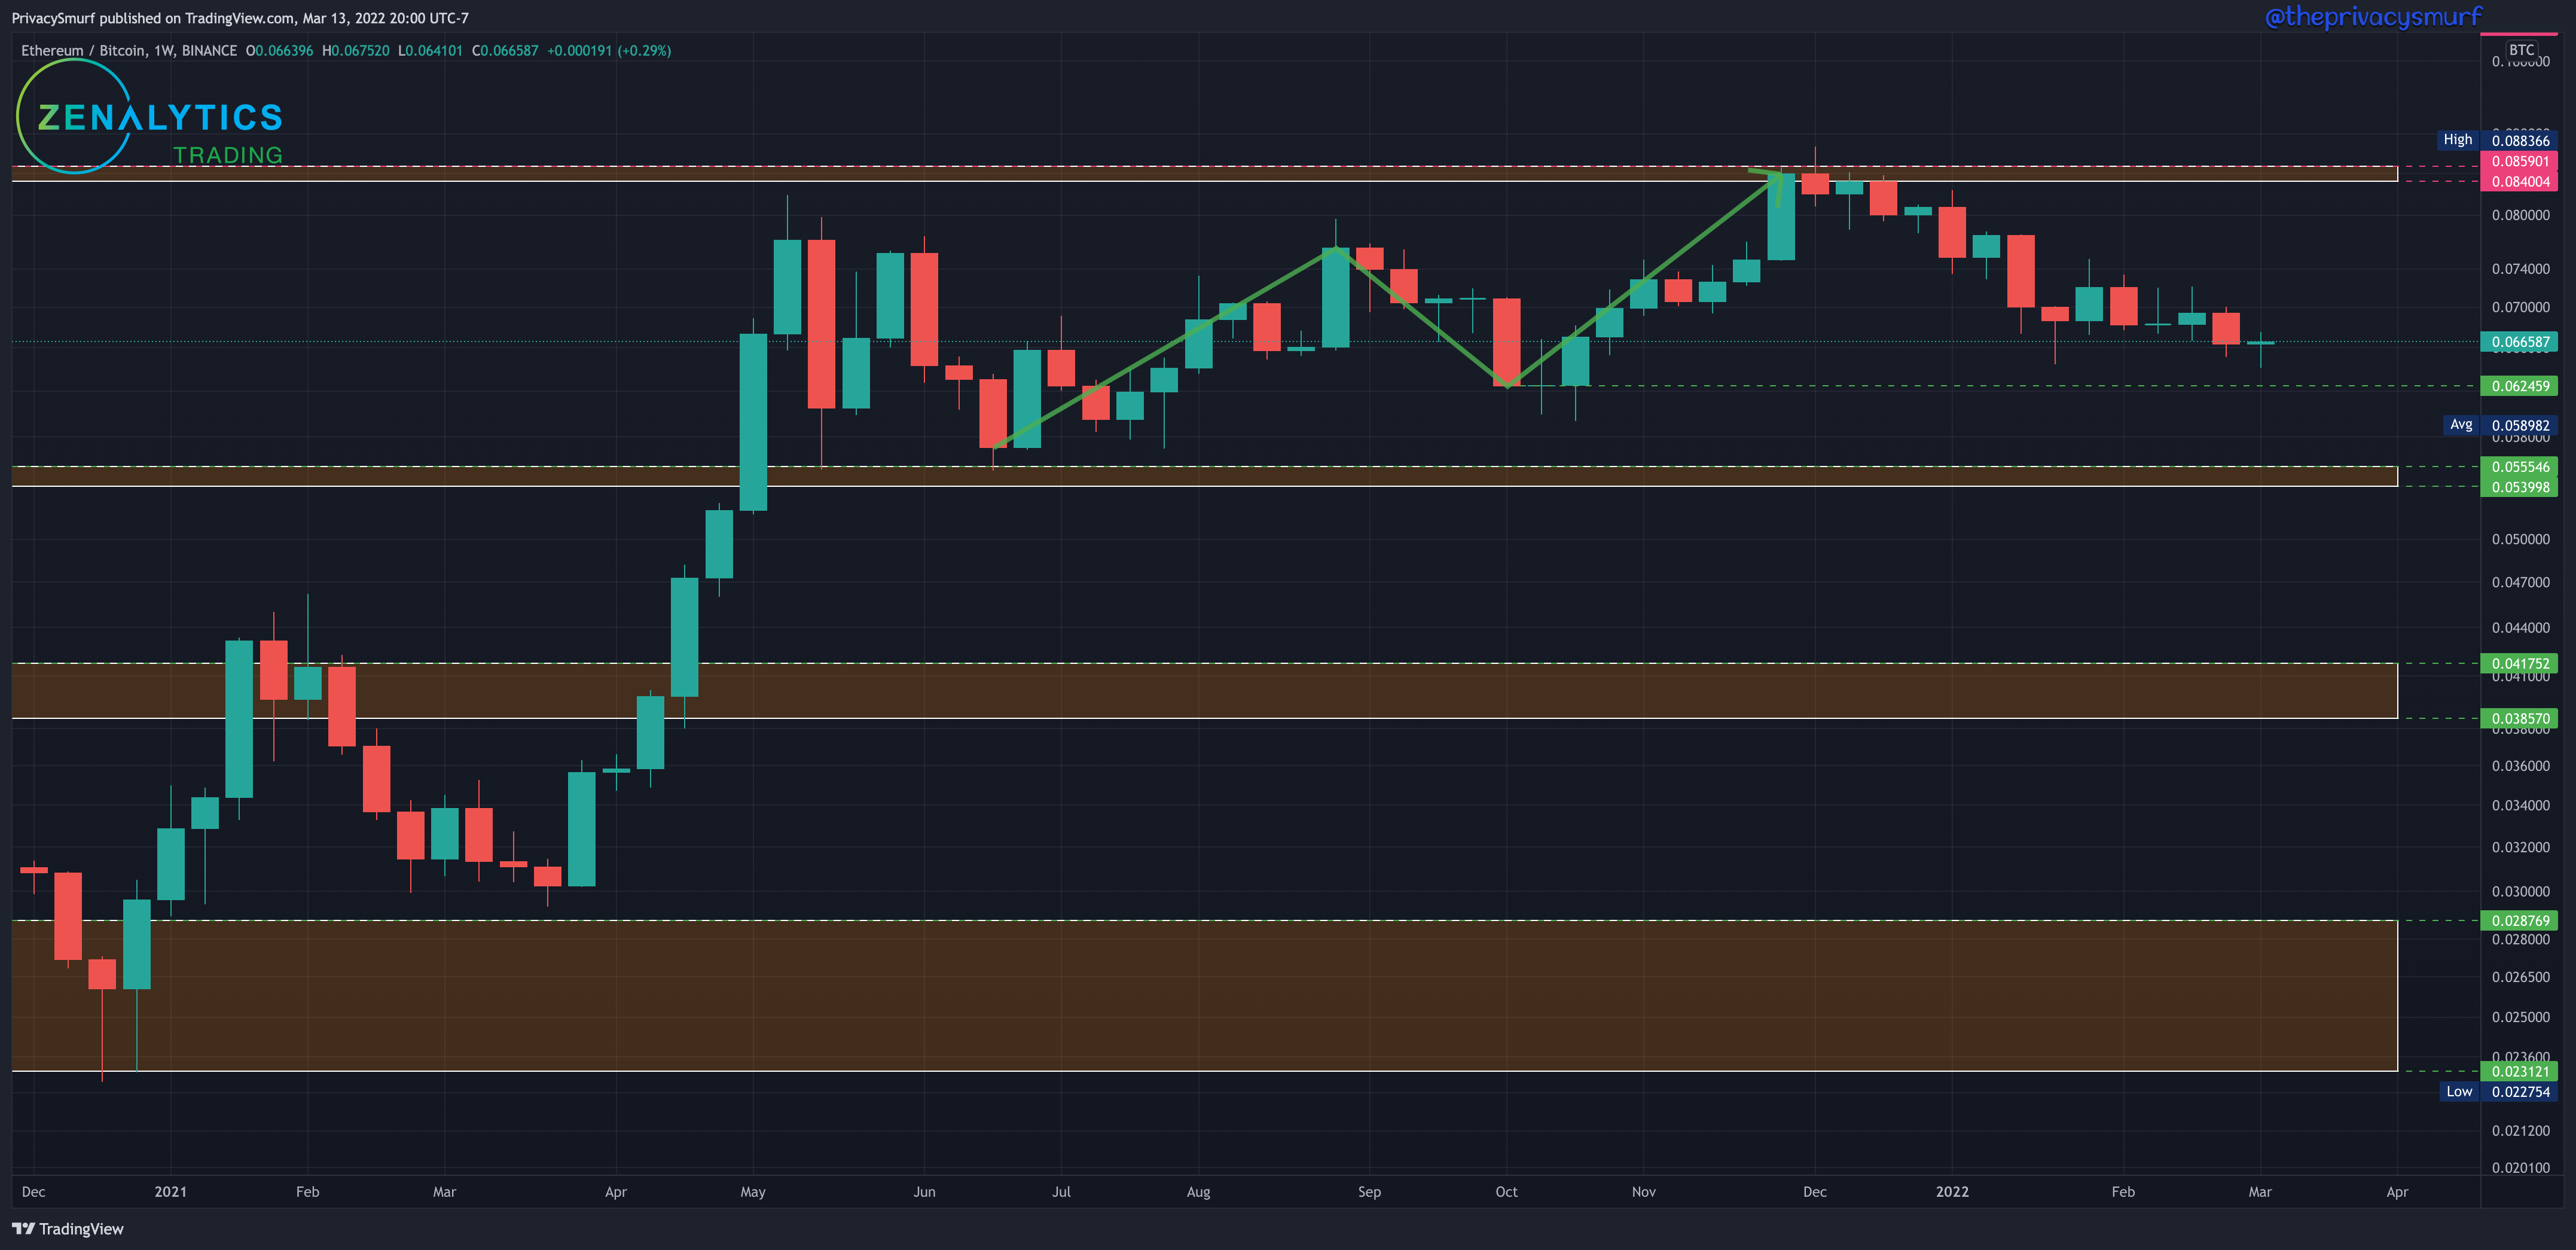
Another week of poor performance of ETH relative to BTC. Same news as last week unfortunately.
The market structure still technically remains bullish until a close below the last support at the 0.0624 mark. In the event of that close, the BTCUSD weekly structure has likely broken bearish as well as ETHUSD. The potentials for further long-term bearishness creep in at that point. While rotations to BTC or cash may be preferable for some, I typically prefer to not sell out completely of my BTC and ETH and would just focus on yield-bearing options for these assets OR use BTC and ETH as collateral to borrow stablecoins to put into yield-bearing protocols. That being said, I’m not expecting a close below the support this week.
ETH/BTC Daily Chart
https://www.tradingview.com/chart/gTkSjkj6/
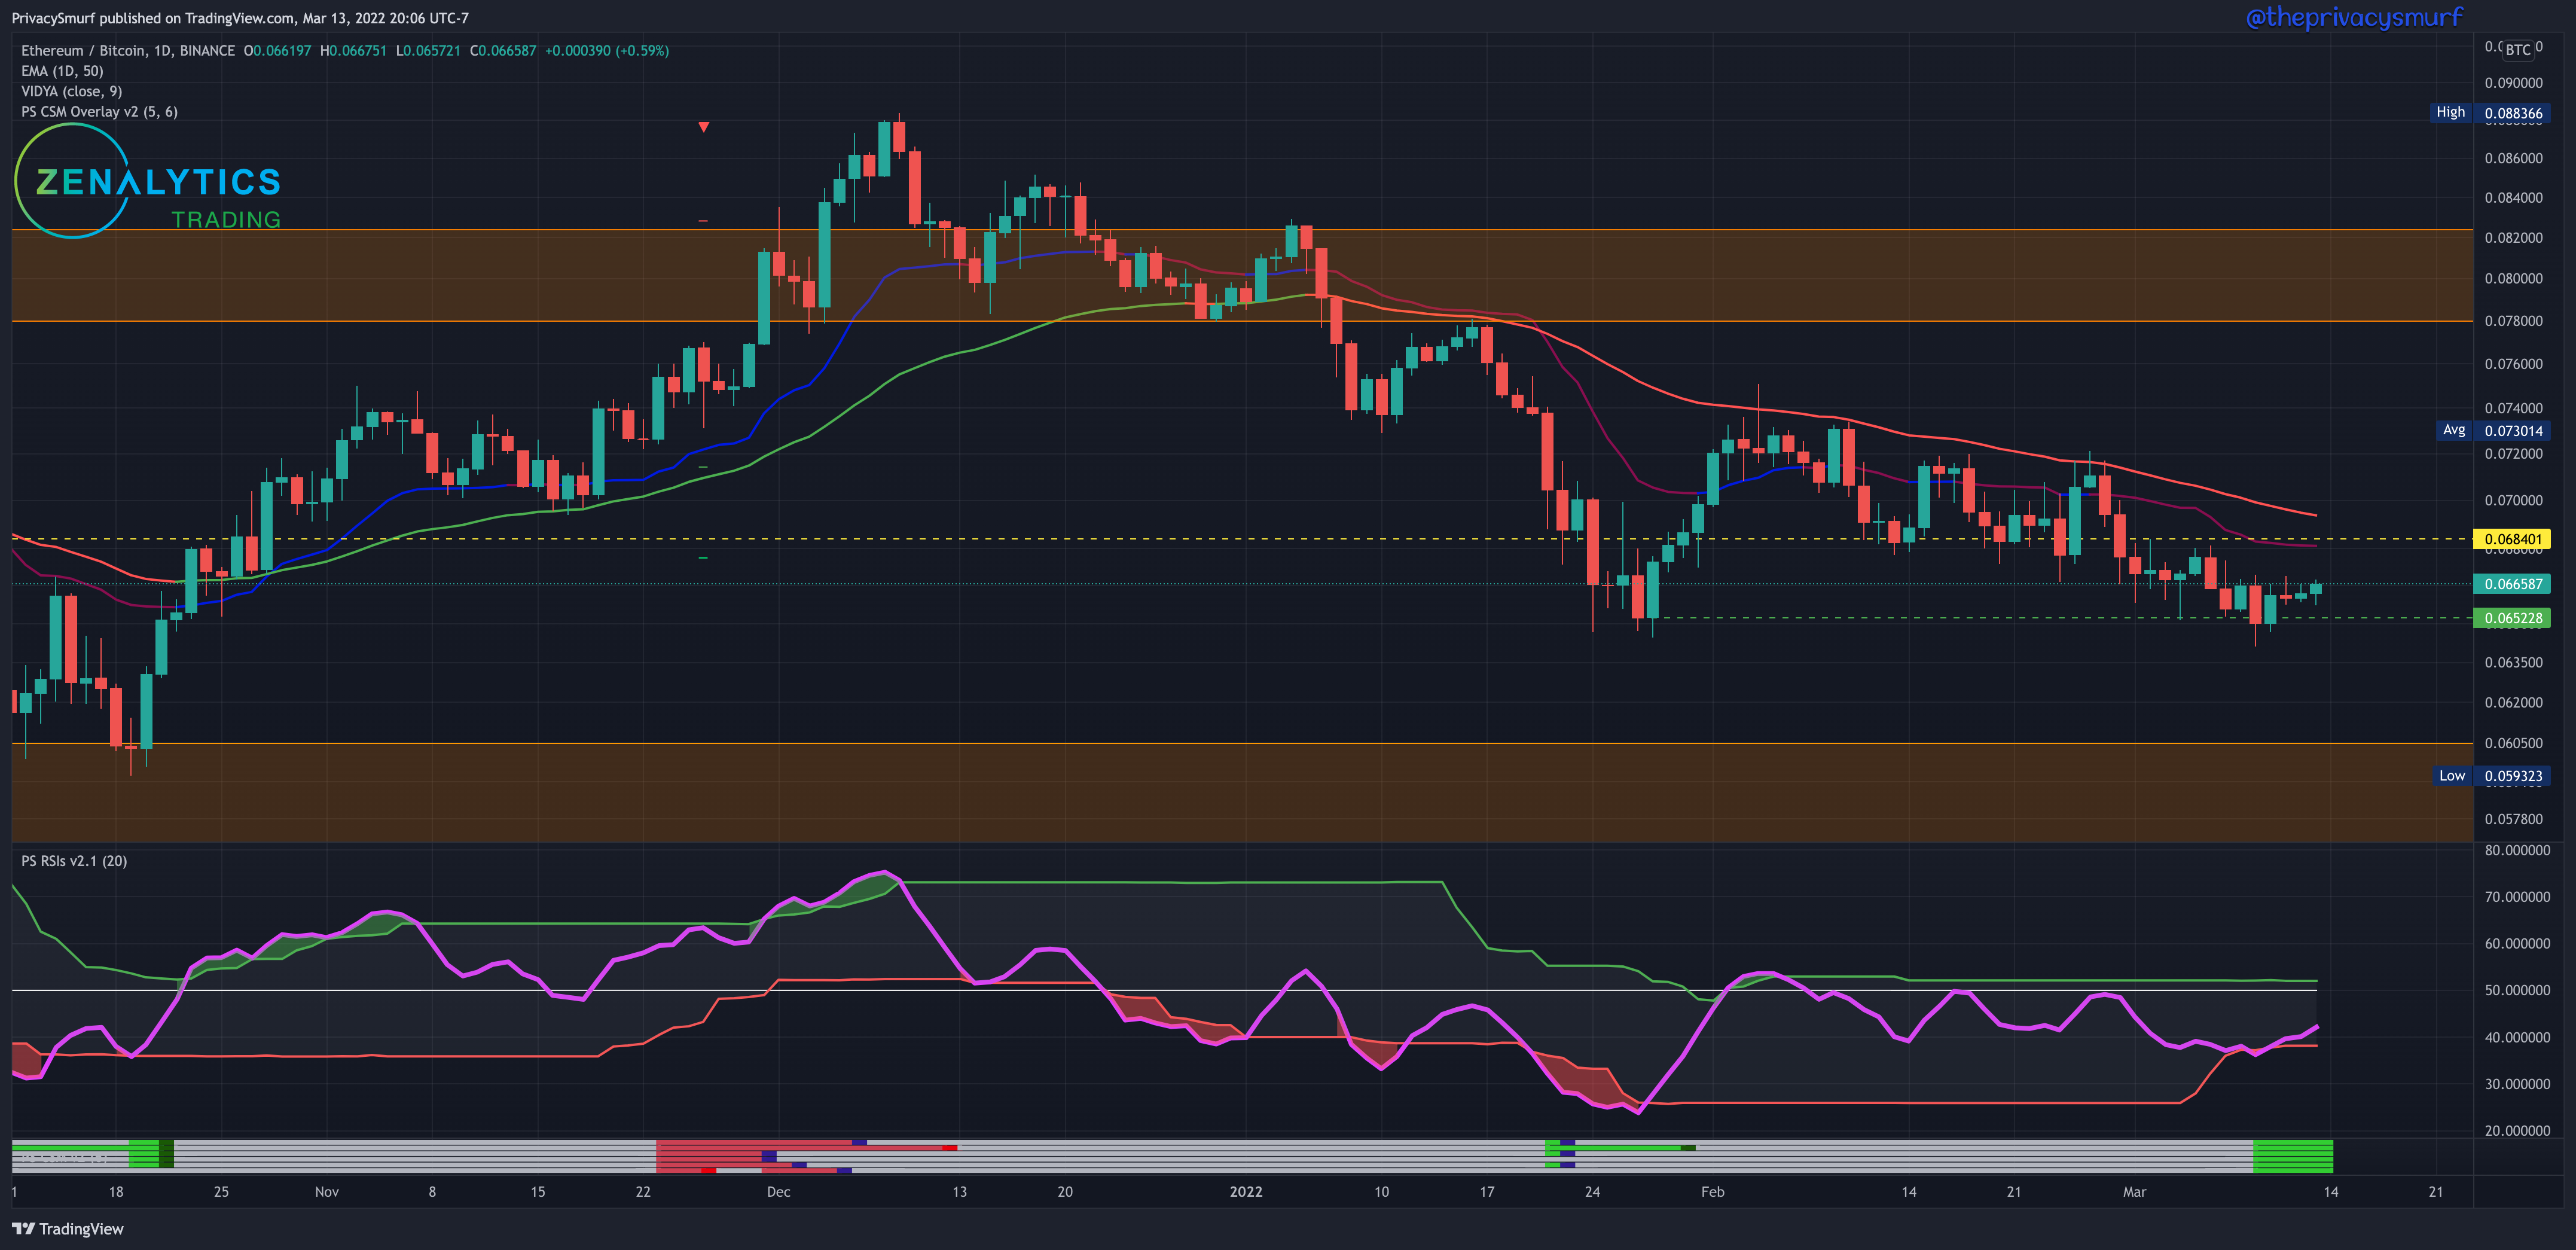
Not too different than last week here either.
There’s
really nothing bullish at allsome new bullish potential with this chart. The Smurf Correction Strength Meter on the bottom of the chart is showing bullish divergences on multiple oscillators highlighting the potential for a bullish correction. The compression of price action by the 50-Day EMA and the low support at the 0.0652 mark will likely lead to some volatility. The RSI is no longer trailing down and the bottom band is still creeping up. Without some additional buy volume, I’d be anticipating a downside break of the bottom band on the RSI thus a downside break of the 0.0652 support. Even with a bullish break, I’m not expecting any closing prices above the 50-Day EMA.
ETH/USDT Weekly Structure
https://www.tradingview.com/chart/JPTp0aXw/
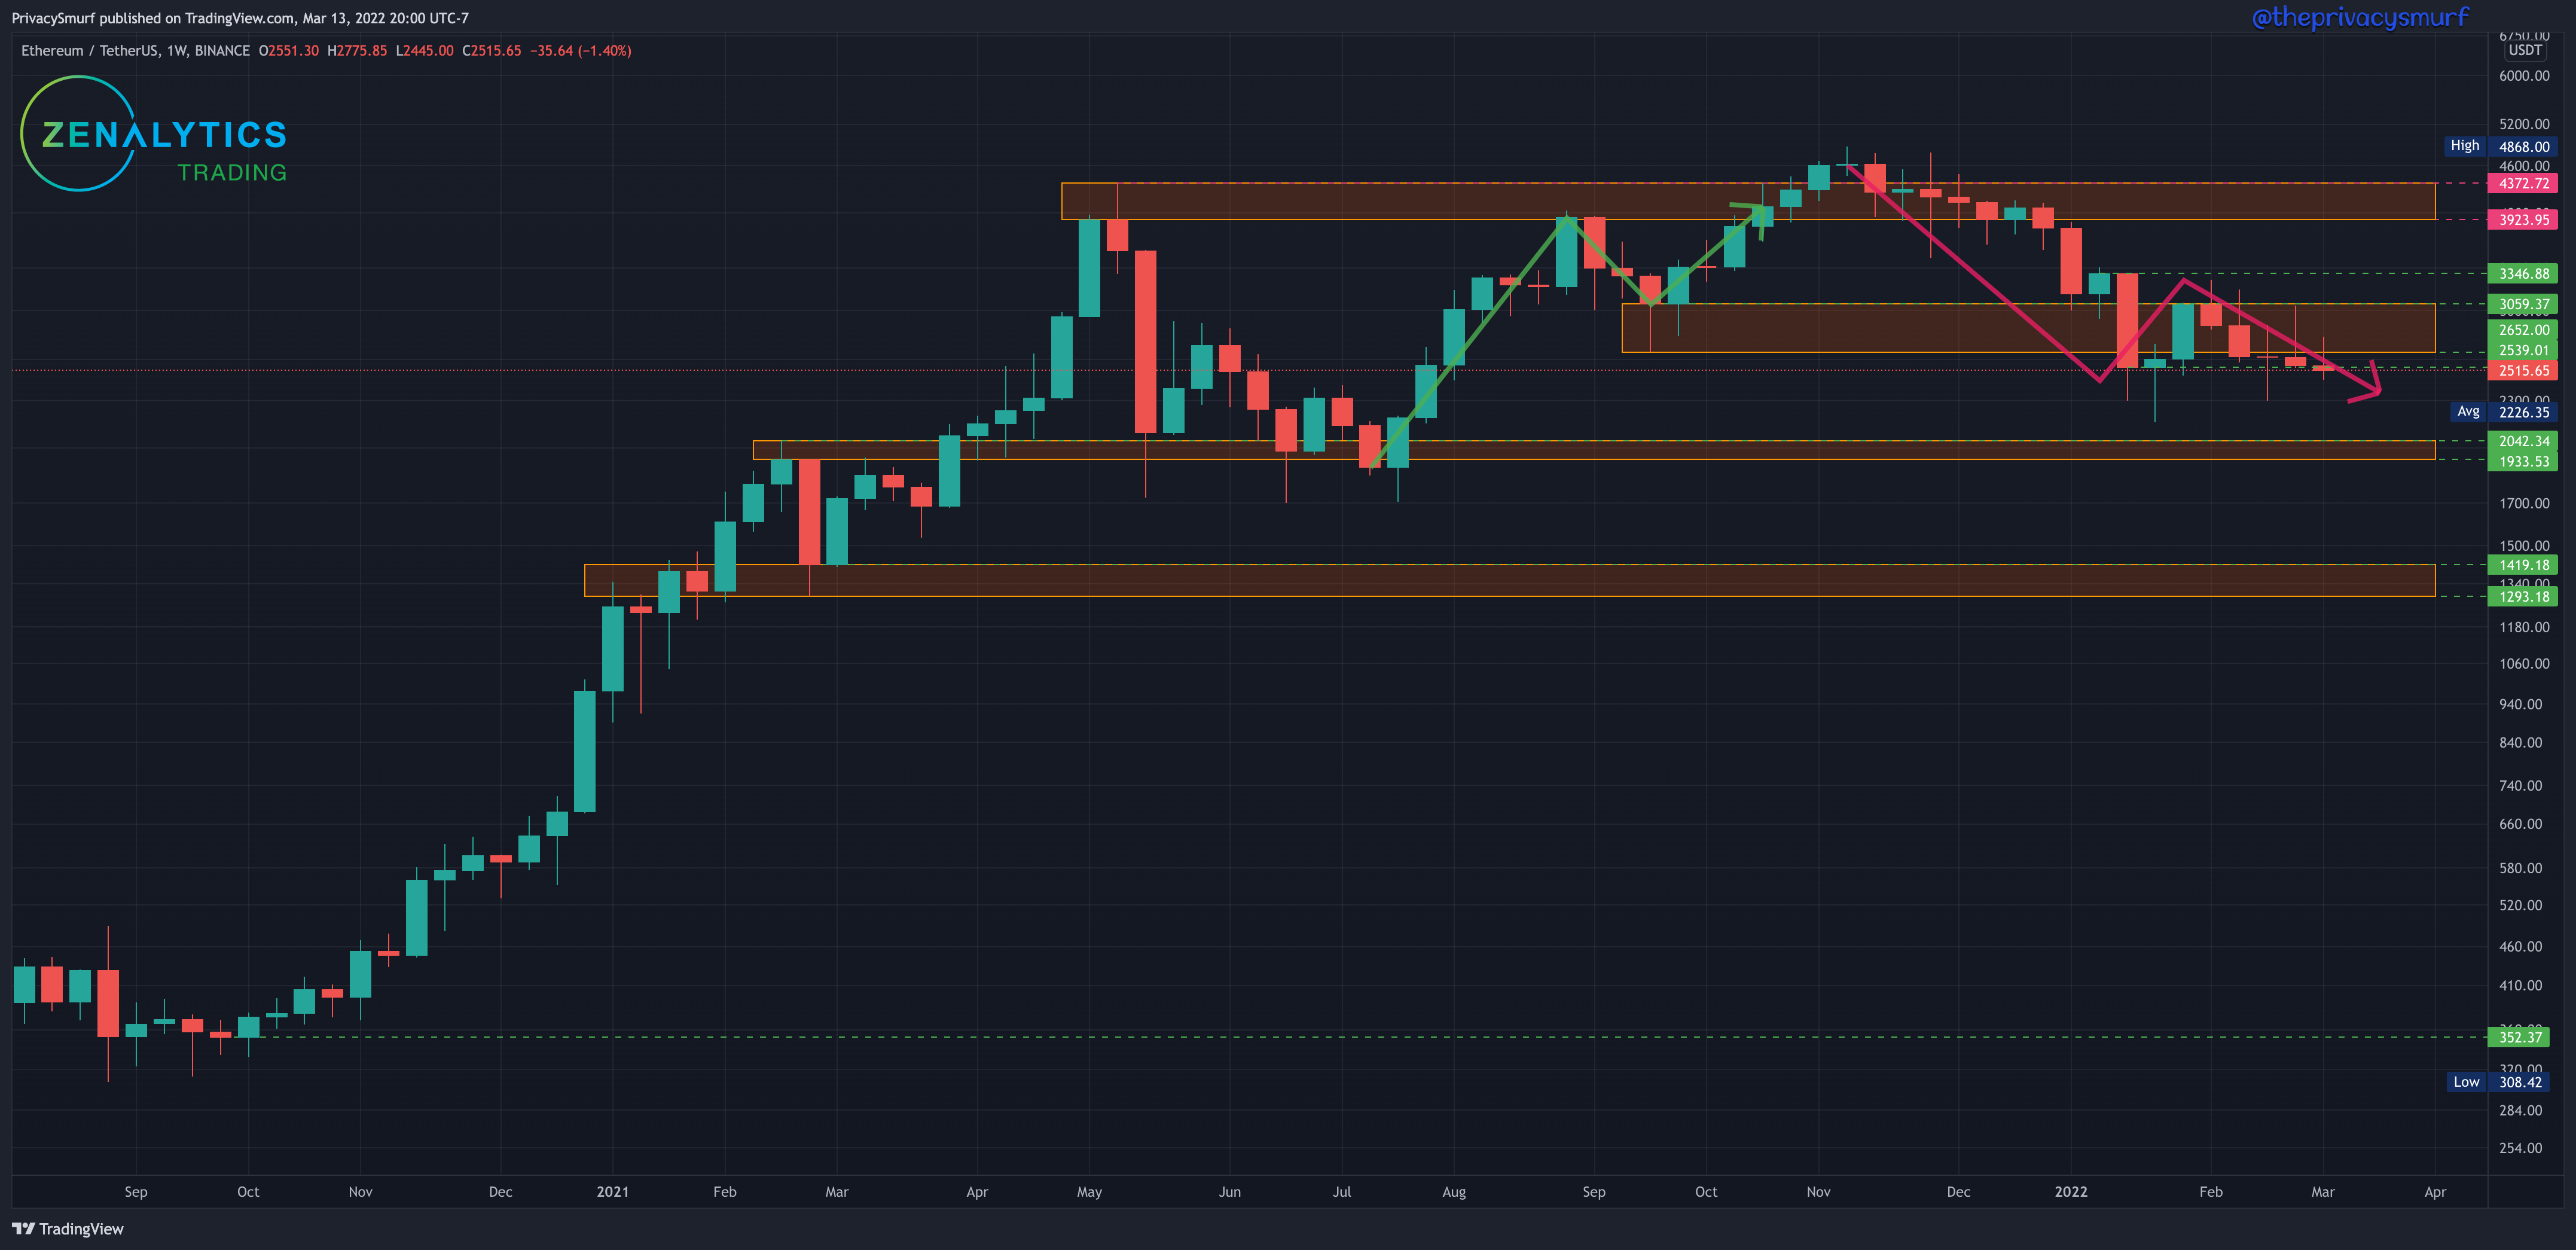
Again the weekly chart of ETH shows a similar shooting star candle pattern suggesting bearish price continuation. This time it closed beneath the lowest weekly close which is a negative sign for ETH as it confirms a bearish weekly trend. Testing the prior lows is very possible in the coming week. Some semblance of support may be found there at $2159 if it is tested. The daily chart may help determine the likelyhood of that this week.
ETH/USDT Daily Chart
https://www.tradingview.com/chart/xbB6lkZu/

ETH is still firmly in a downtrend. The bottom band of the RSI is creeping up again suggesting potential volatility to the downside if it is broken below. I would suspect that would come with the failure out of the bottom of the current range and testing of the prior lows around $2159. With no sign of bullish divergences, there’s no reason to suspect major bullishness out of this trend or a bullish break above the 50-Day EMA or a break above the range. Bulls will have to step in to do that and there are no technical indications here to support that. We can all hope for a pump at the weekday open though.
I know things look bleak, but really we still aren’t out of the same range we’ve been in for weeks and weeks. It’s honestly not that much different than last summer. There are a lot of conflicting technical signals. In these moments important to just pay attention to support levels, pay attention to the underlying market structure, and the agreement of indicators/oscillators to price action. Ignore not the volatility and emotions. Also, even though I haven’t shared yet the cycles are still supported by the current price action and they are all lining up to point bullish very soon.
@theprivacysmurf
Thanks Smurf, now I can go to sleep :)