

Sunday Synopsis #35: The Distance
Sunday Synopsis #35: The Distance
Reluctantly crouched at the starting line.

Gotta love 90’s baggy suits.
BTC/USDT Weekly Structure
https://www.tradingview.com/chart/4v8qizyI/
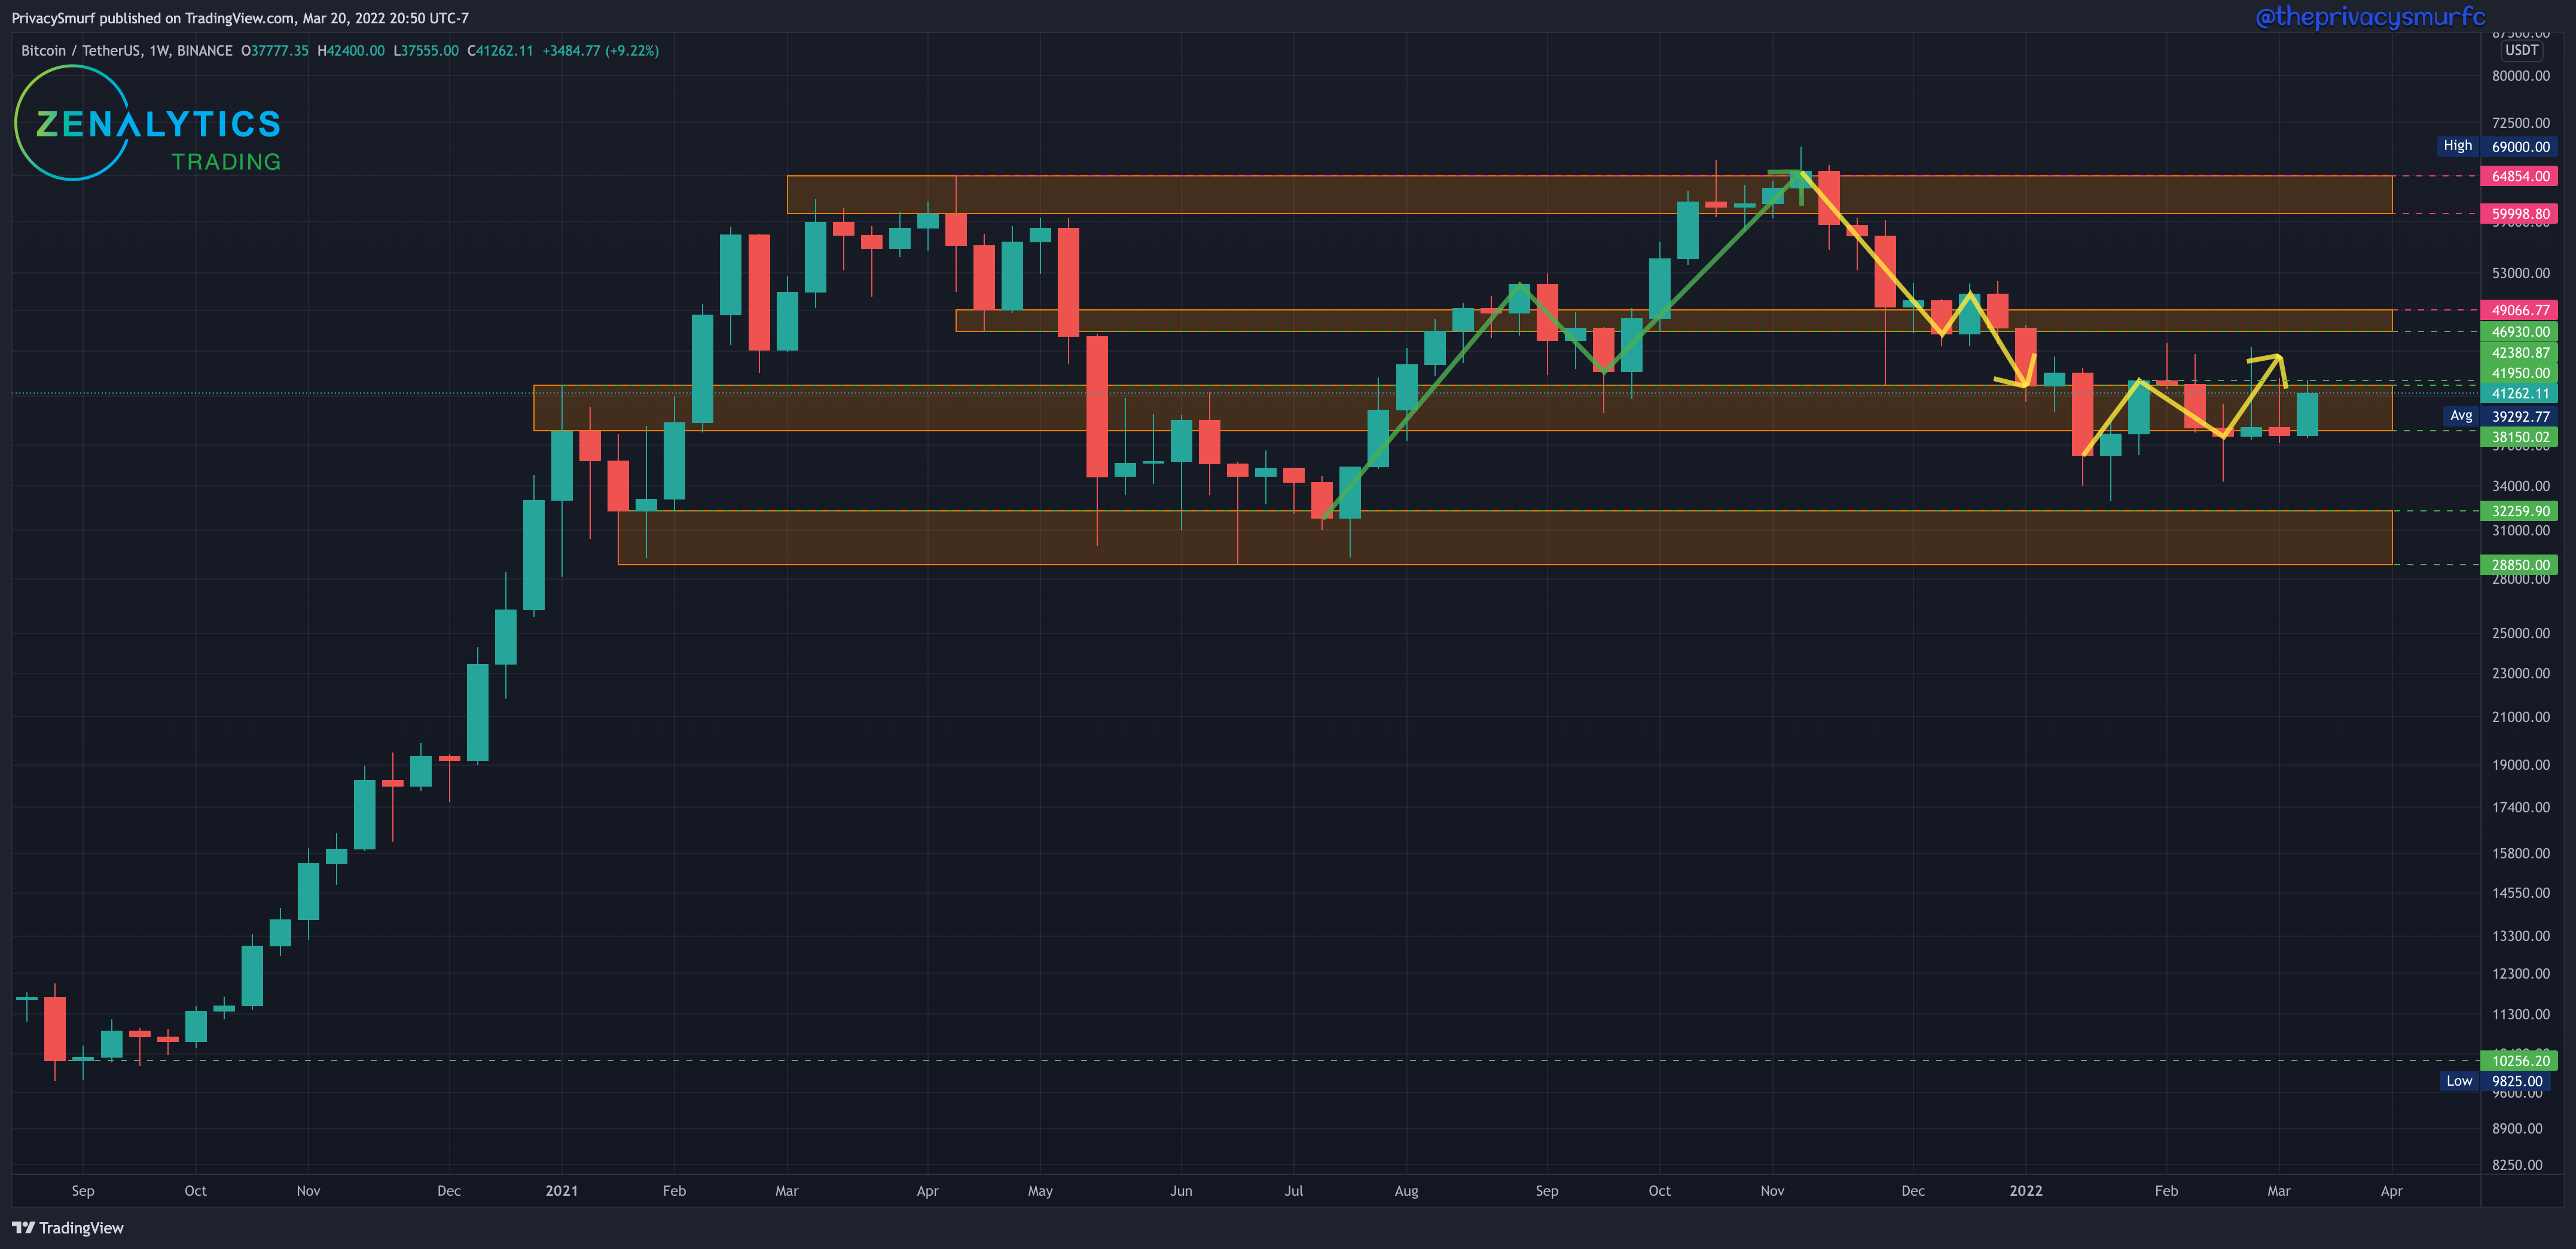
This week closed up but still within the same range as the last few weeks. A close above 42.3k establishes a bullish trend. This week closed as a bullish engulfing candle, meaning the range of the bar engulfed the prior candle’s range from open to close. This is a positive sign by itself but even more so considering the selling pressure that existed the past two weeks. I’d be expecting bullish price action to follow. For a low-risk long-term entry, I’d be waiting for that higher weekly close over $42380 to confirm a bullish trend. The daily chart may reveal if that will occur or not.
BTC/USDT Daily Chart
https://www.tradingview.com/chart/jjSdFW4b/
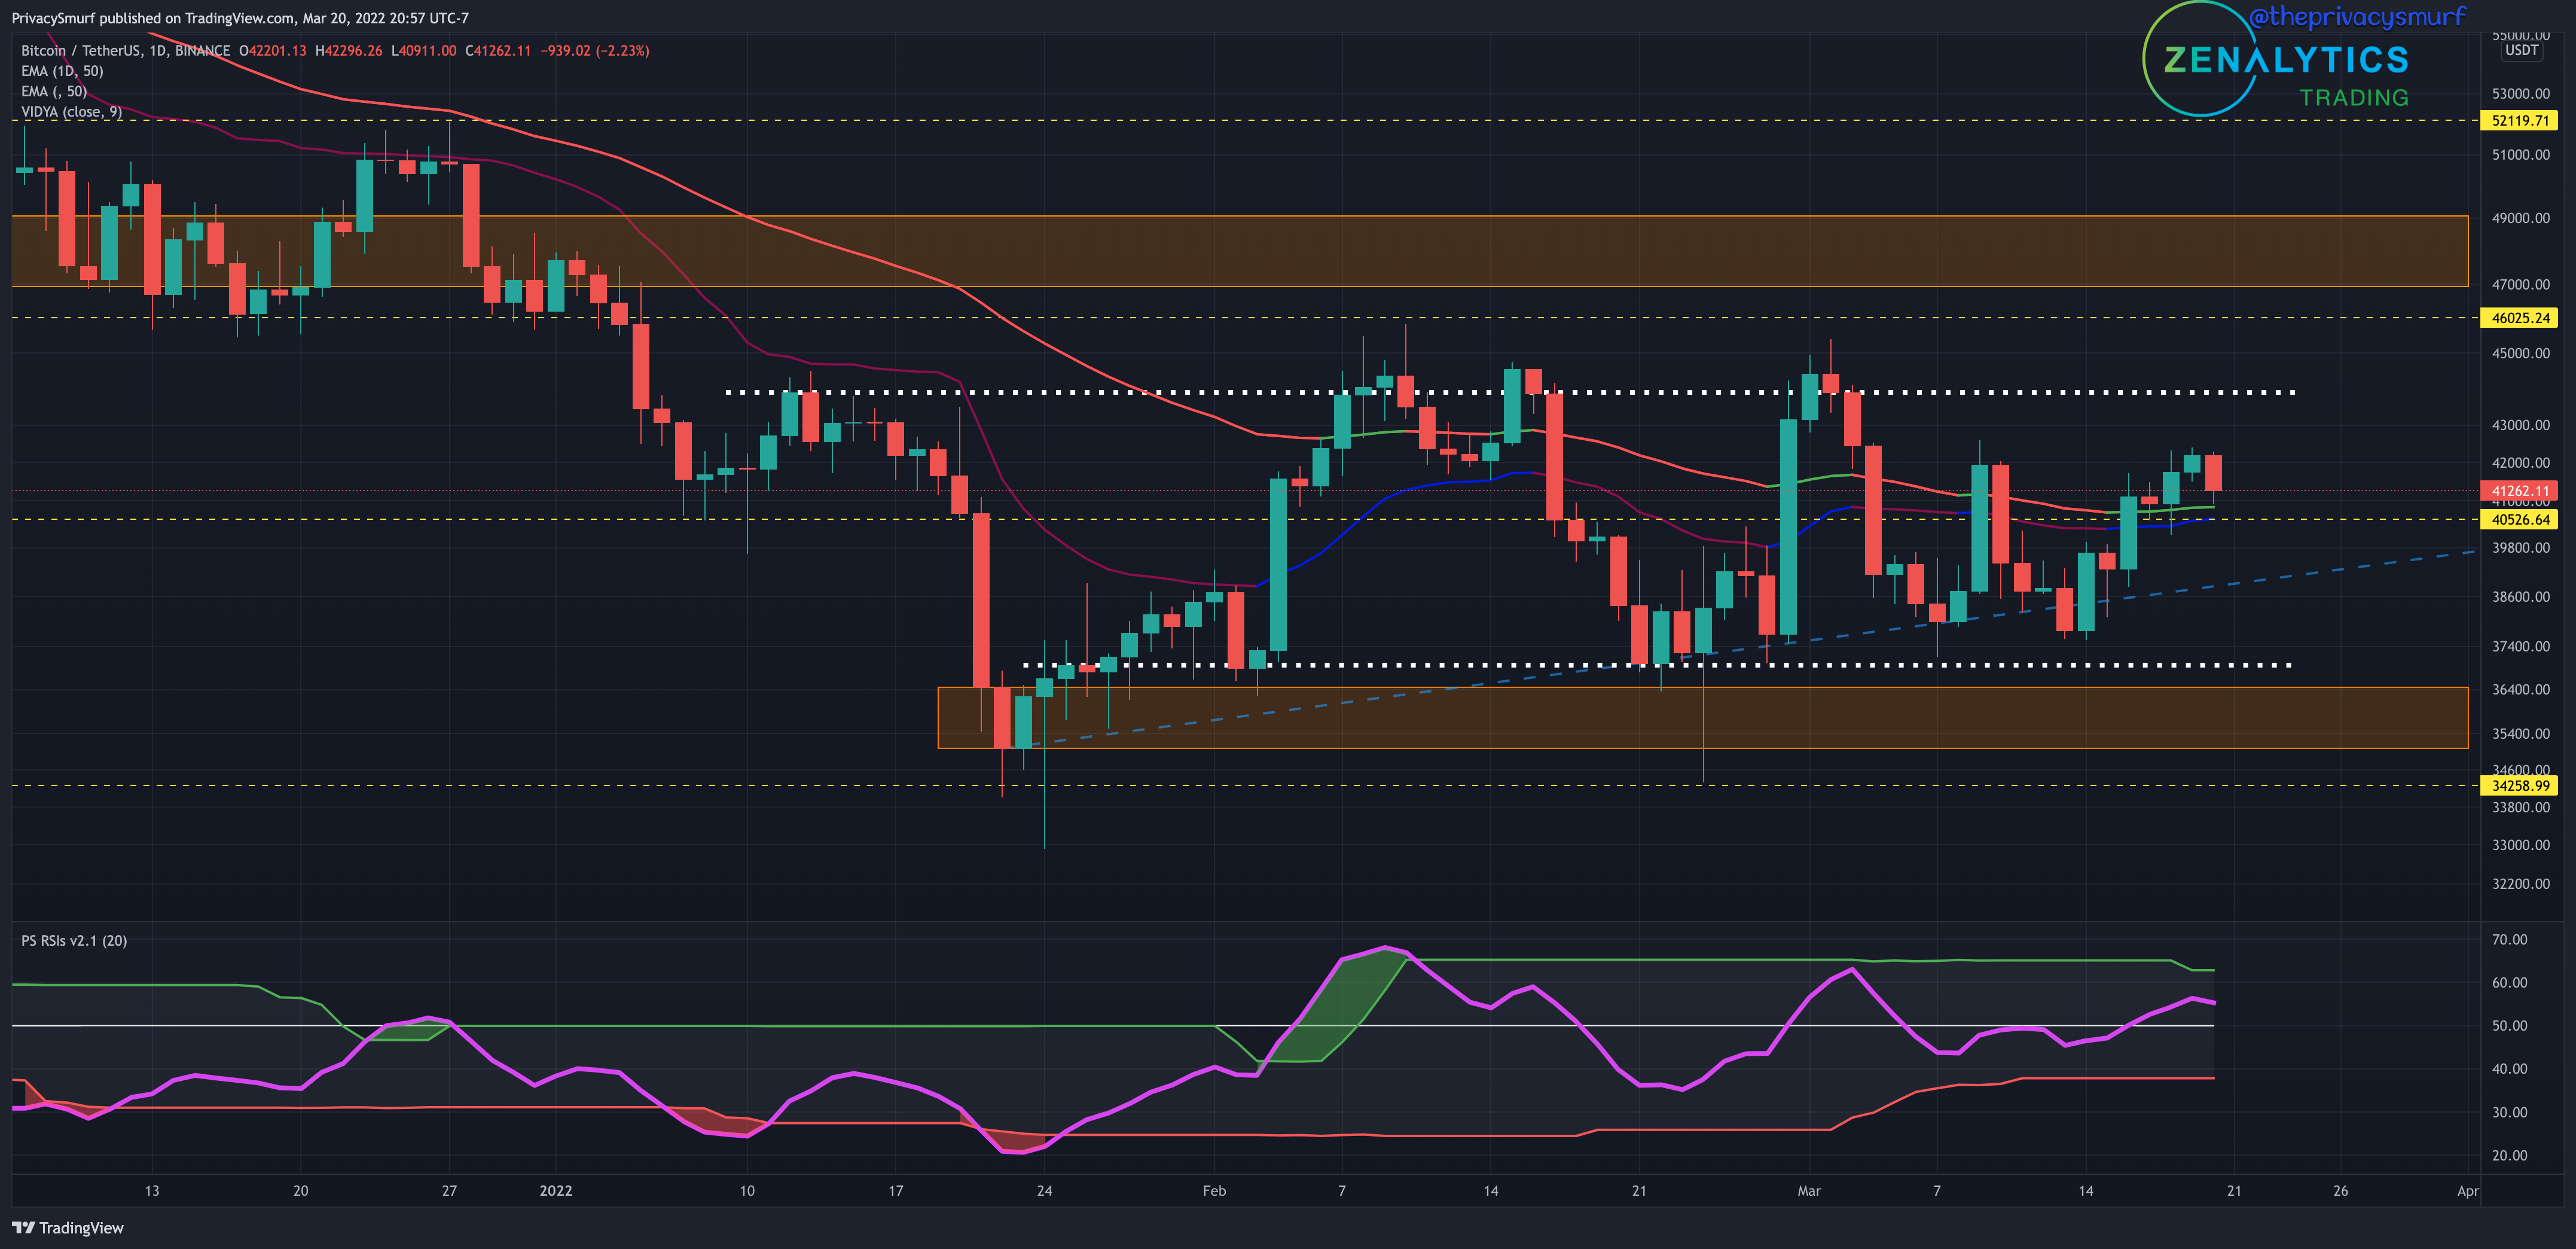
There was plenty to be happy about with BTC this past week. The end of the week we saw candles close above the 50-Day EMA. The RSI also crossed above the midline. A test of both the midline of the RSI and the 50-Day EMA may be on the horizon as the RSI is trending back down. On a bearish break of the EMA ideally support being found around $39.7k or lower at the angular trendline or would be the textbook spot for a higher low close preserving the bullish structure. However, prices can still dip down just under 38k and still be bullish. Pending new buy volume, I’m expecting a bit of volatility with a slight bearish bias early in the week. This is due to the down-trending RSI and bottom band steadily creeping up towards the midline. I’ll be watching the midline of the RSI early in the week to see how price responds as it is being tested.
Keep in mind this price action over the last few weeks is still just bullish trend building blocks. The price is still ultimately consolidating in a bearish trend. We have to break above this range to be technically bullish.
ETH/BTC Weekly Structure
https://www.tradingview.com/chart/sacHlXOv/
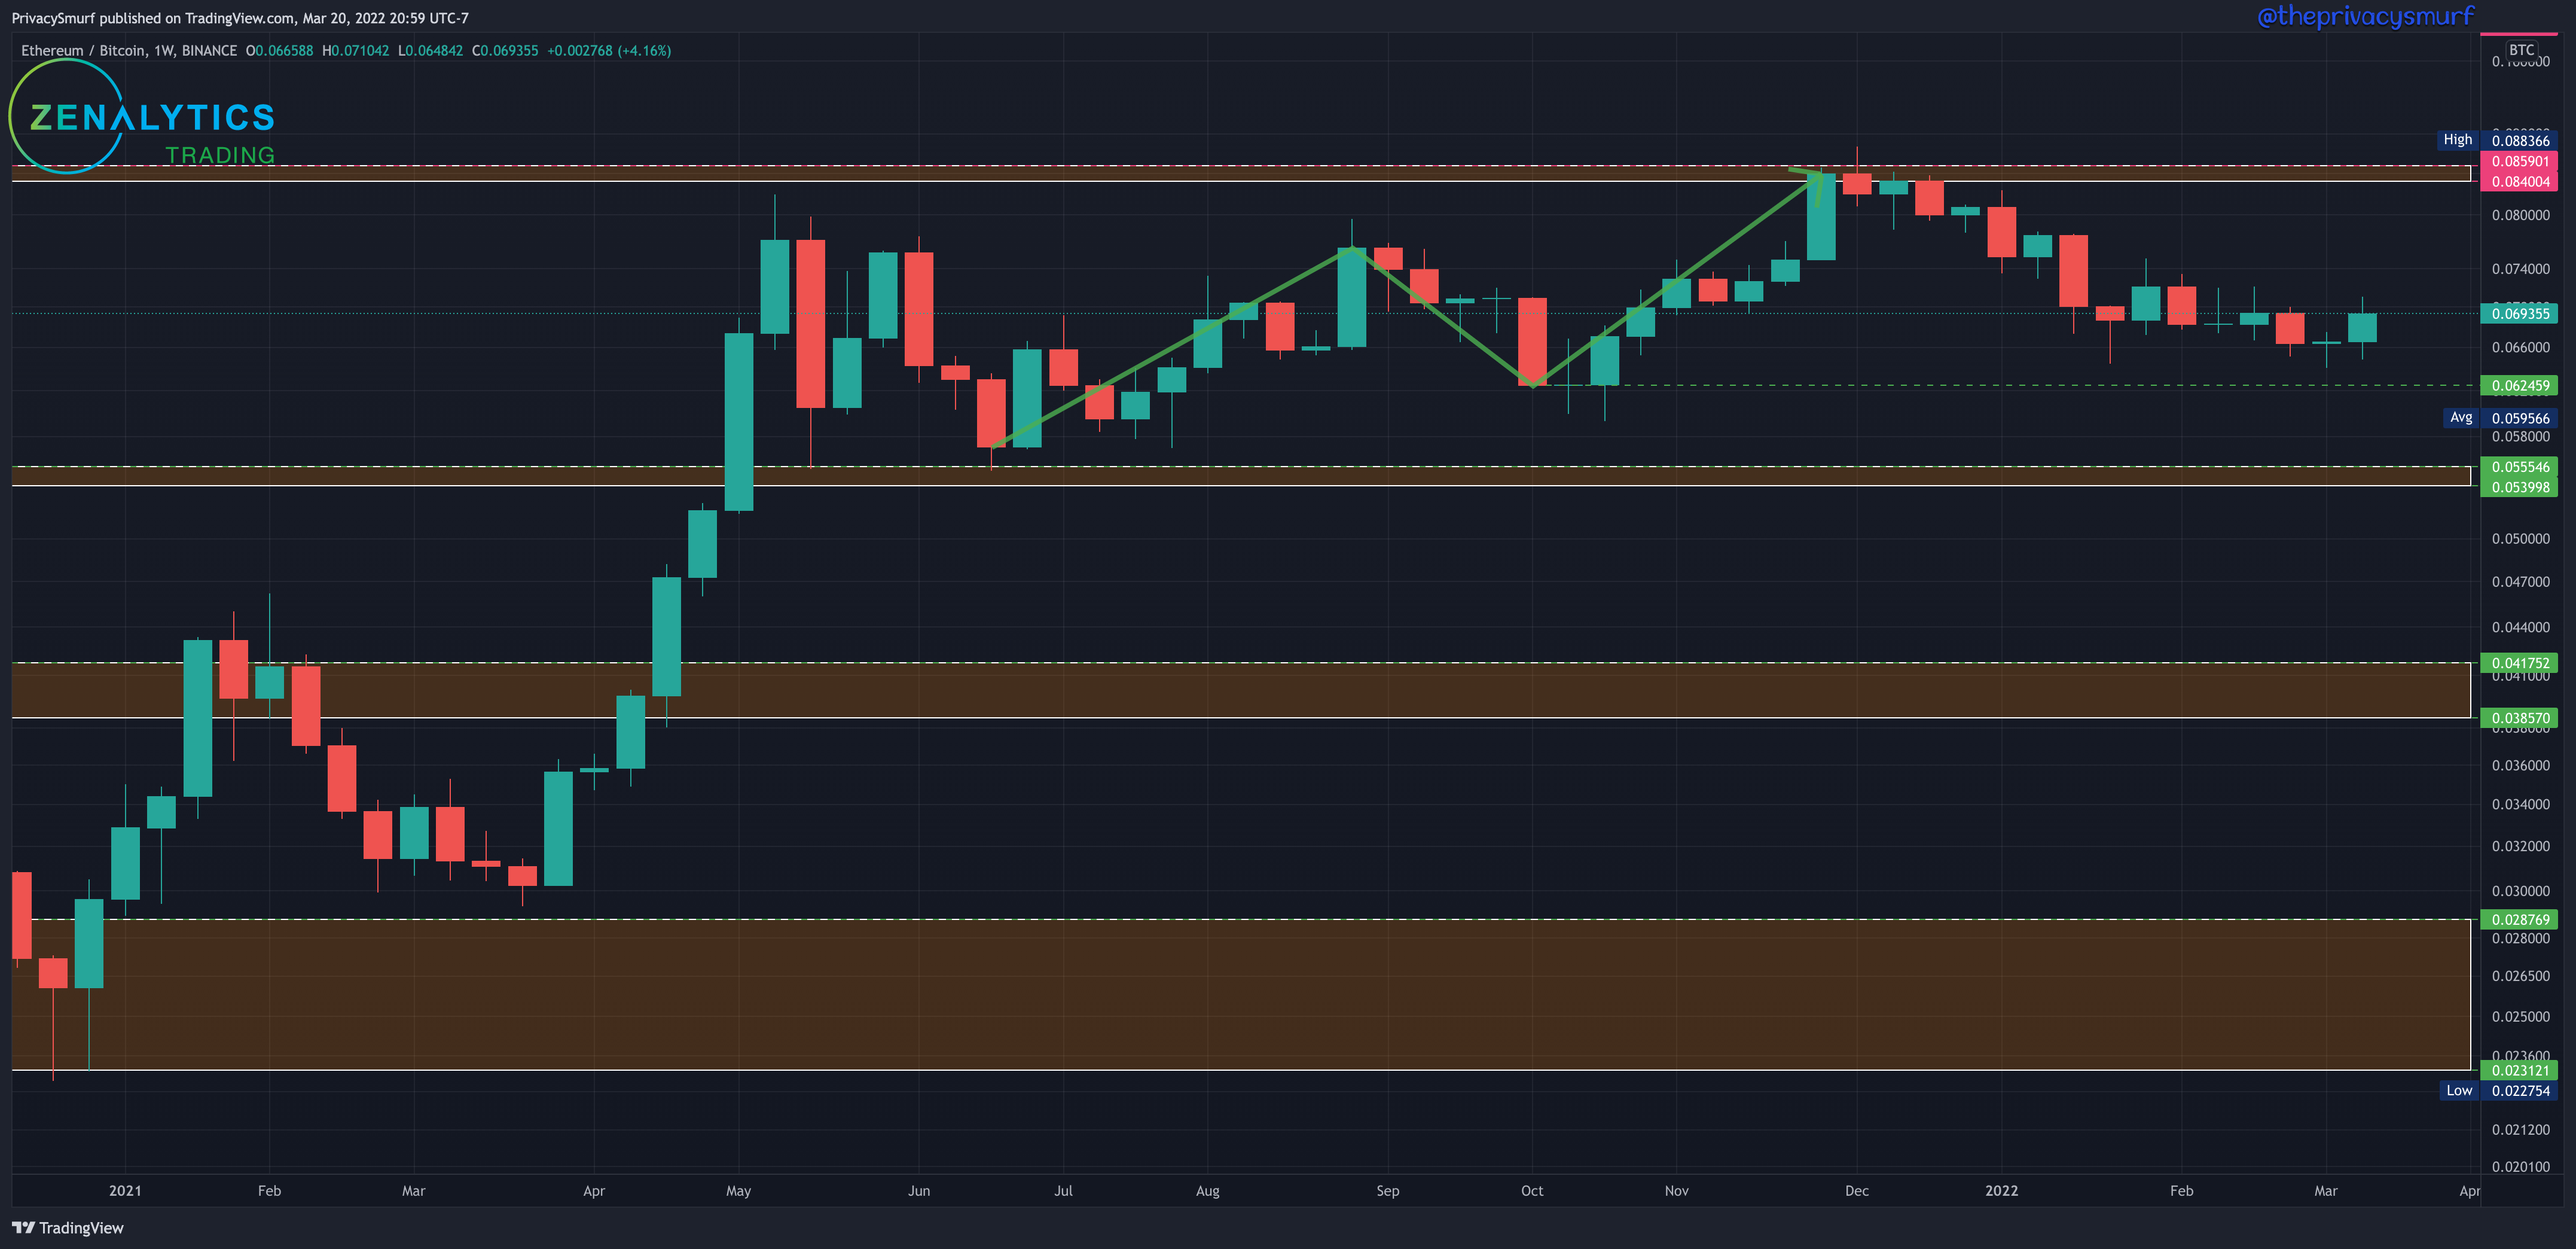
A bullish break from ETH relative to BTC. It still managed to close within the same range from the last 2 weeks so the green was not setting any new higher highs. A long-term rotation right now wouldn’t be my approach and would be safer to take on a break with a higher close than 0.072. A rotation of buying ETH with BTC also still has a value at the 0.062 market structure support if this chart resumes the downwards trend. Being stuck in the same range for the last 5 weeks there are really no indications to make any assessments until outside that range. The daily chart may give some clarity to potential directionality.
ETH/BTC Daily Chart
https://www.tradingview.com/chart/gTkSjkj6/
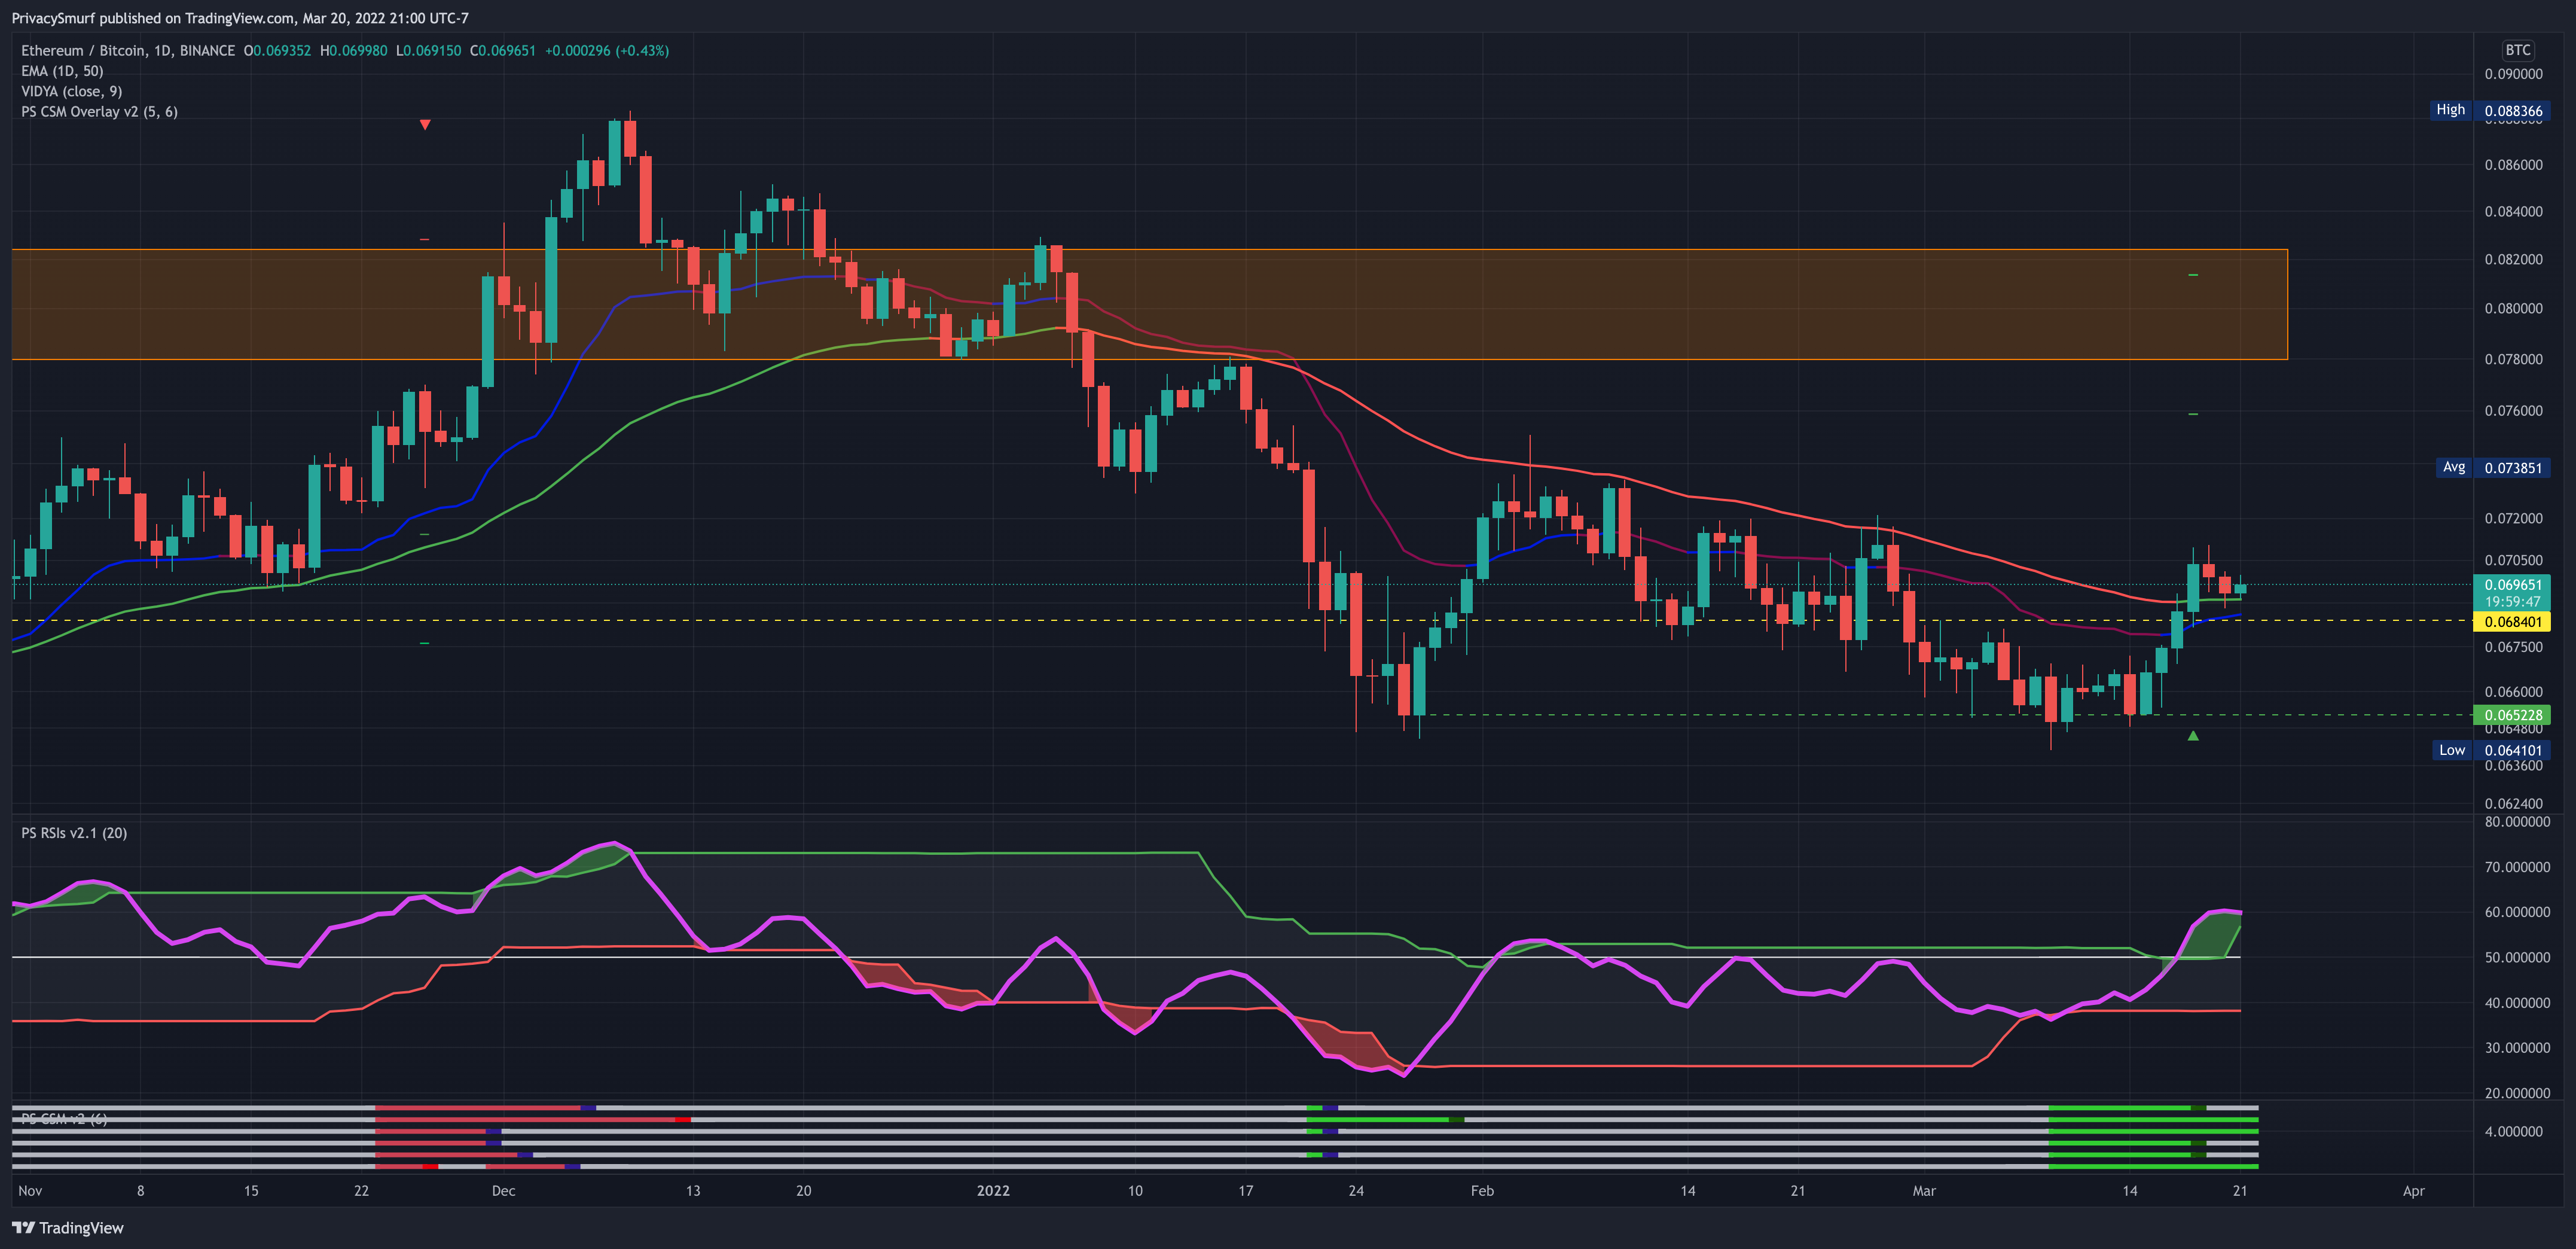
It’s always a pleasure to have the unexpected pumps come in to make bearish charts look better. This week the daily chart closed out with some closes above the 50-Day EMA, the RSI broke above the midline and top band, and bullish divergence trade signals plotted from the Smurf Correction Strength Meter on the bottom of the chart. The horizontal light green bars mean that multiple oscillators are in bullish divergence and conditions signaling a reversal plot with the dark green dots. The profit targets are the small horizontal green lines plotted on the price chart up to around 0.076 and 0.0815. Being this signal came above support at 0.068 I’d be comfortable with a short-term rotation into ETH from BTC. These signals indicate that ETH is potentially going to be in a position to gain in value relative to BTC. If this occurs it would be relatively safe to assume that other altcoins will also be gaining during this time as well and I’d start looking at ALT/BTC charts (meaning chart symbols like AVAX/BTC, RUNE/BTC, SNX/BTC, OGN/BTC). Charts that are showing bullish signals relative to BTC will be better to buy for short-term plays to sell back into BTC. This will ensure that whatever trade you take will be beating the “market”.
If you want a primer on trading pairs give this post a read.

ETH/USDT Weekly Structure
https://www.tradingview.com/chart/JPTp0aXw/
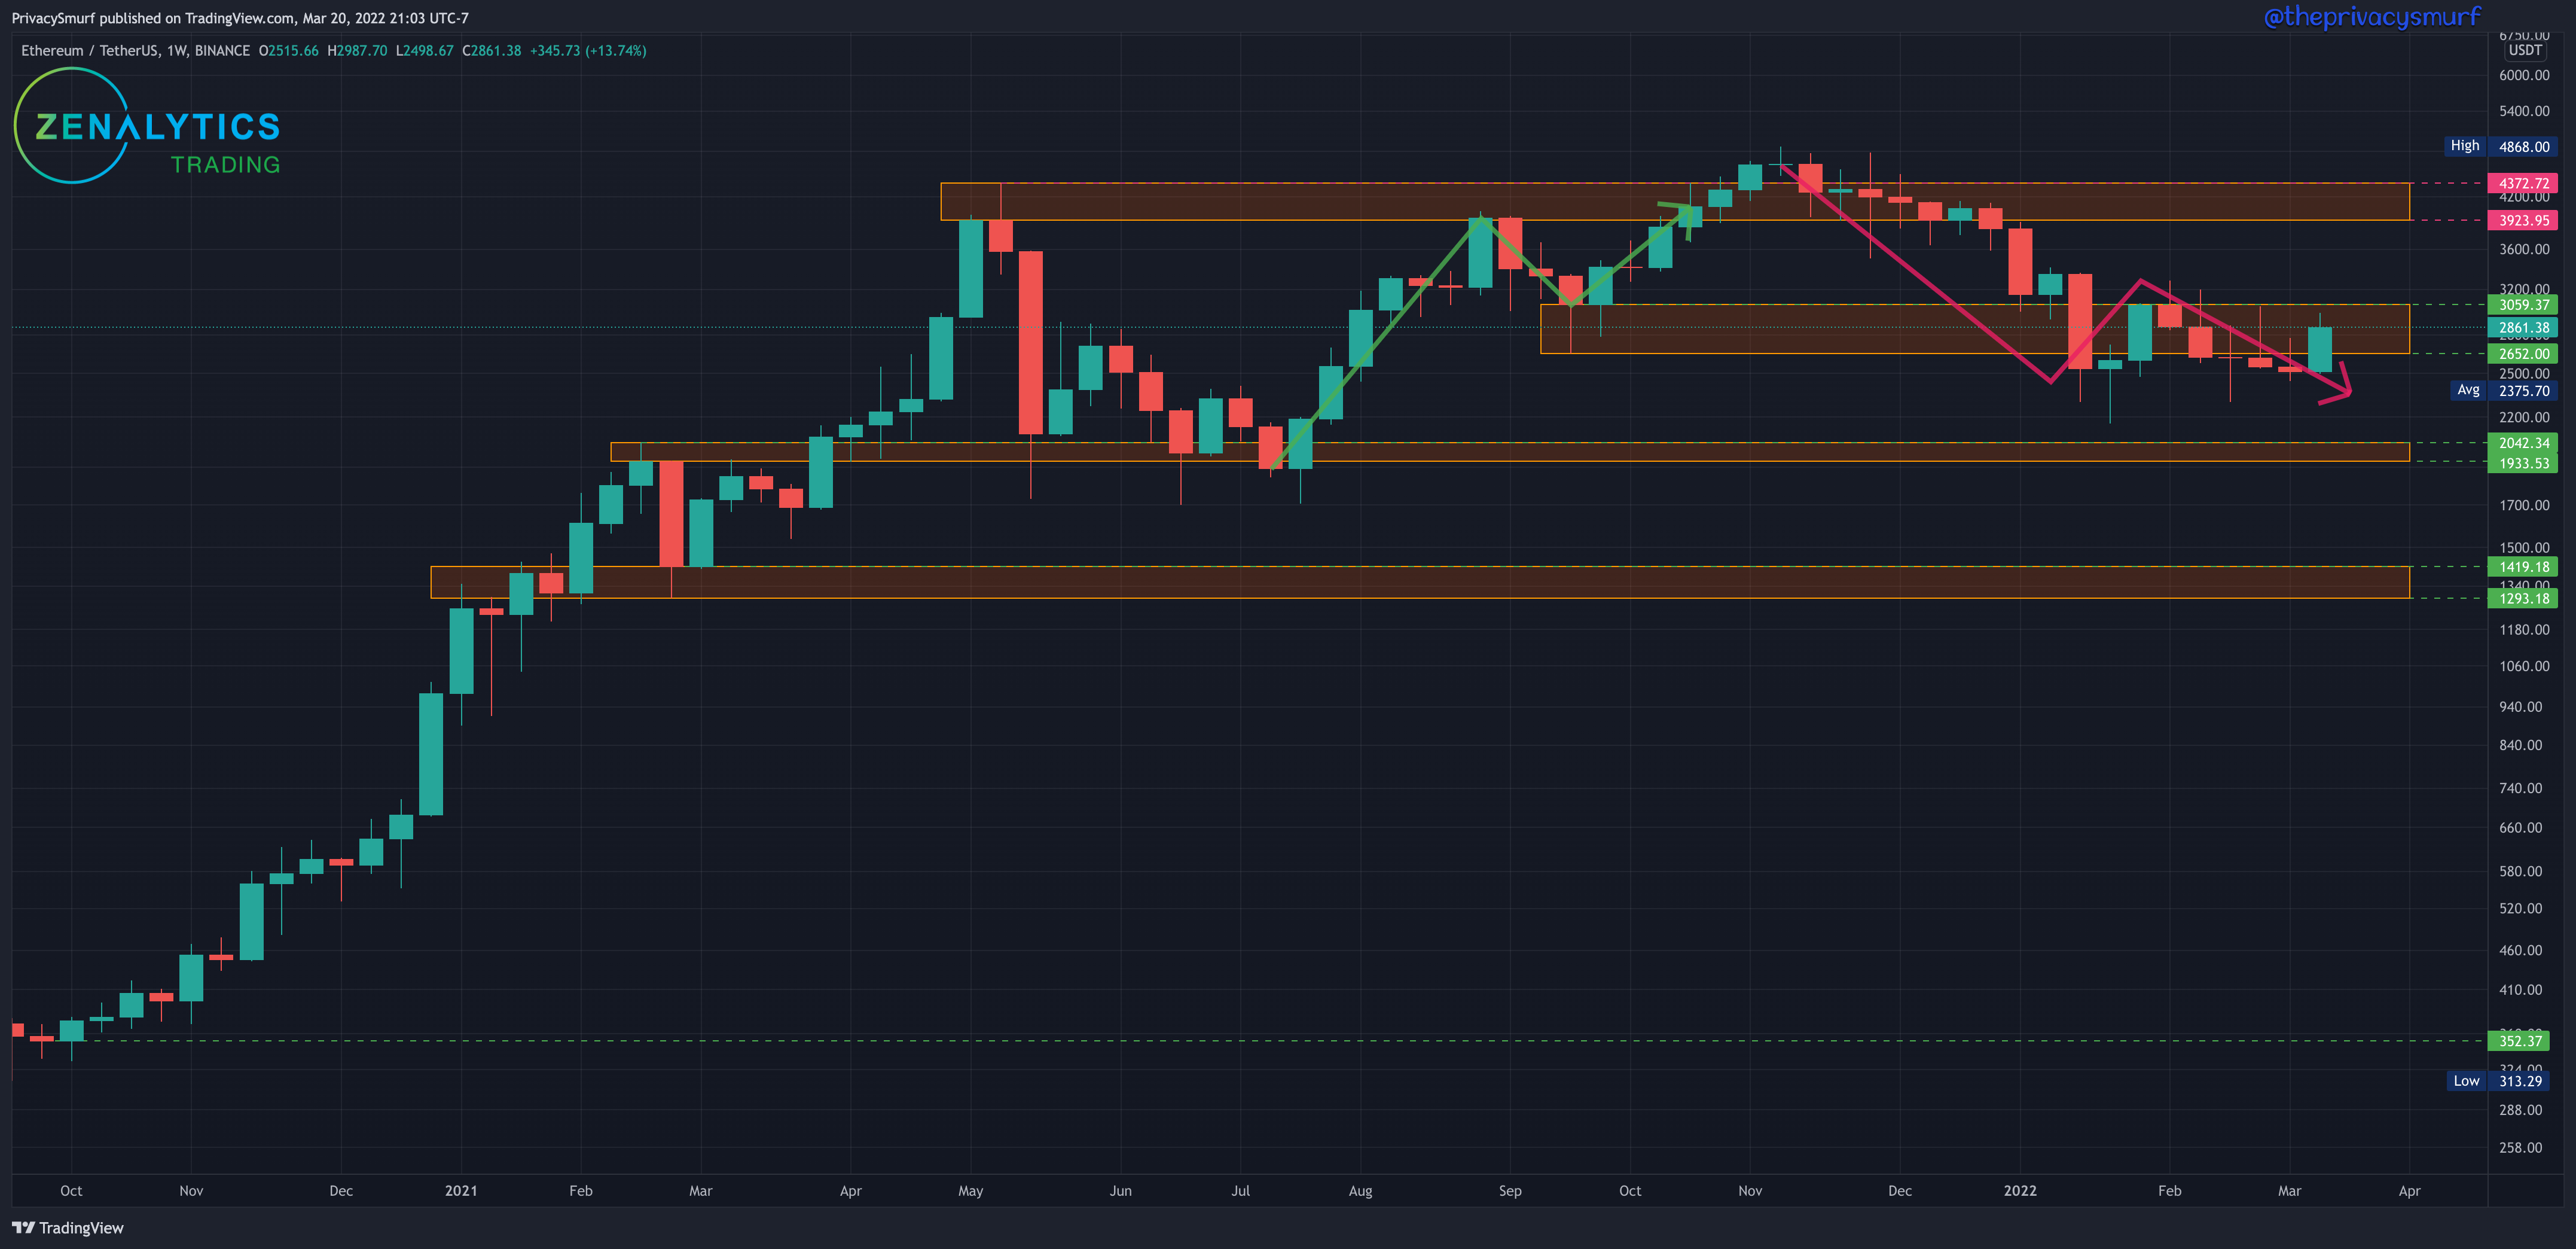
ETH closed up this past week in a bullish engulfing candle as well but also stayed stuck in the same range. There needs to be a close above $3059 to trust any bullishness. It’s very important to not bring bias from any other chart to any other. ETH is still in a bearish trend. A close above $3059 would be a break out of the trend into bullish consolidation and would be a risky long-term entry. With the BTC/USDT chart being bullish but showing the potential of a retracement and the ETH/BTC daily chart plotting mostly bullish potential I’d expect the ETH/USDT daily chart to be reflecting more bullish potential than bearish. If you don’t know why that is then you really need to go up and read that currency pairs post so you can get a better understanding of relative value.
ETH/USDT Daily Chart
https://www.tradingview.com/chart/xbB6lkZu/
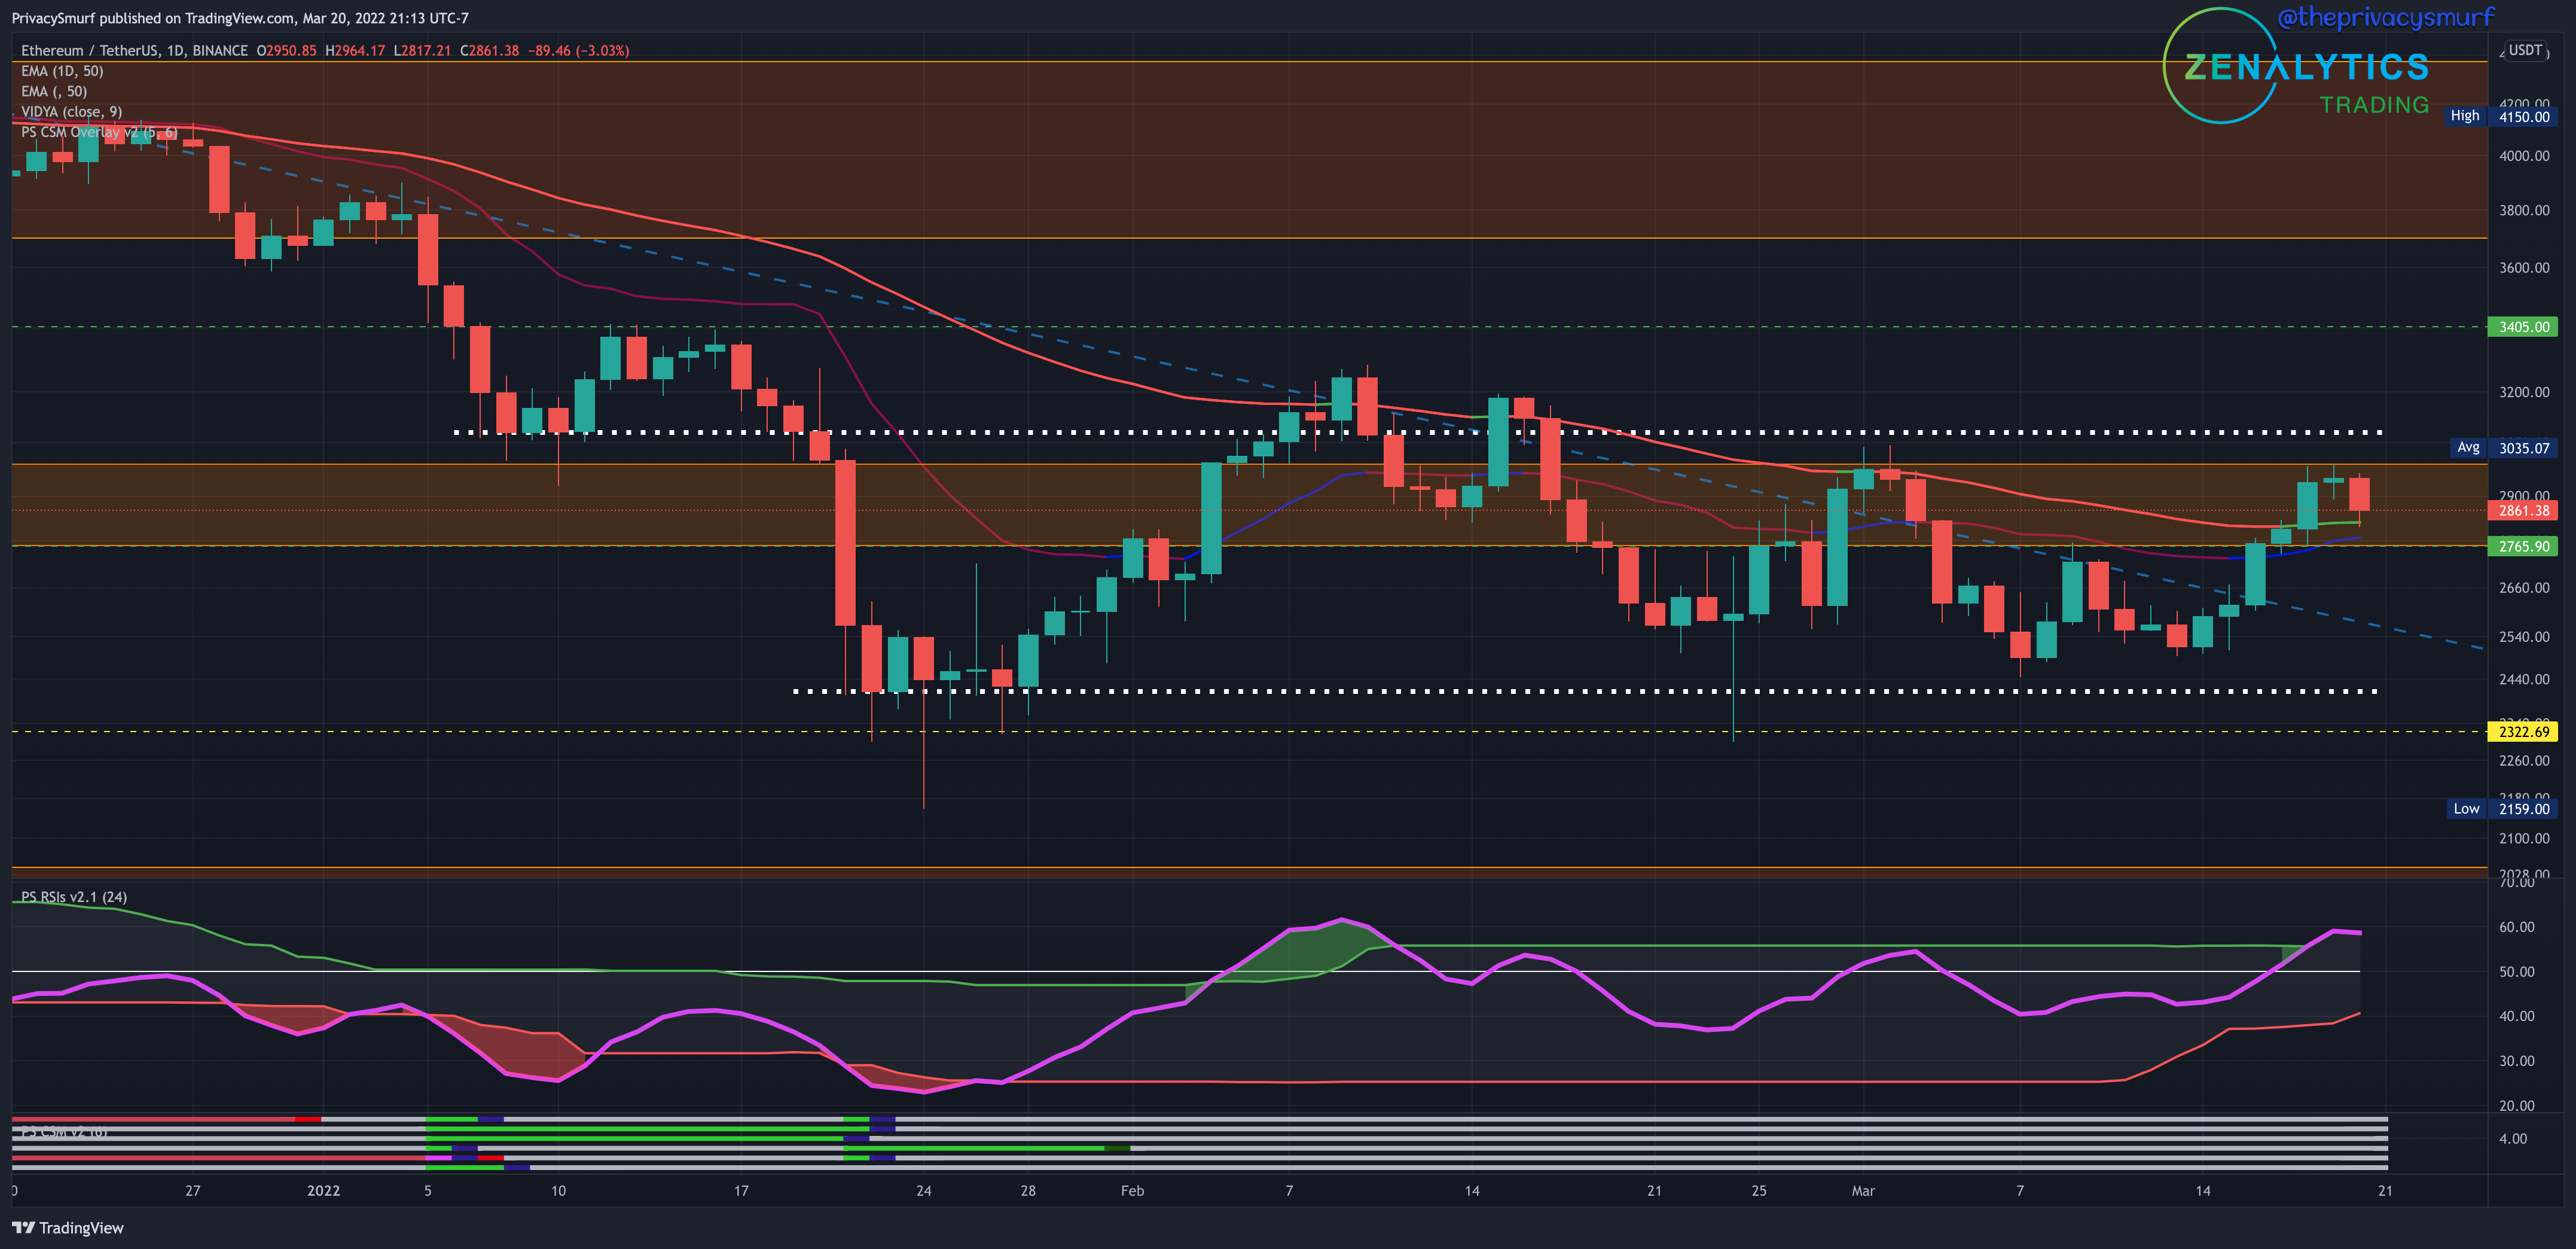
Finally some momentum in the ETH chart. The week closed out with a break of the long-held descending trend line that has been respected since December, the 50-Day EMA, and the RSI broke above the midline and the adaptive top band. A test of one or both of those for support wouldn’t be out of the ordinary. The RSI is still teasing a higher break above the top band and that will likely coincide with prices breaking out of the top of the range at $3085. One thing to keep in mind is the bottom band of the RSI. It has been moving up towards the midline. If the RSI curls back down early in the week in line with price as candles move down to test supports there will be a good possibility of volatility. It’s likely this will become more clear by the time of the midweek update posted on Wednesday. The RSI is currently flattening out so I’d expect the support test early in the week. With no bullish divergence signals, it’d be price action candle signals and the RSI that would lead me to an entry on this chart. There isn't one just quite yet. Opening a position here would mostly be a rotational play to take advantage of faster gains in ETH than BTC. I’d be looking for a support test with a bullish price action candle pattern or I’d be looking for an RSI agreement on buying a break of the range high (which would be higher risk but is supported with the ETH/BTC chart as backup confirmation).
The charts are all getting so so so close to plotting some higher timeframe bullishness. We are getting closer and closer to the end of Q1. The Q2 Forecast is coming up. I don’t really dictate it in the posts but each one has a central theme.
2021 Q3 was “have we bottomed.”

2021 Q4 was “will we hit 100k/are we topping?”
2022 Q1 was “do we sit on our hands til maybe Q2?”
Here’s a look at that Q1 post. I’ve unlocked it for all the folks to read so you get an idea of whats included.
It would look like 2022 Q2 is shaping up to be “will summer be a relief rally or the new bullish long-term trend and new ATH?”
I’ve got a lot of interesting pieces to present that I hope you will enjoy and can make use of. As you can see above every forecast so far I’ve published has accurately forecasted the past major market turns we’ve experienced. The methods are objective and data-driven and well worth the subscription cost. Join up to the paid side so you can have your CAKE and eat it too.
See you soon!
@theprivacysmurf
Looking forward to learning and growing with you over here Terry Oliver!
ETHBTC close the daily at 0.070491. That would be set of a ST-rotation from ETH into BTC, right? Also what’s your definition of Short term vs long term? Daily vs weekly?