

Sunday Synopsis #36: Let's get it started
Sunday Synopsis #36: Let's get it started

BTC/USDT Weekly Structure
https://www.tradingview.com/chart/4v8qizyI/
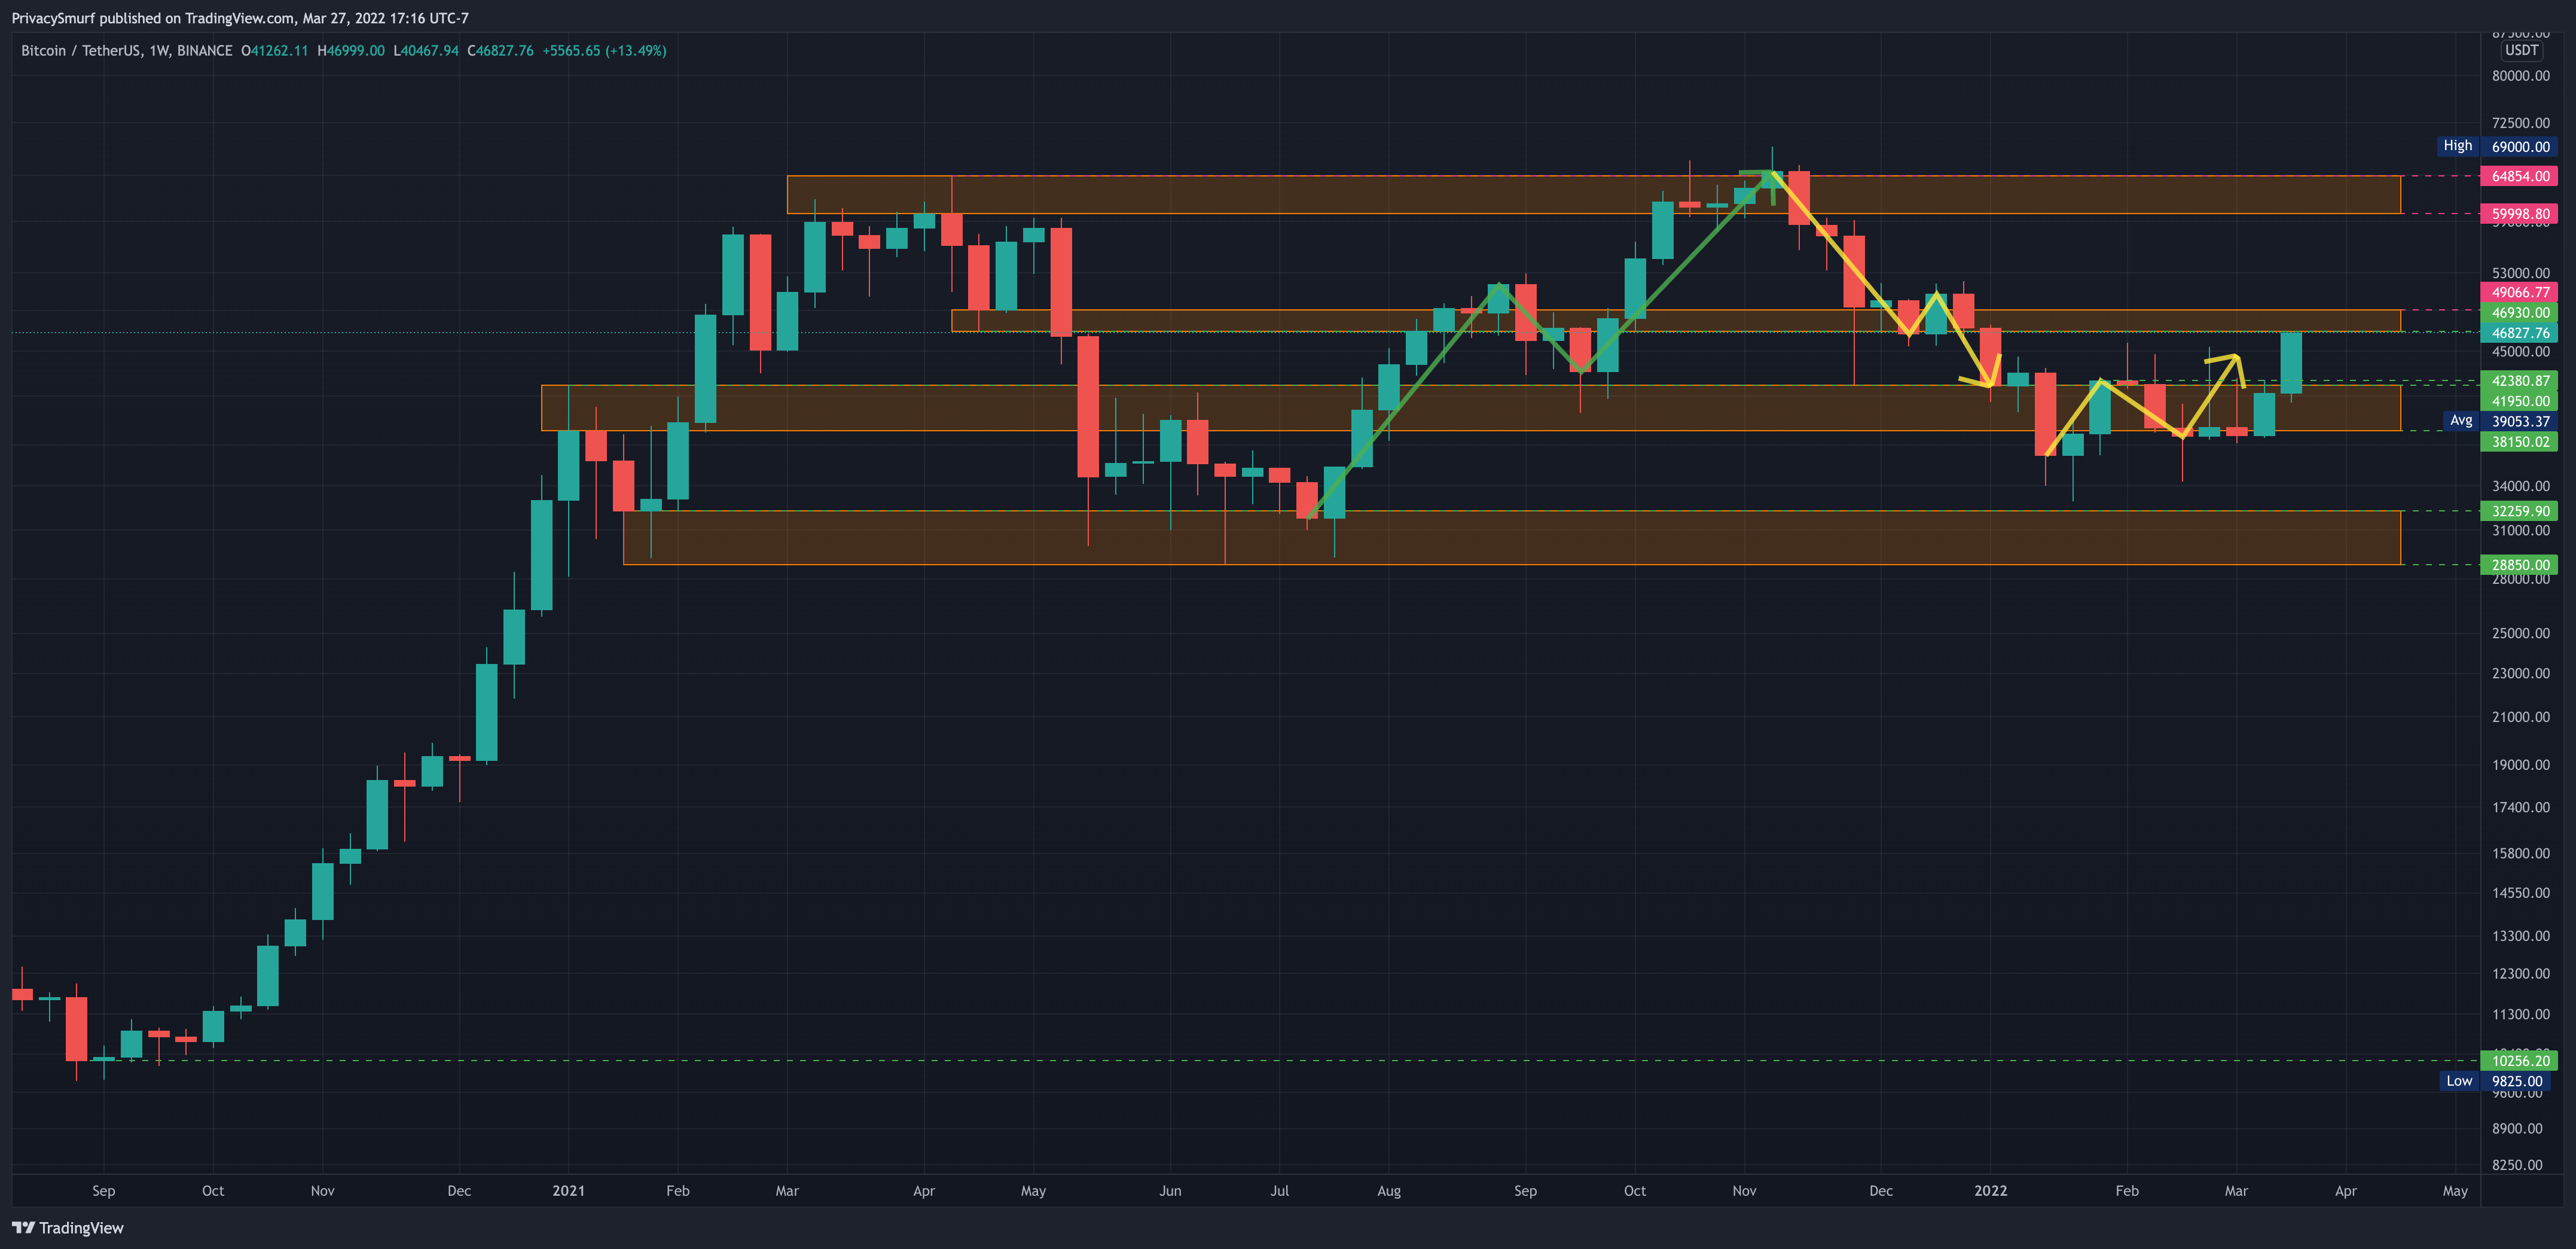
This week closed with the highest weekly of the year. Pretty great start to the new bull trend. While this is a good start we are still butting up to some resistance around 46.8k. This level being broken will be the definitive sign of a new bullish trend. The highest close until the highest weekly close is around $50.8k. From a long-term investor perspective, conservative entries would be relatively low risk. Given this picture, I’d be expecting a bullish continuation with the potential for some resistance but the daily chart will help determine the next few days’ price action.
BTC/USDT Daily Chart
https://www.tradingview.com/chart/jjSdFW4b/
A brief refresh for the Wednesday update:
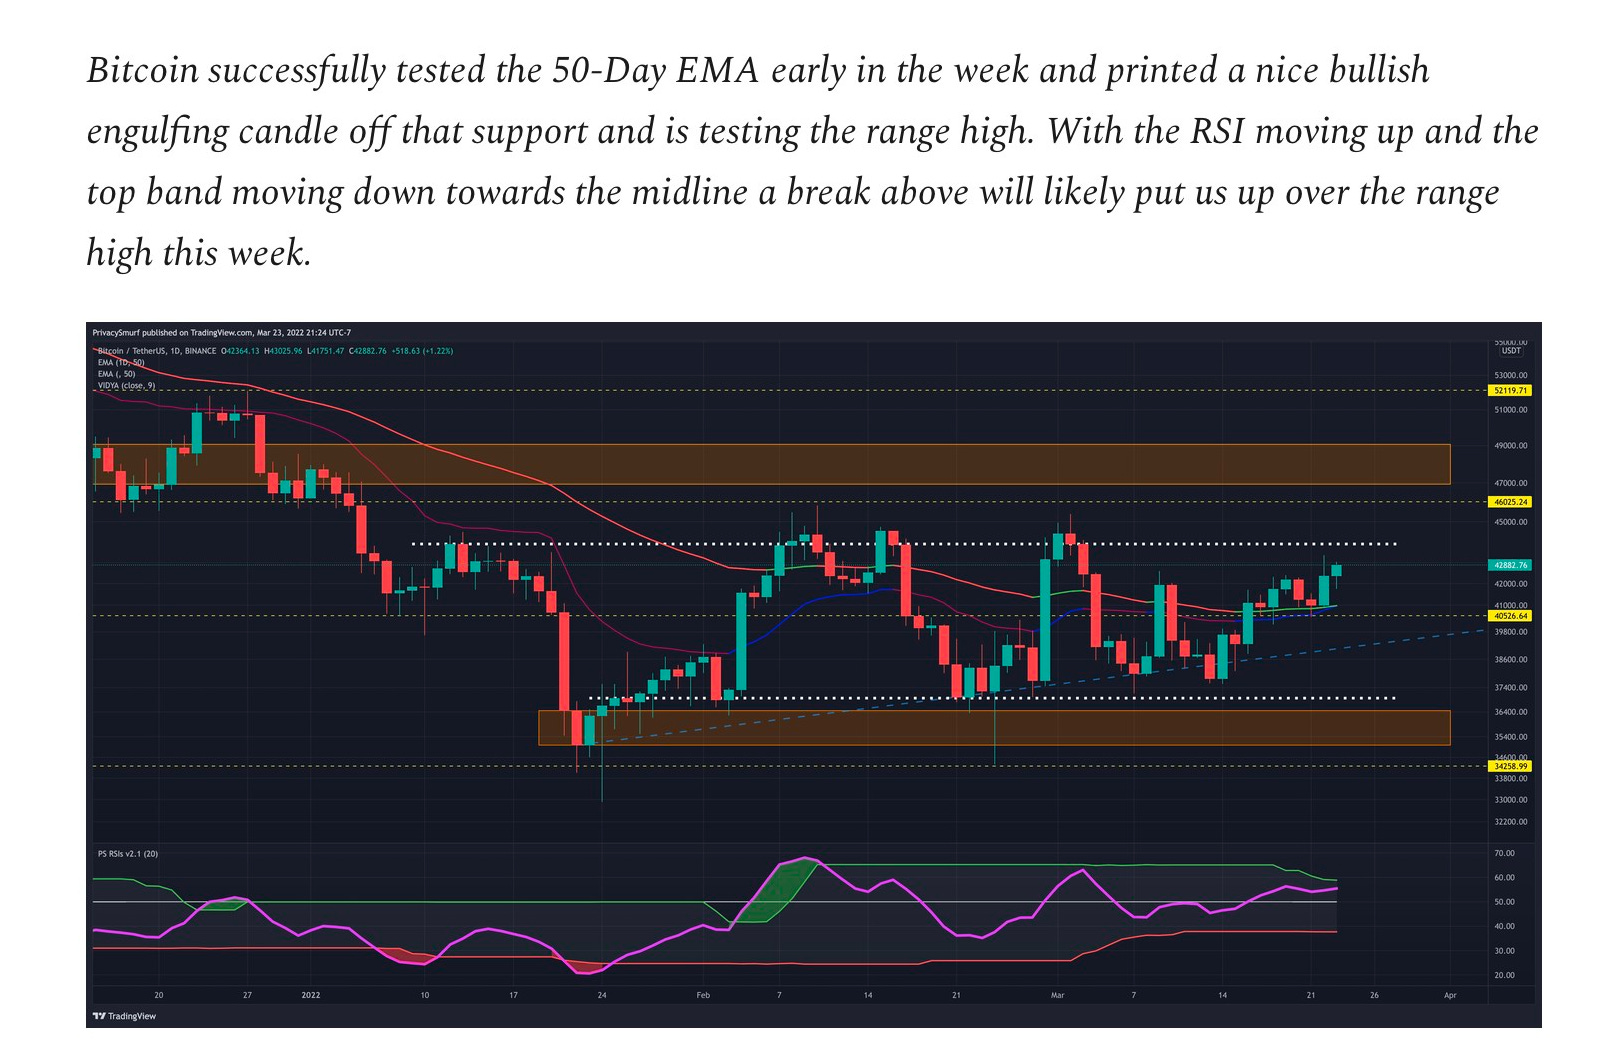
Looking ahead from there we can see the RSI broke above the top band and the price follows breaking above the top of the range we’ve been stuck in for weeks.

The Correction Strength Meter at the bottom of the chart (pointed out by the yellow arrow) there is an indication that 2 oscillators are in bearish divergence. This would suggest the potential for a bearish price correction. However I’ve drawn out with a green arrow just above the RSI. If the RSI plots a new higher high this will invalidate the bearish divergences which would imply bullish price continuation. Monitoring the RSI early in the week could be an early warning sign to the likelihood of breaking the structural high ceiling at $47-$49k. IF the RSI starts to turn back down while prices continue up the chances of sustaining bullish pressure past that ceiling decreases. That’s not a bad thing though as it would likely just end up being a support test with prices retracing back to the levels we have recently penetrated at $44k. On the lower side I’d not expect prices below the 50-Day EMA as it also has a horizontal support level to back it up at around $41k. As long as no daily closes come in under $41k this new bullish market structure will be preserved. At the moment given this picture I have no reason to expect anything but more bullishness but it’s naive IMO to not be prepared for some sort of a retracement from the resistance above. Again, monitoring price action oscillators such as the RSI, momentum, MFI, MACD (whatever your flavor) for bearish divergence as we approach the zone above will be critical to identifying a break or failure. The Wednesday update (which I promise I’ll make better than last weeks) will likely have some more insight.
ETH/BTC Weekly Structure
https://www.tradingview.com/chart/sacHlXOv/
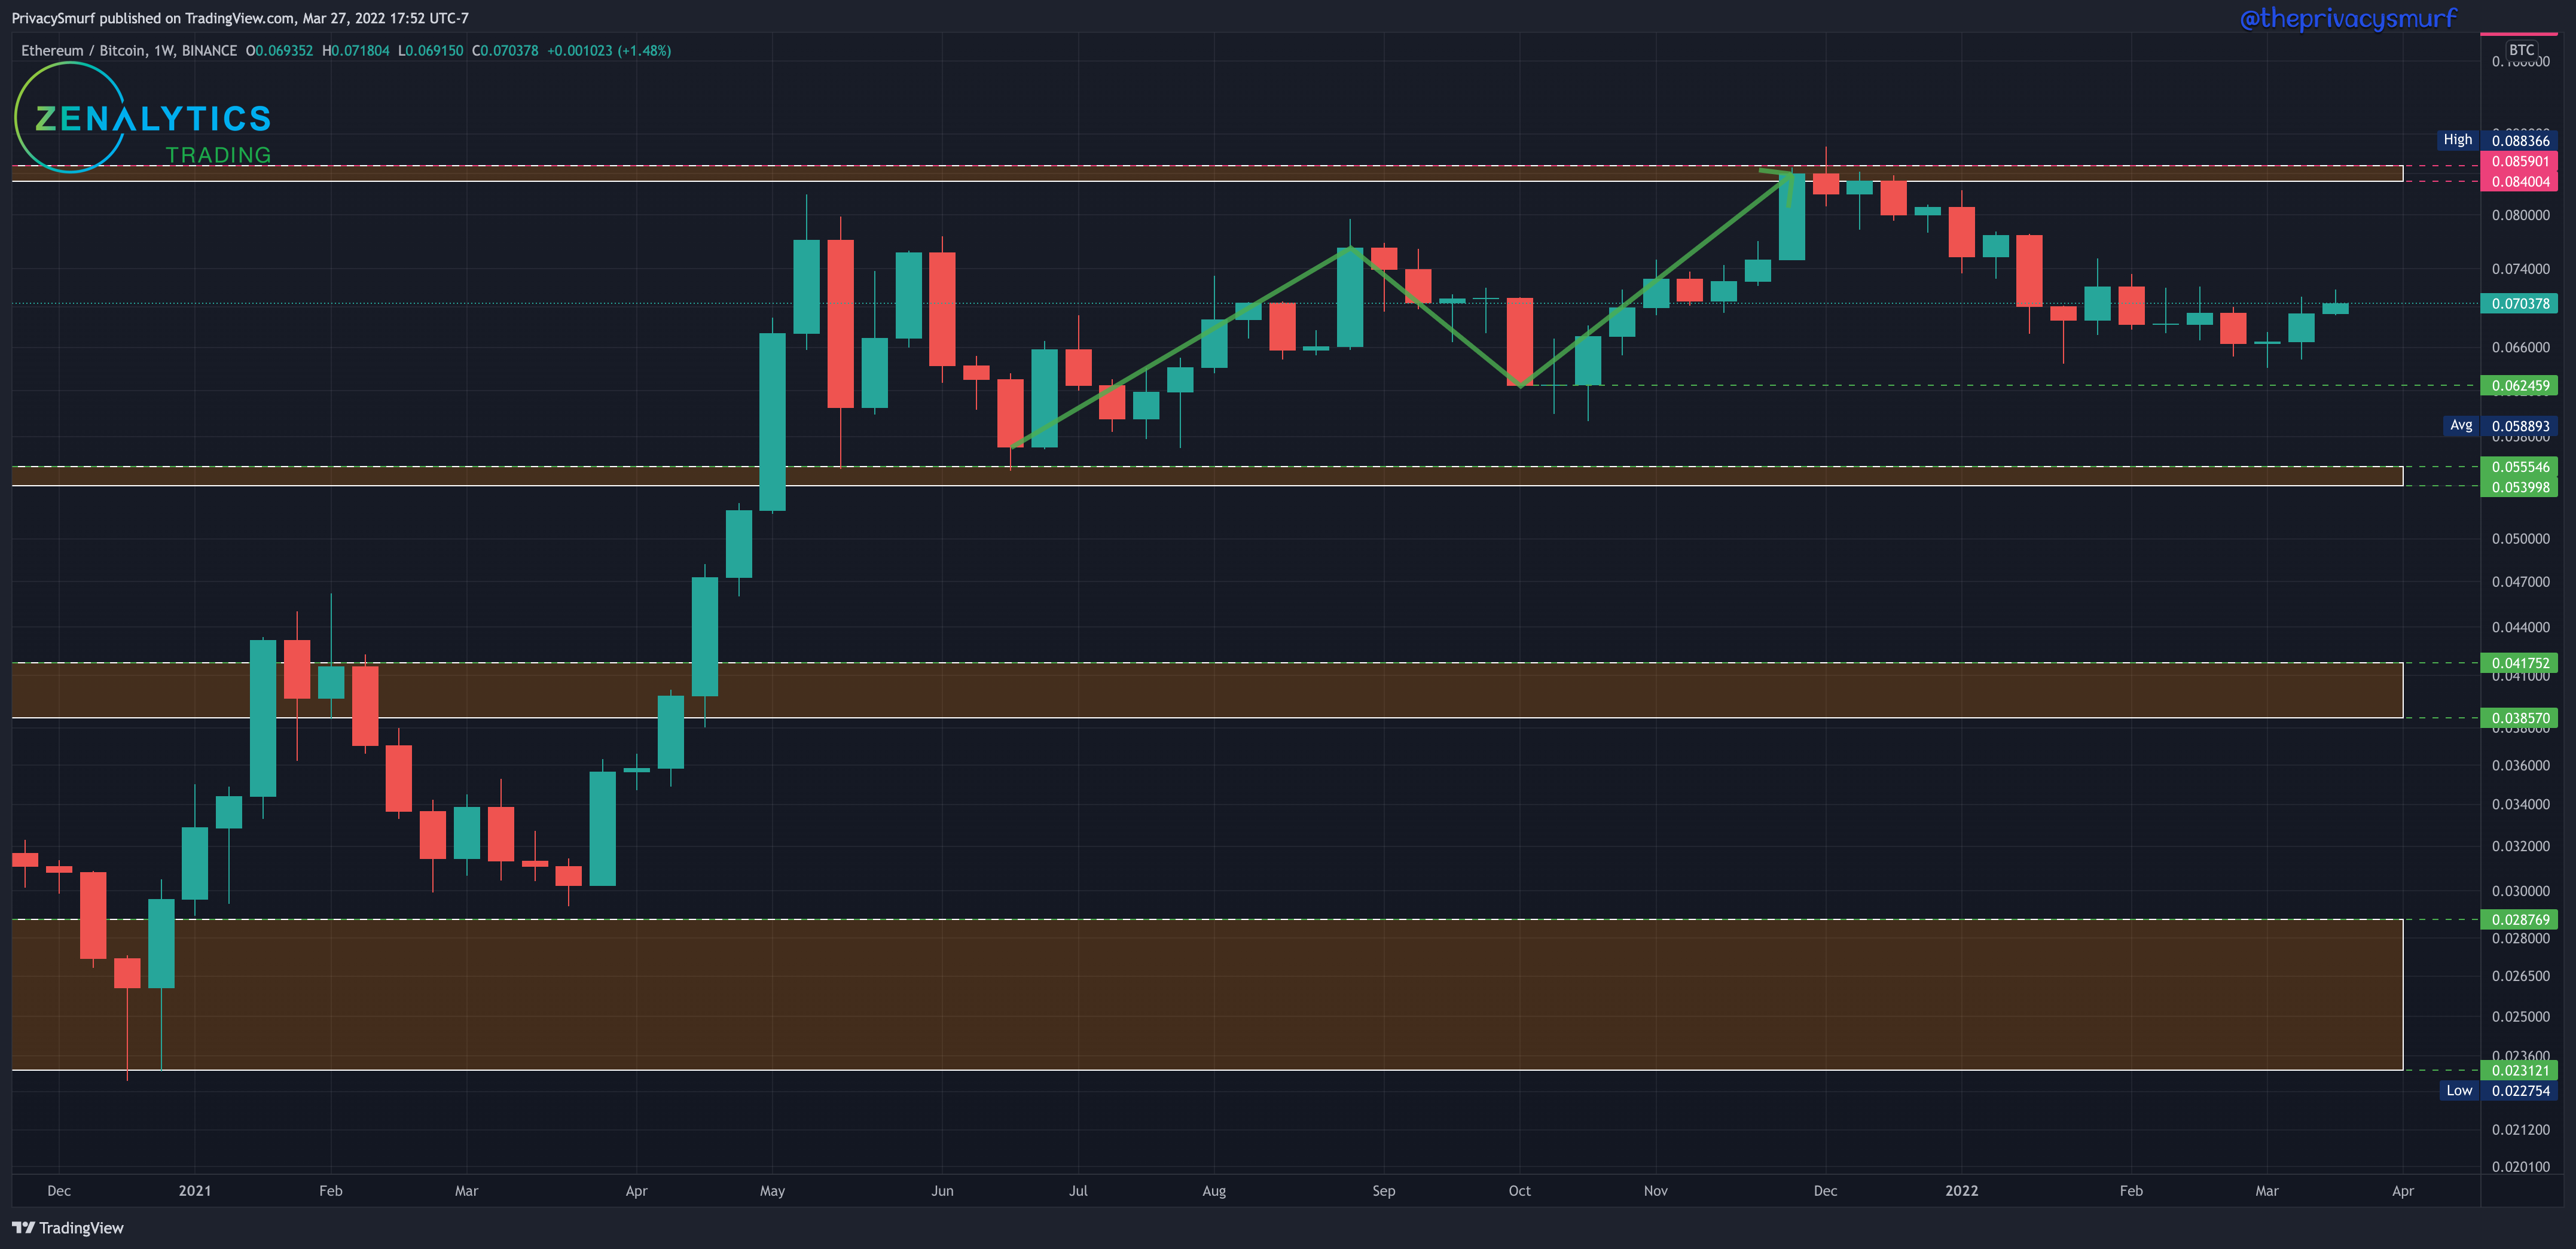
Not too much different in the weekly picture with ETH relative to BTC. I’m going to repeat here this week.
A bullish break from ETH relative to BTC.
It still managed to close within the same range from the last 2 weeks so the green was not setting any new higher highs.A long-term rotation right now wouldn’t be my approach and would be safer to take on a break with a higher close than 0.072. A rotation of buying ETH with BTC also still has a value at the 0.062 market structure support if this chart resumes the downwards trend. Being stuck in the same range for the last 5 weeks there are really no indications to make any assessments until outside that range.
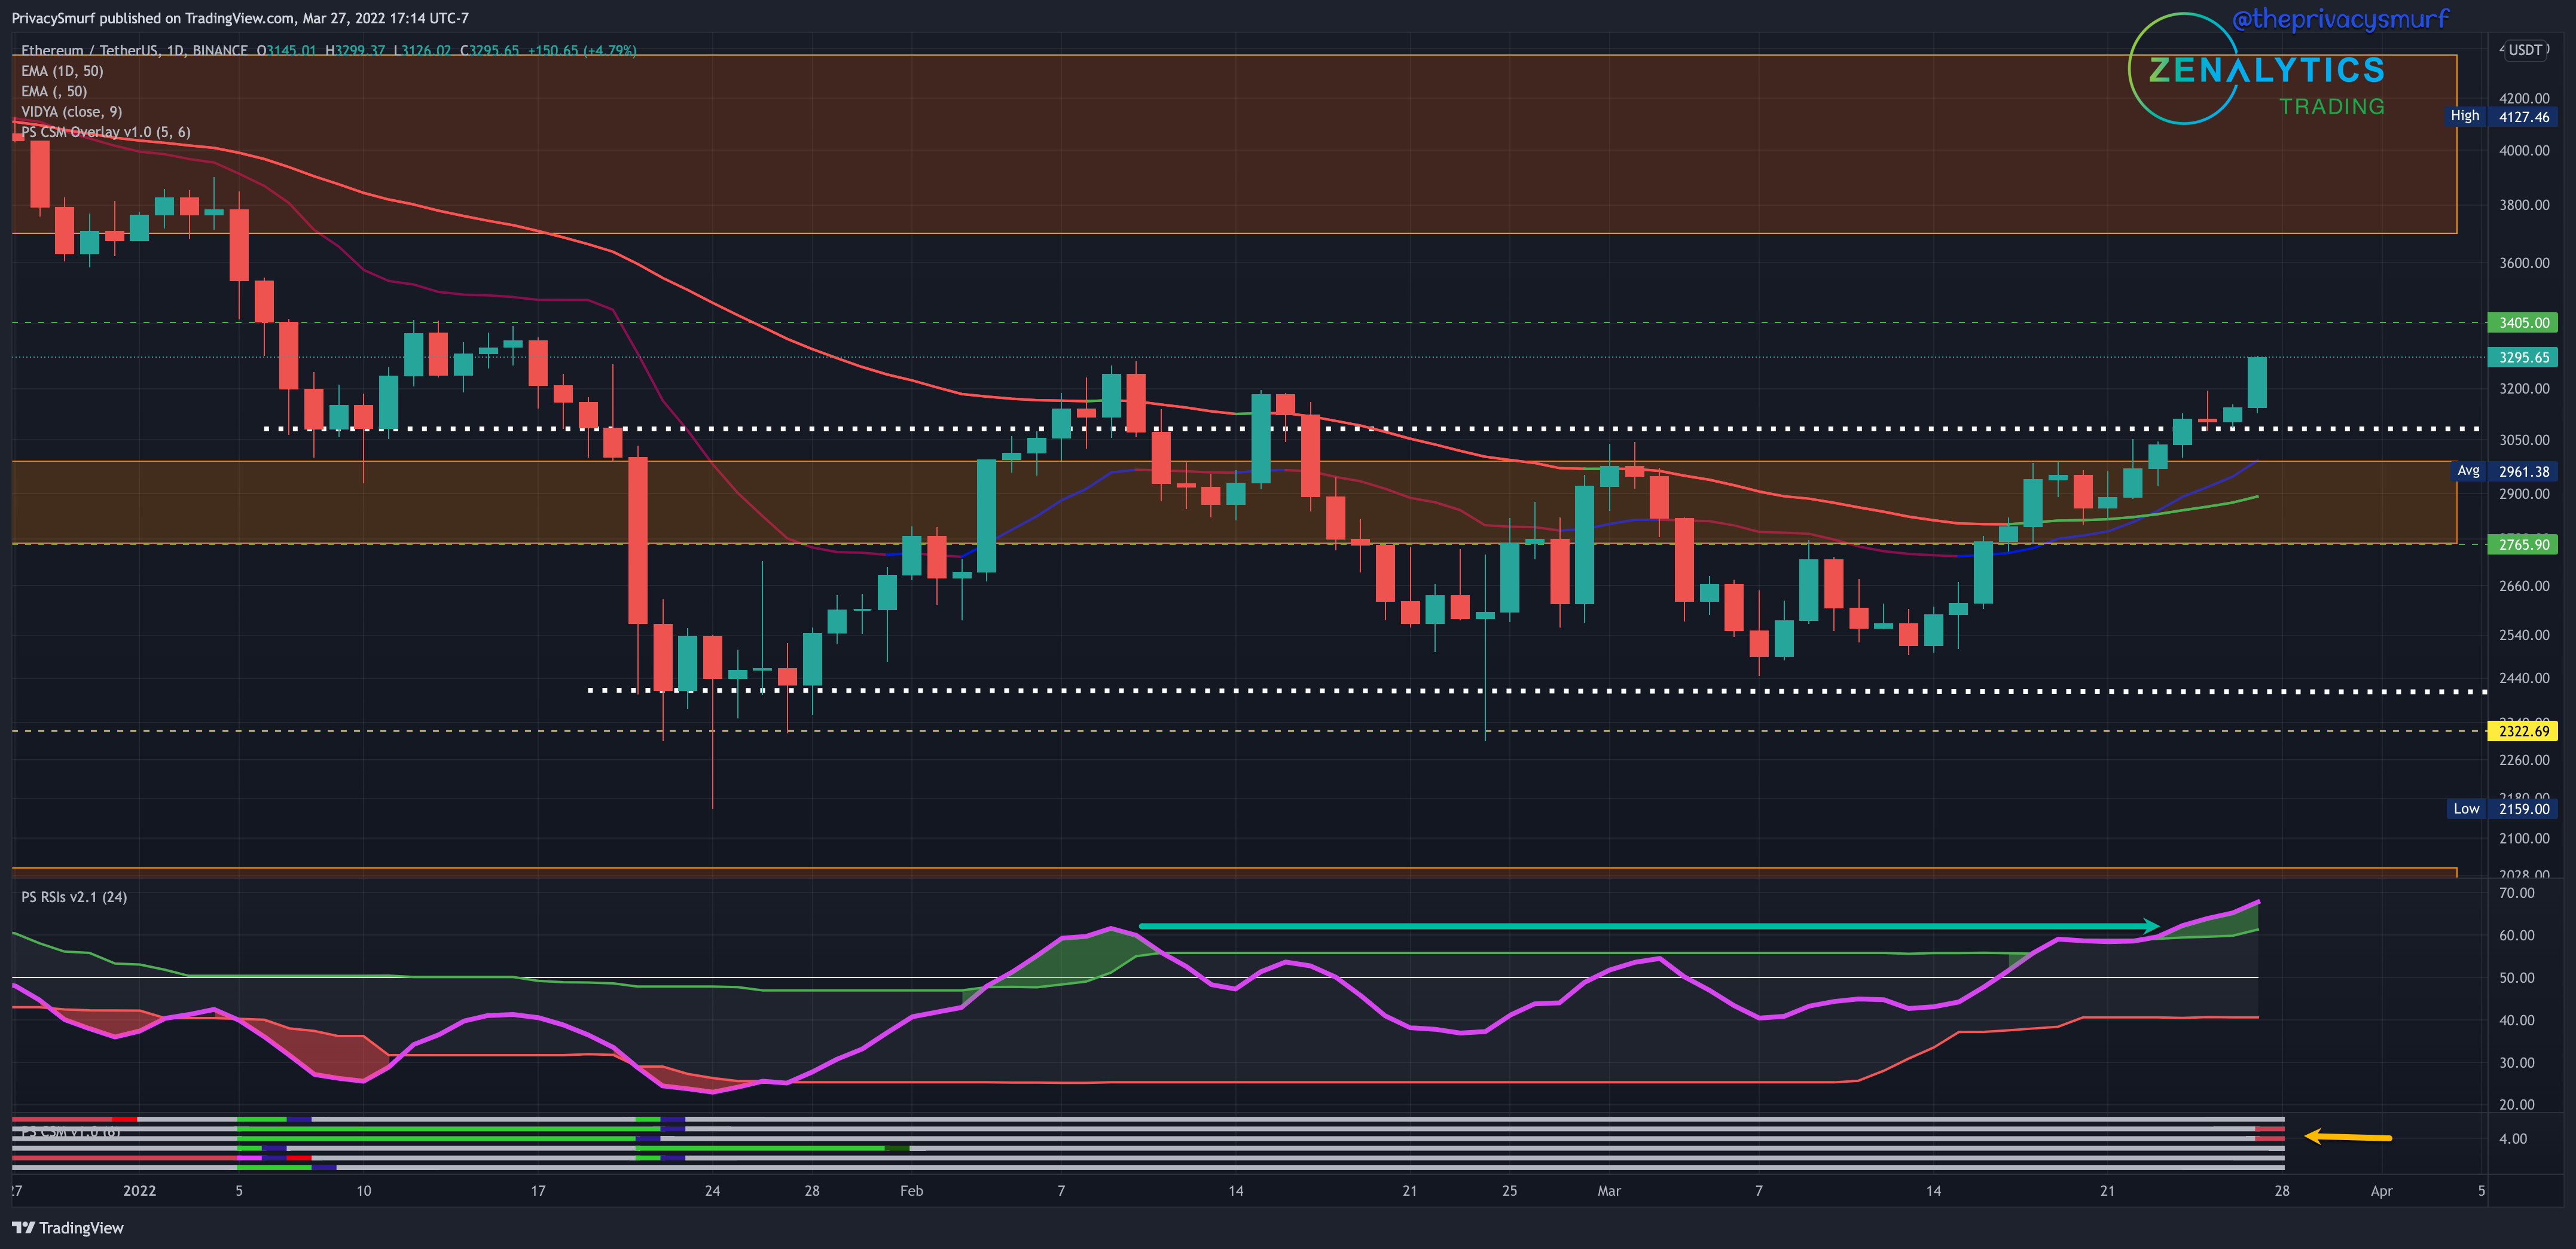
ETH/BTC Daily Chart
https://www.tradingview.com/chart/gTkSjkj6/

While the ETH/BTC chart did plot the trifecta of criteria I look for in a bullish setup…
(1) Bullish divergence trigger on all oscillators as shown by the green lines and dark green dot on the CSM at the bottom of the chart and targets plotted on the top price chart which I’ve enclosed in the yellow box.
(2) Prices trading above the 50-Day EMA so bullish trades are green lit.
(3) RSI in an advantageous setup with the RSI under the midline, and the top band close the the midline, followed by a bullish break of both.
….. There wasn’t the follow on increased value (yet) in ETH. The chart sitting still under this small resistance zone is preventing ETH from gaining on BTC, however as we can see on the ETH/USDT chart below it is tracking well (correlated) with BTC’s price movements. I’d not be trading any BTC to ETH at the moment and would be looking to trade alts with USDT as I’m not gaining any advantage in the relative performance of trading with ETH or BTC. IF the RSI can break above the top band again I’d expect this to be accomopanied by an break of the resistance above. On that break it’s likely that ETH and friends (alts) will run and outpace BTC.
ETH/USDT Weekly Structure
https://www.tradingview.com/chart/JPTp0aXw/

This week closed with the second-highest week of the year. Pretty great start to the new bull trend. It also closed above the last pivot point at $3059 and is beginning the transition from bearish to bullish. For a clean trend flip of market structure there still need to be a pullback to create a higher low and then a break of the high created by that retracement. I’ve demonstrated what that would need to look like with the green arrow. As long as there isn’t a weekly close under this first low pivot (green horizontal line) the potential bullish flip will be preserved. Long-term holders could choose to make a risky entry now or wait for that higher low and break of structure for a conservative entry. With ETH/BTC breaking out of the 2 week consolidation range I’d expect ETH to continue to be bullish and track with BTC prices for the coming week but the daily chart will give a better estimation.
ETH/USDT Daily Chart
https://www.tradingview.com/chart/xbB6lkZu/
ETH matched BTC with a break of the ranges. It also matched with bearish divergences shown on the Correction Strength Meter at the bottom of the chart. However those bearish prospects can be invalidated with new higher highs on the oscillators. Again, look for higher highs to be created like the horizontal green arrow above the RSI. This will suggest bullish price continuation, which is what I’m expecting with ETH this week. Resistance will come in at $3400 and $3600. The lows at the moment I’m expecting would be support coming in at the 50-Day EMA around $2900. Closes below that point would put ETH back into consolidation and I’d be a bit concerned about the speed of it’s bounce back to the bullish trend but hopefully early in the week we get higher prices before the retracement so the pullback just ends up being a test of the range high we just broke around $3050.
This time next week we’ll be in Q2. Are you ready for the next forecast?! I know I am. See you then. I have a few primers I’ll put out this week to give a review of cycles and how they work and how to read into the forecast. I’ll also probably end up making this particular forecast free this time. I’m really trying to get more eyeballs on this. I think there needs to be a fundamental shift in the ways people think about the crypto market cycles and I can’t do that behind closed doors. It’s one thing to tweet out all my last few projections that played out perfectly over the last 3 quarters and another thing to be in the public eye ahead of time. I realize this is also a bit dumb because how many people AREN’T saying Bitcoin will go up from here?… It’s quite the conundrum of how to make this information and my thoughts/ideas/theory more widespread. I dunno. Either way I won’t leave all my paid subscribers hanging. As we are getting into the market go up time I’ll start posting more on altcoins again, both your suggestions and my own.
On another side note I’ll be eventually hosting a private paid discord SPECIFICALLY with a trading focus rotating around my particular strategies and private indicators. If you have no desire to trade or the time to trade on a regular basis you probably shouldn’t inquire. I’ll have more info about all that later on though as it’s all still in the development phase. I’m focusing on all helping trades use objective and systematic methods that can be employed though every phase of the market; breakouts, trends and countertrends.
Anyways. Have a great week and I’ll be posting up multiple things in the coming days.
@theprivacysmurf