

Sunday Synopsis #37: 3s & 7s
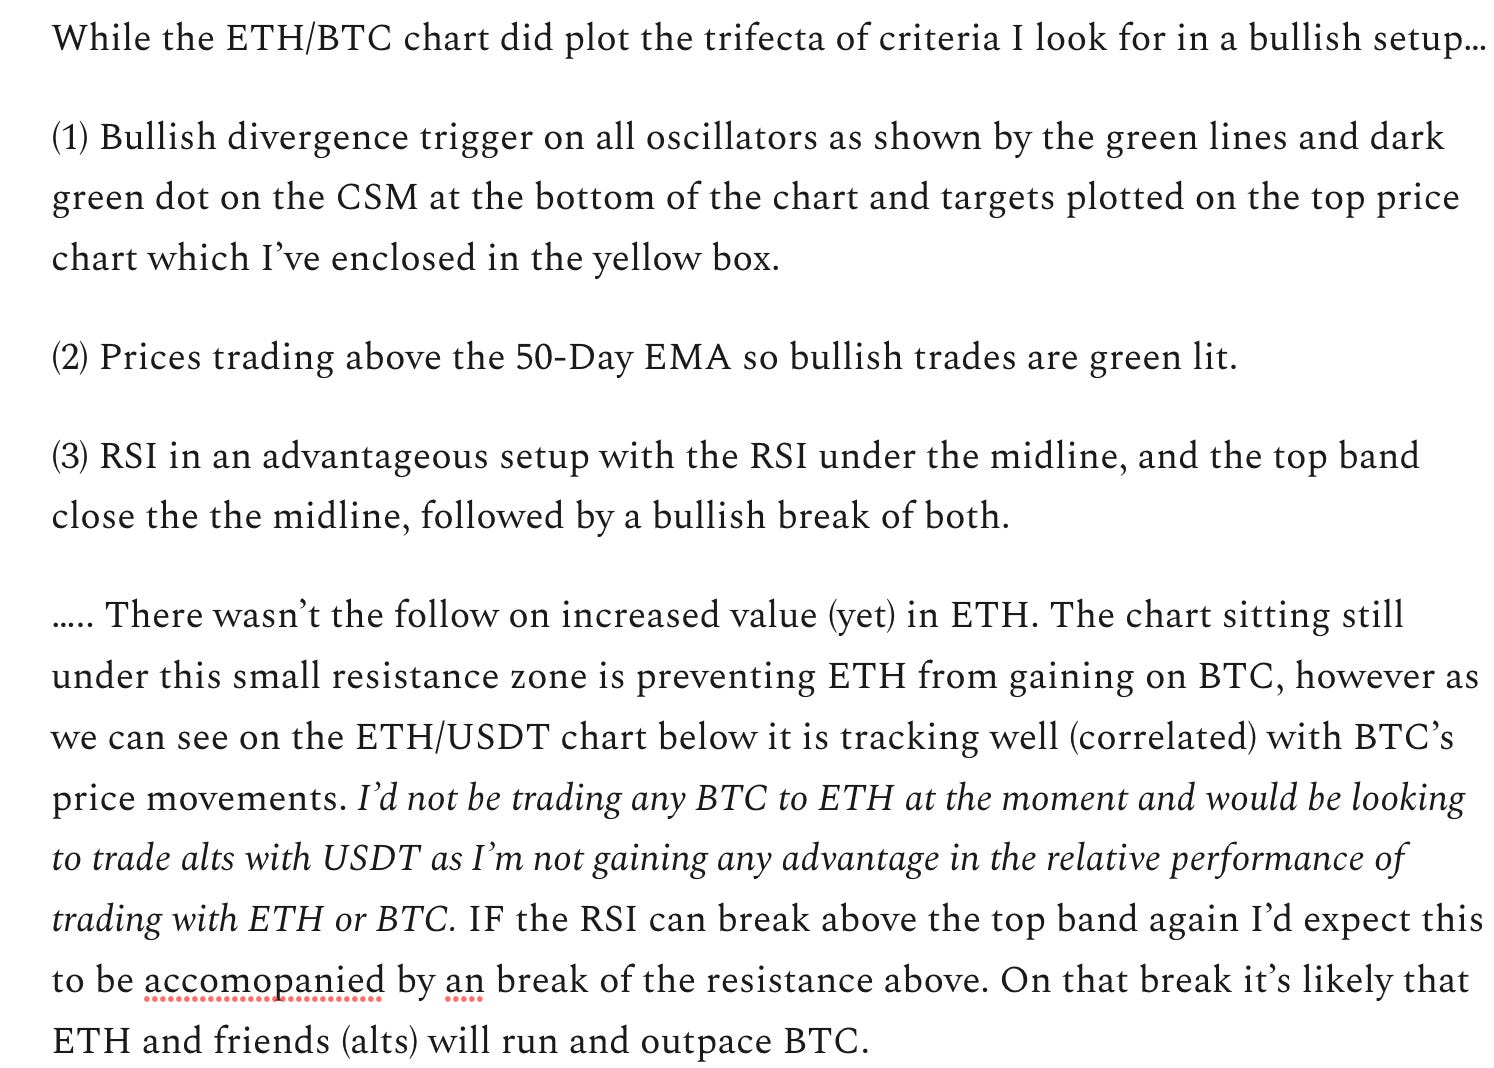
Sunday Synopsis #37: 3s & 7s
Lie, lie to my face. Tell me it ain't no thing. That's what I wanna hear.

It’s been a long week and I didn’t realize I didn’t make the update post to the Smurf Sentiment Index after I tweeted about it. Here is that tweet with the latest thoughts on it.

Looking at the live charts it would appear we are seeing that visit to the new lows tonight as projected.
BTC/USDT Weekly Structure
https://www.tradingview.com/chart/4v8qizyI/
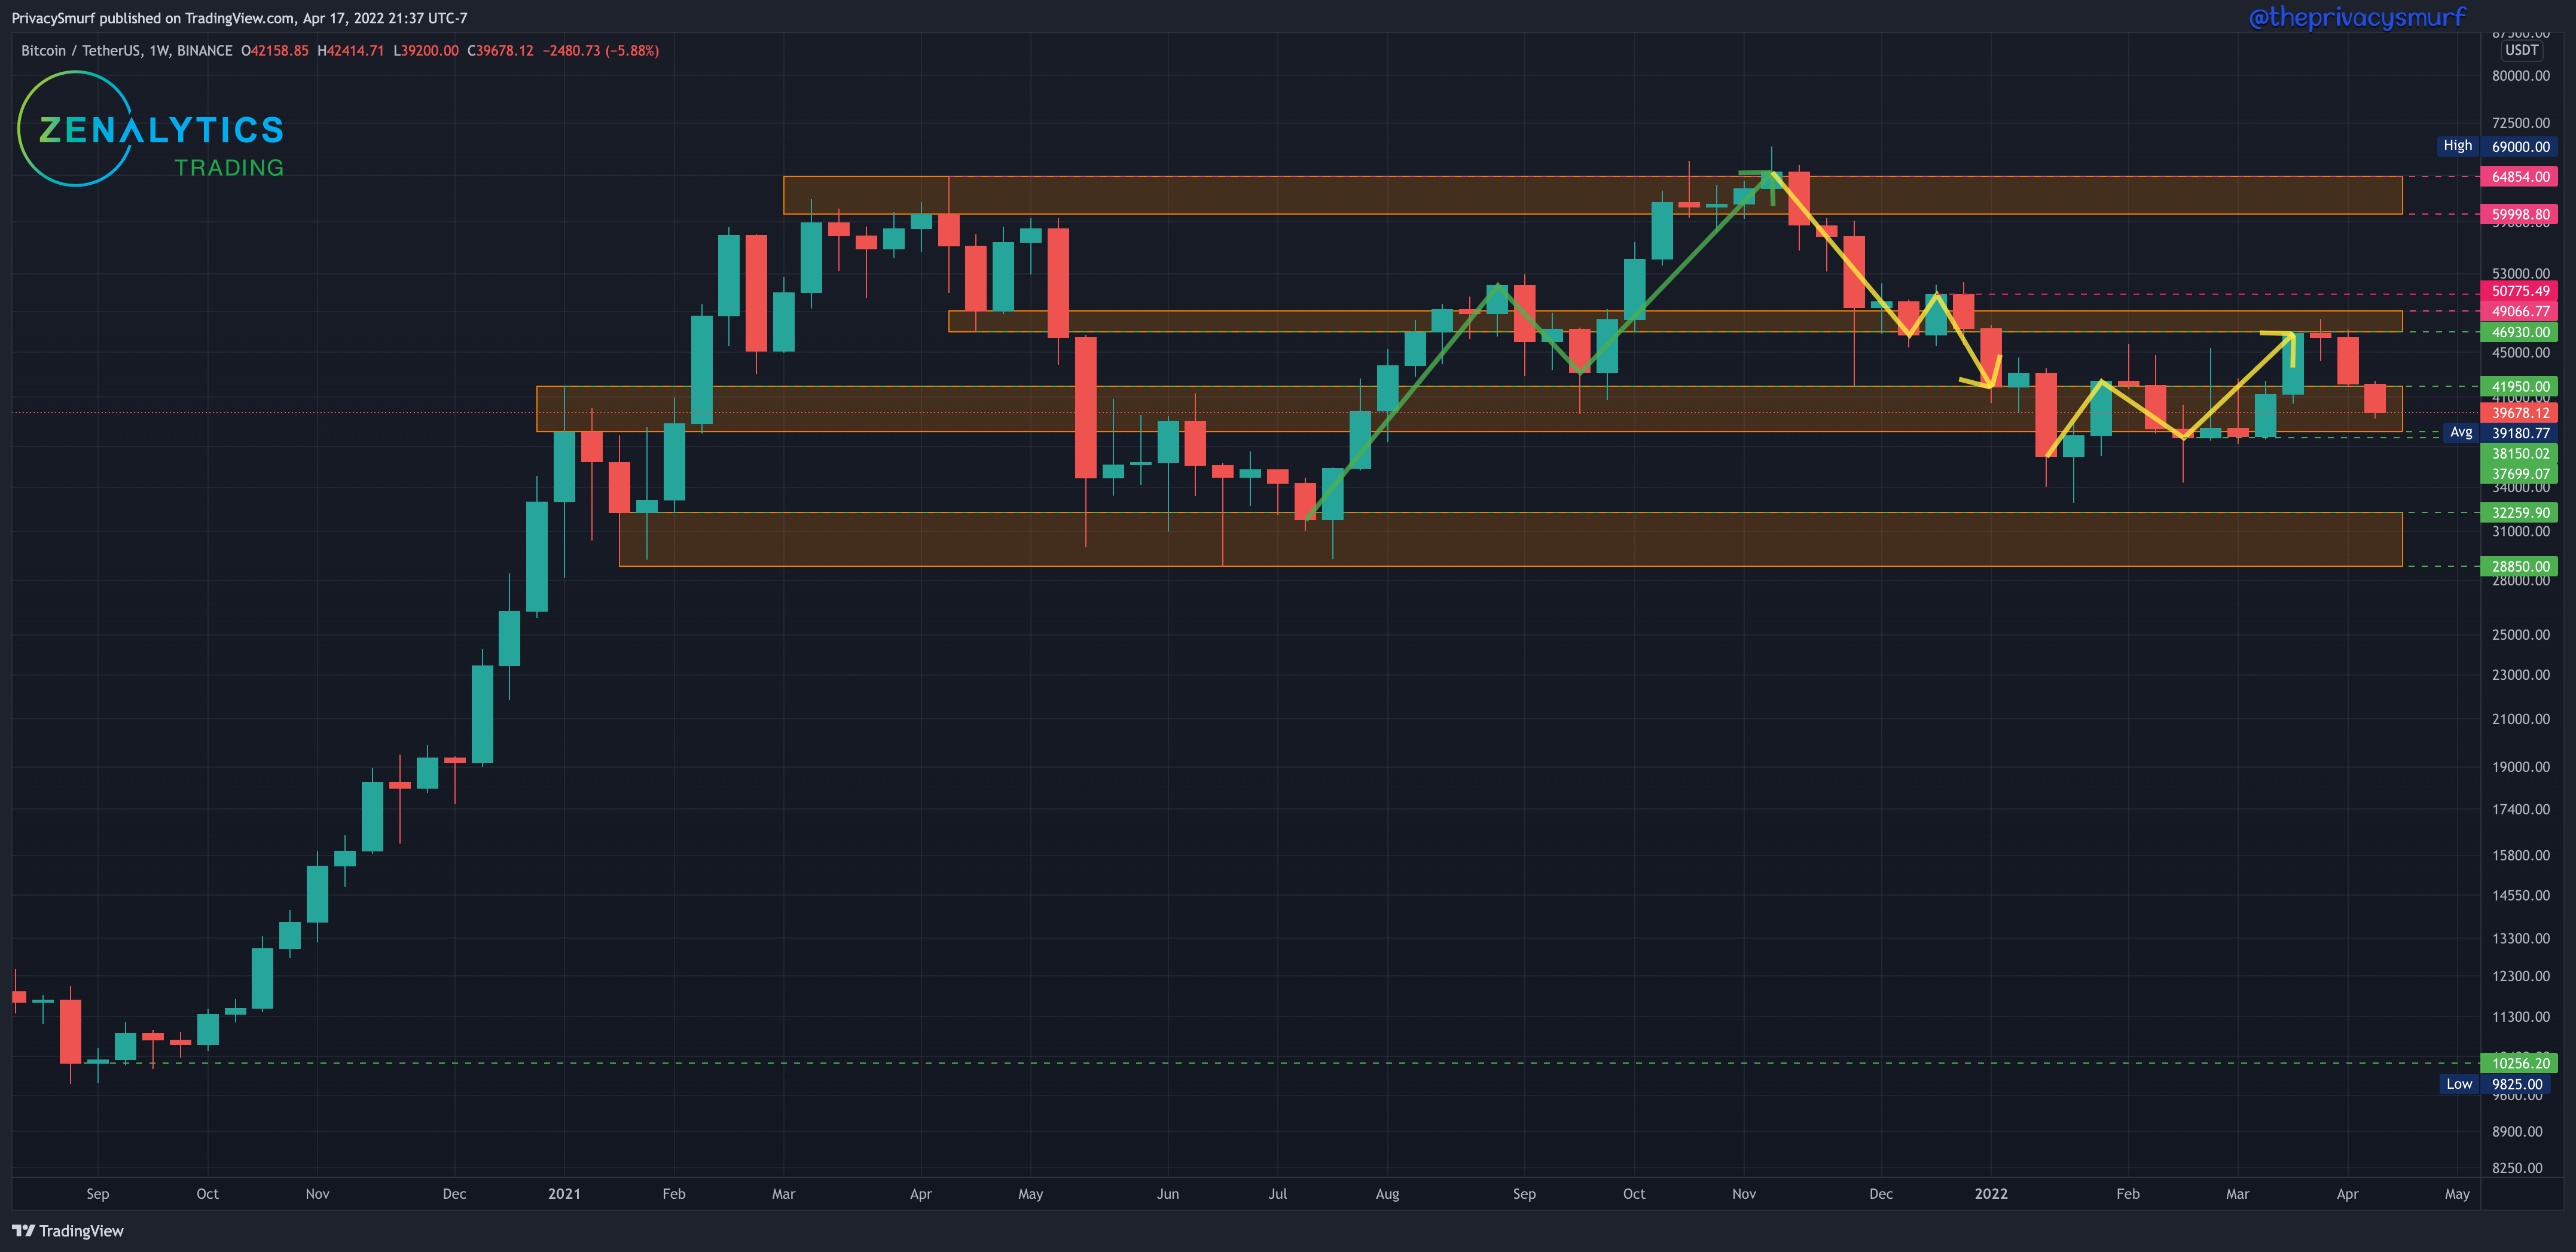
Another bearish week as we close lower in the weekly support zone. The weekly trend still remains bullish in terms of market structure. A weekly close below $38180 would put the trend back into consolidation. I am expecting support to come in at that $38k level but wicking action below is very possible. In my opinion long term positions could be added to on daily prices trading as low as 36k before I take a pause. Once the price is trading below those levels the potential for a meaningful deeper retracement increases.
BTC/USDT Daily Chart
https://www.tradingview.com/chart/jjSdFW4b/
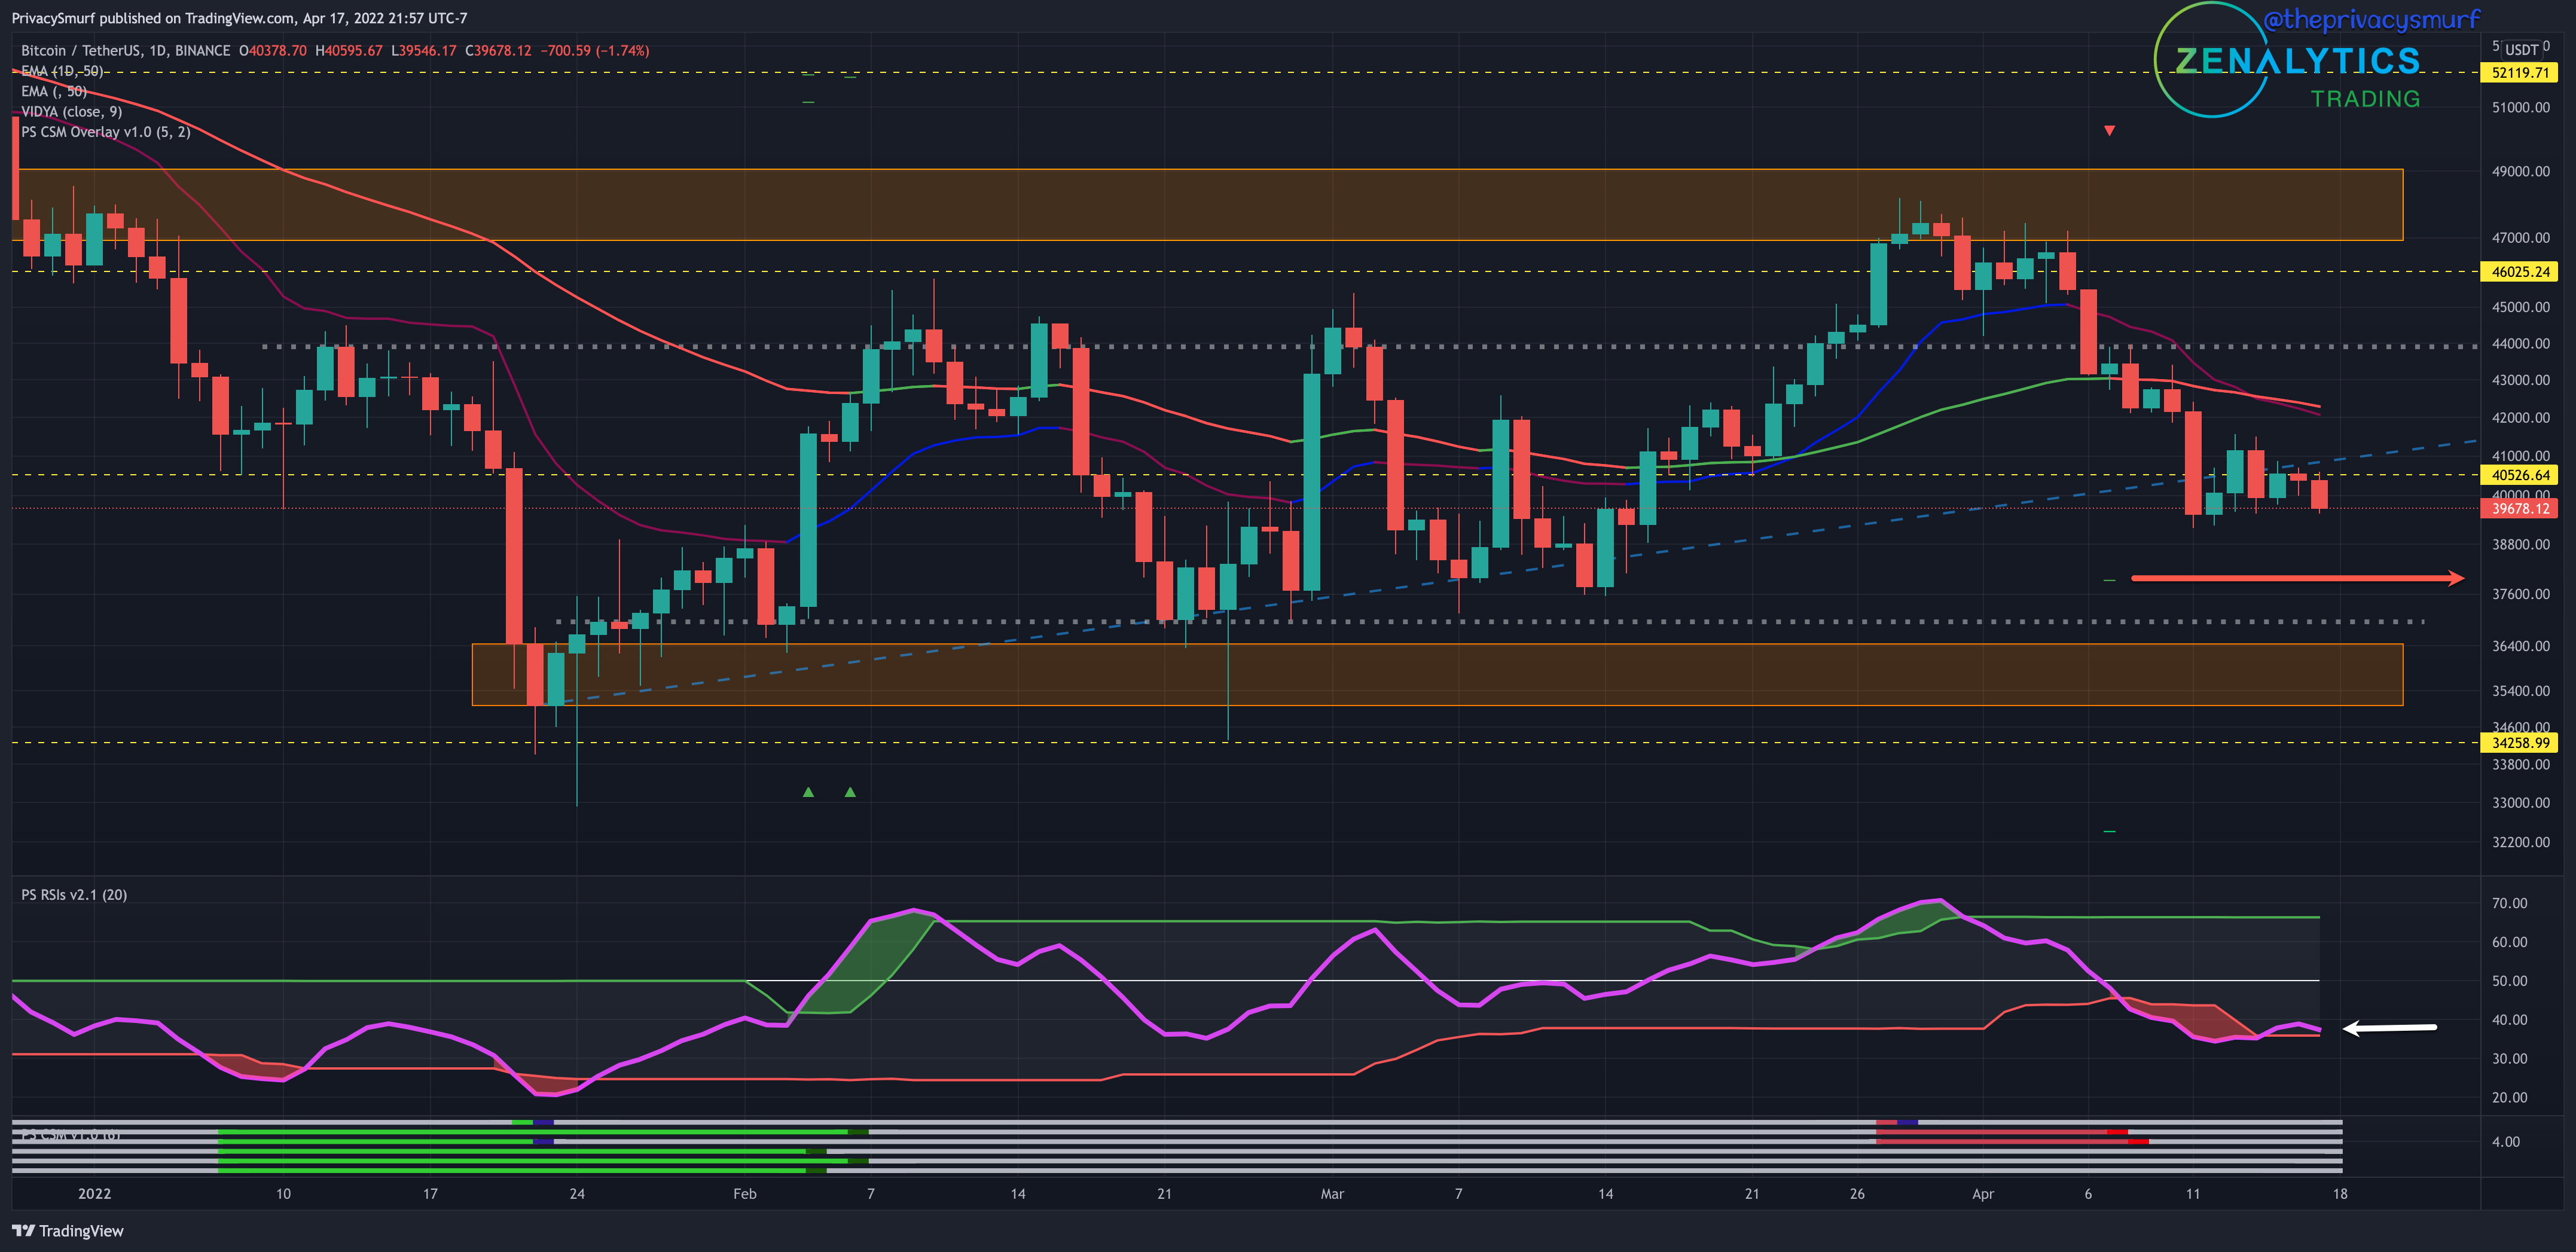
The ascending trendline that price has loosely been respecting is losing its validity. Prices this past week have been consolidating around the $40.5k level. With the RSI trending back towards downside break of the bottom band (white arrow) I’d expect a retracement early in the week. My custom indicator, shown on the bottom of the chart, the Correction Strength Meter (which is private but available upon request and payment) has signaled since April 7th the potential for a bearish retracement with initial targets for a short trade around the $38k price level. At the moment this target is not outside of expectations. The bullish structure was lost at the failure at $41k. I’d put an expected range this week around $37k to $42k.
With the daily chart being in consolidation now this puts a damper on how high in price I’m speculating this cycle will go. I’ll make a post later this week with some thoughts on expectations of the cycle that I plotted in the Q2 forecast. If you missed it you can check it out here.

ETH/BTC Weekly Structure
https://www.tradingview.com/chart/sacHlXOv/
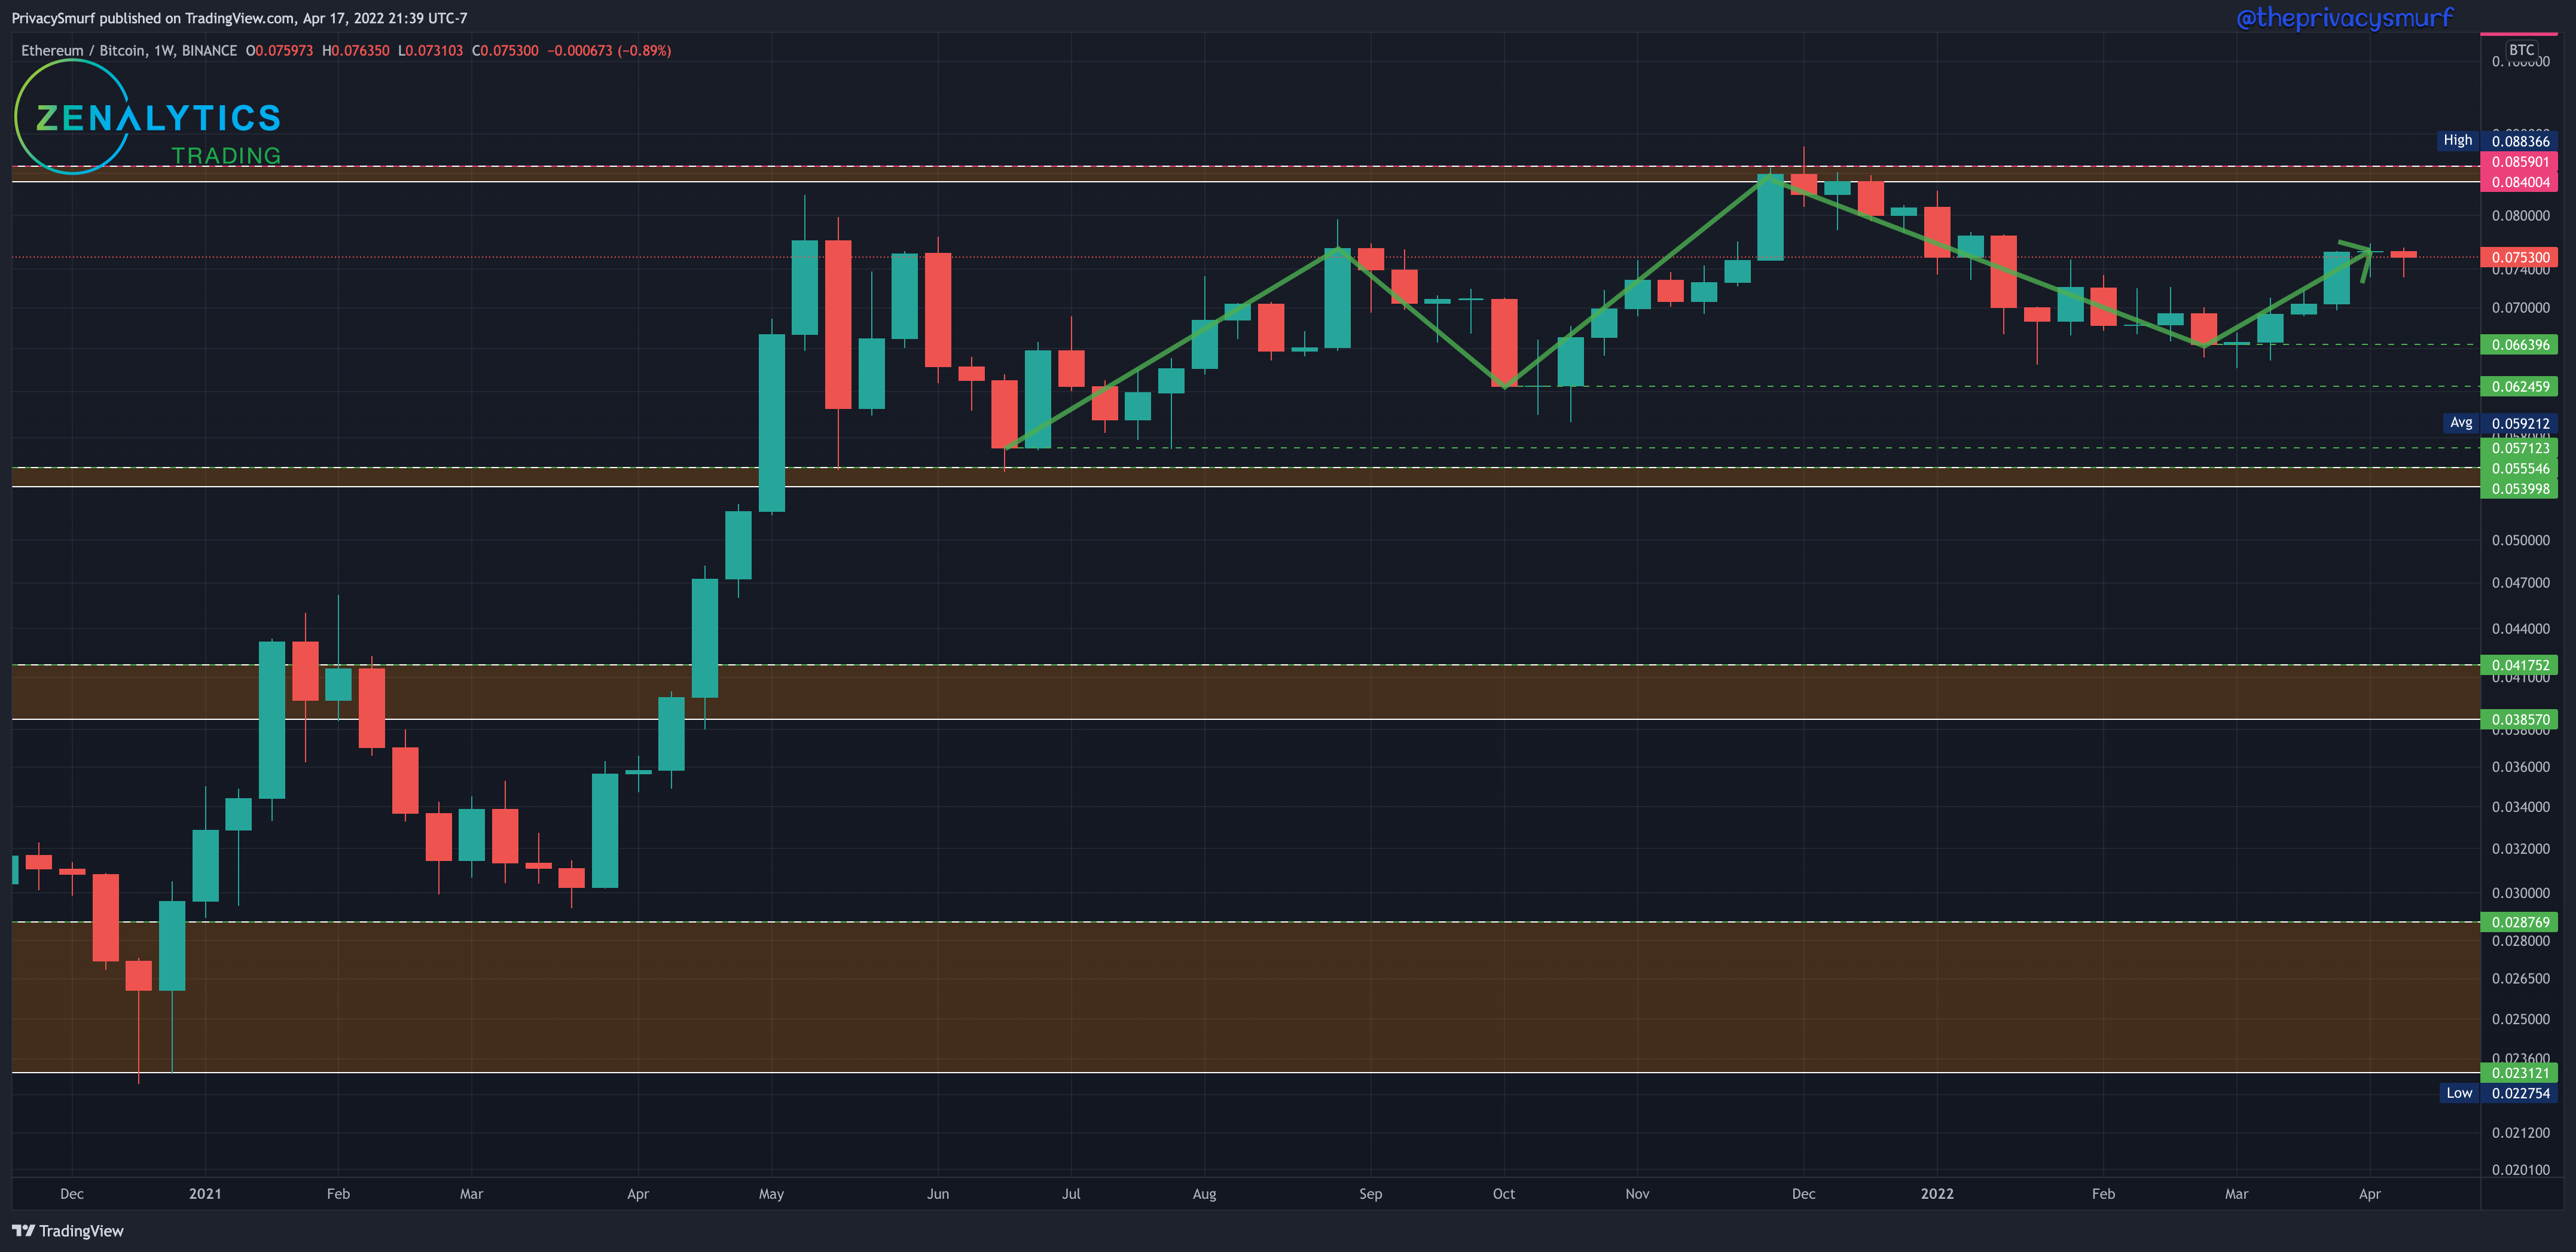
We have a second week of stagnation on in the ETH/BTC relationship. It’s been quite underwhelming. I’ll get more into this on the daily chart. The long term rotation of BTC to ETH signals have come but they haven’t been translating into any meaningful gains. Here with a second indecisive candle I’d look to the daily chart for some hint in what to expect for the coming week although there’s a slight bullish bias as structure is still bullish. A weekly close under 0.066 would transition to consolidation. I’m not expecting this by any means this week.
ETH/BTC Daily Chart
https://www.tradingview.com/chart/gTkSjkj6/
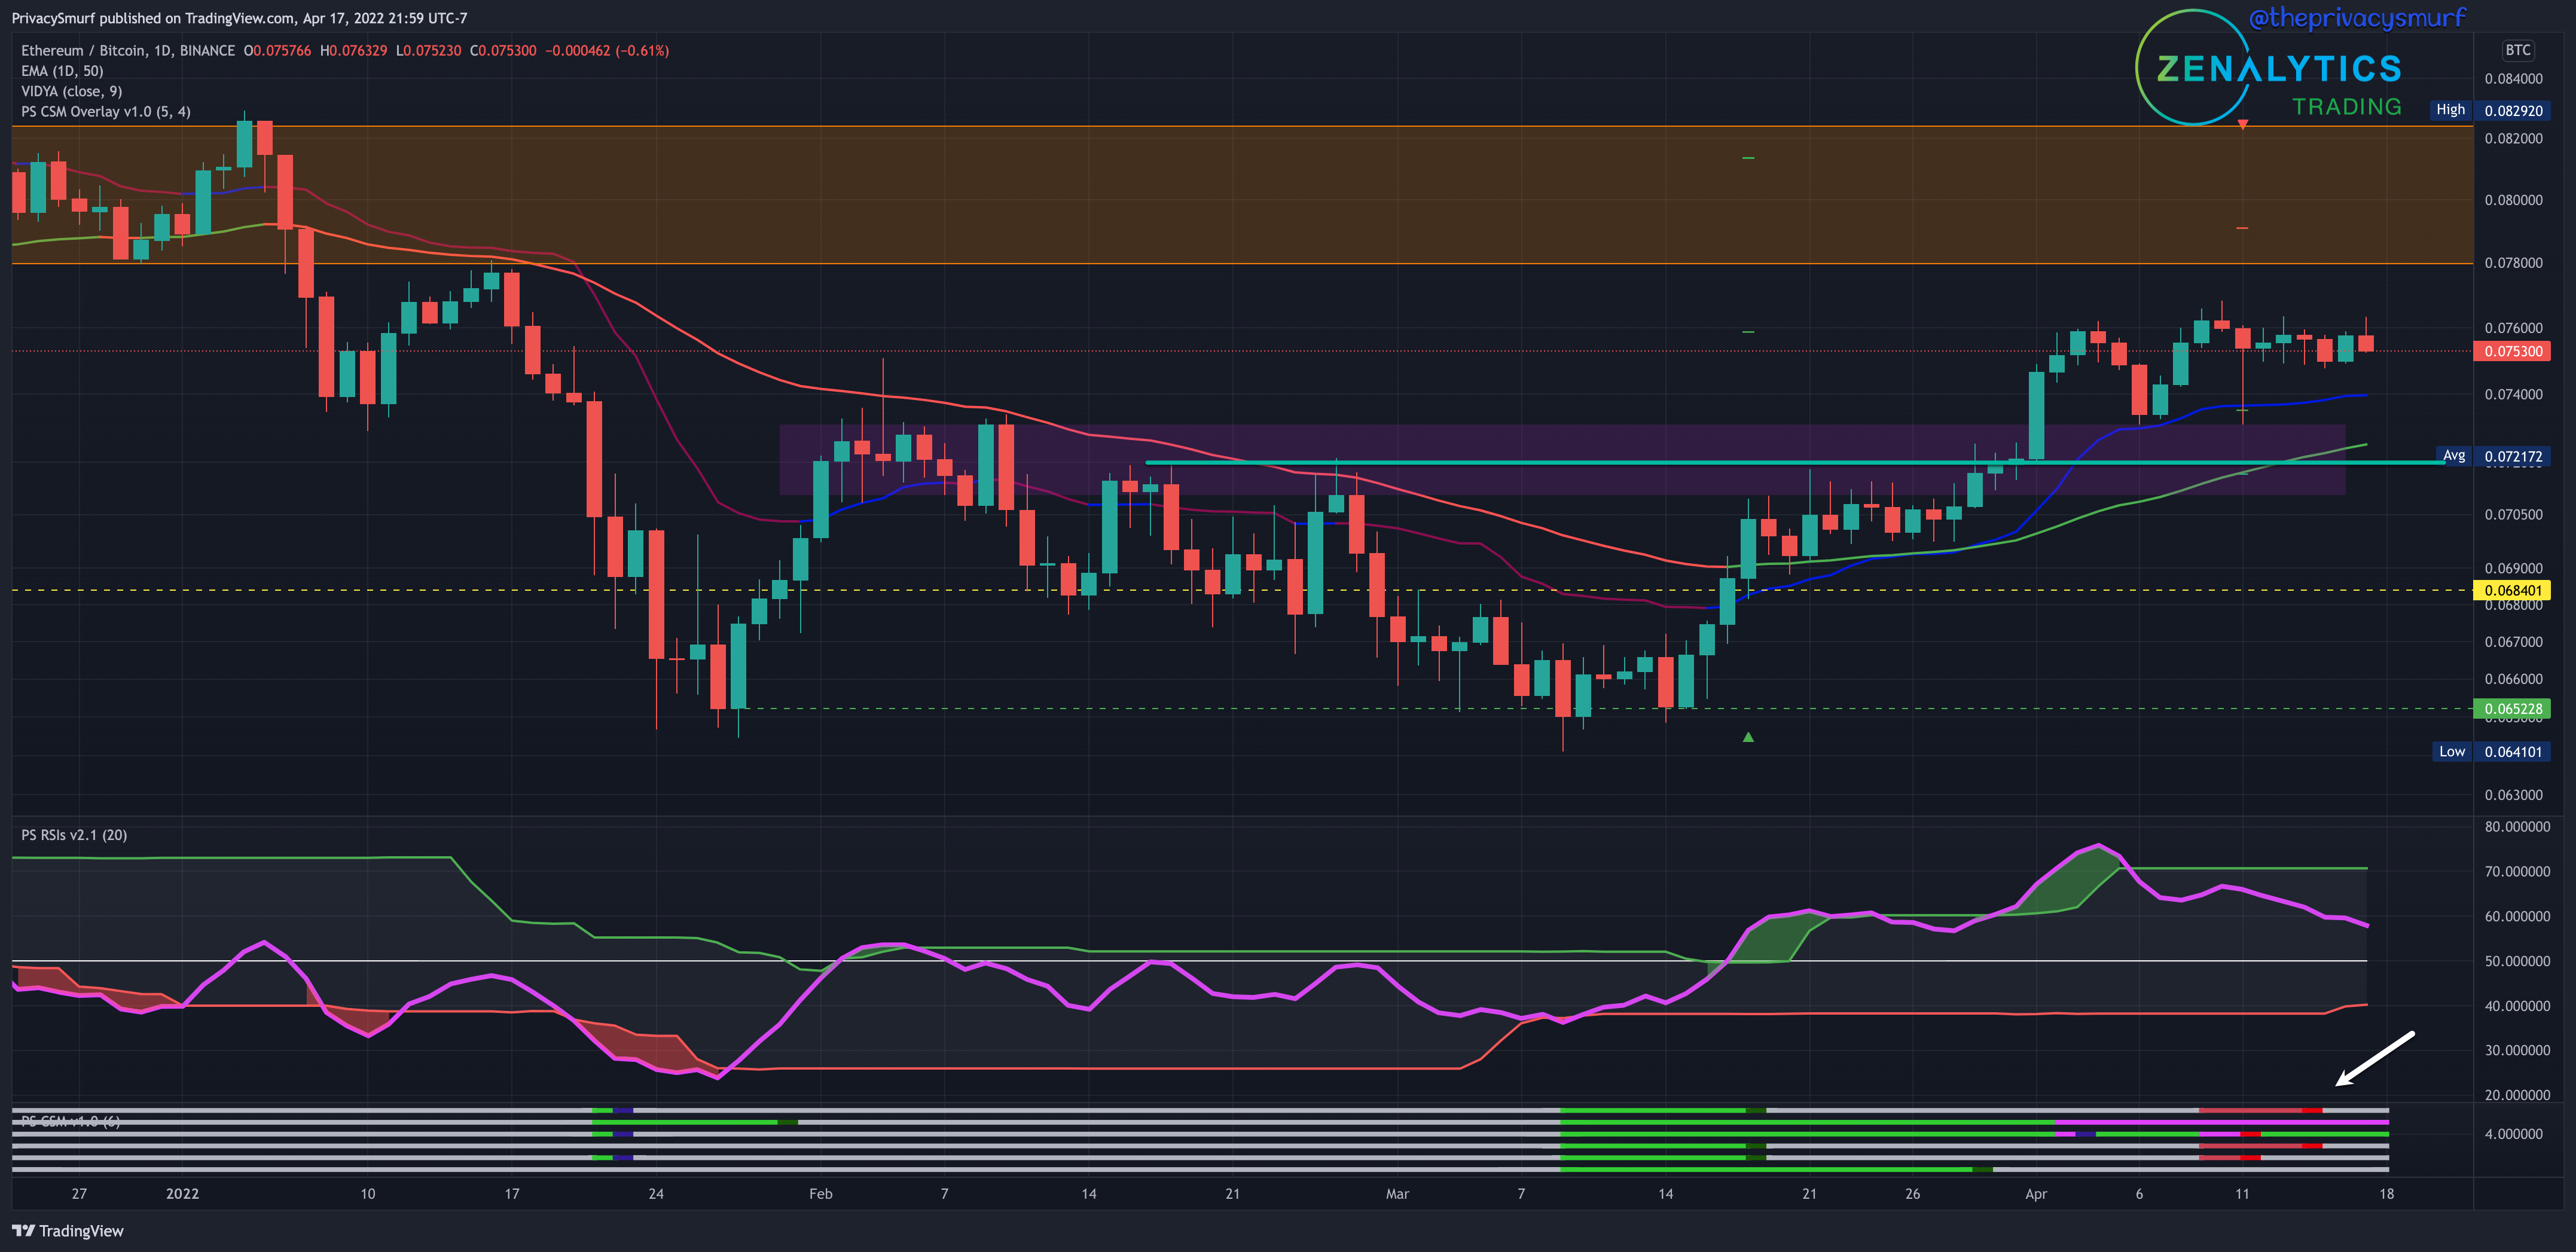
Here’s a snippet from before on the 27th of March.
The break above the resistance did come on April 1 and over the next 3 days ETH did rally 10% while BTC only rallied 3% but mostly it’s only meant that ETH hasn’t failed as much as BTC. The two tumbled shortly after with BTC slightly in the lead of losses around 17%. With the red bars on the Correction Strength Meter at the bottom of the chart I’d expect some bearish activity. This is also reflected with the RSI trending down towards the midline (white arrow). I wouldn’t expect to much wild volatility to the downside on this chart this week but trending down towards support at 0.072 and the 50-Day EMA is a realistic expectation.
ETH/USDT Weekly Structure
https://www.tradingview.com/chart/JPTp0aXw/
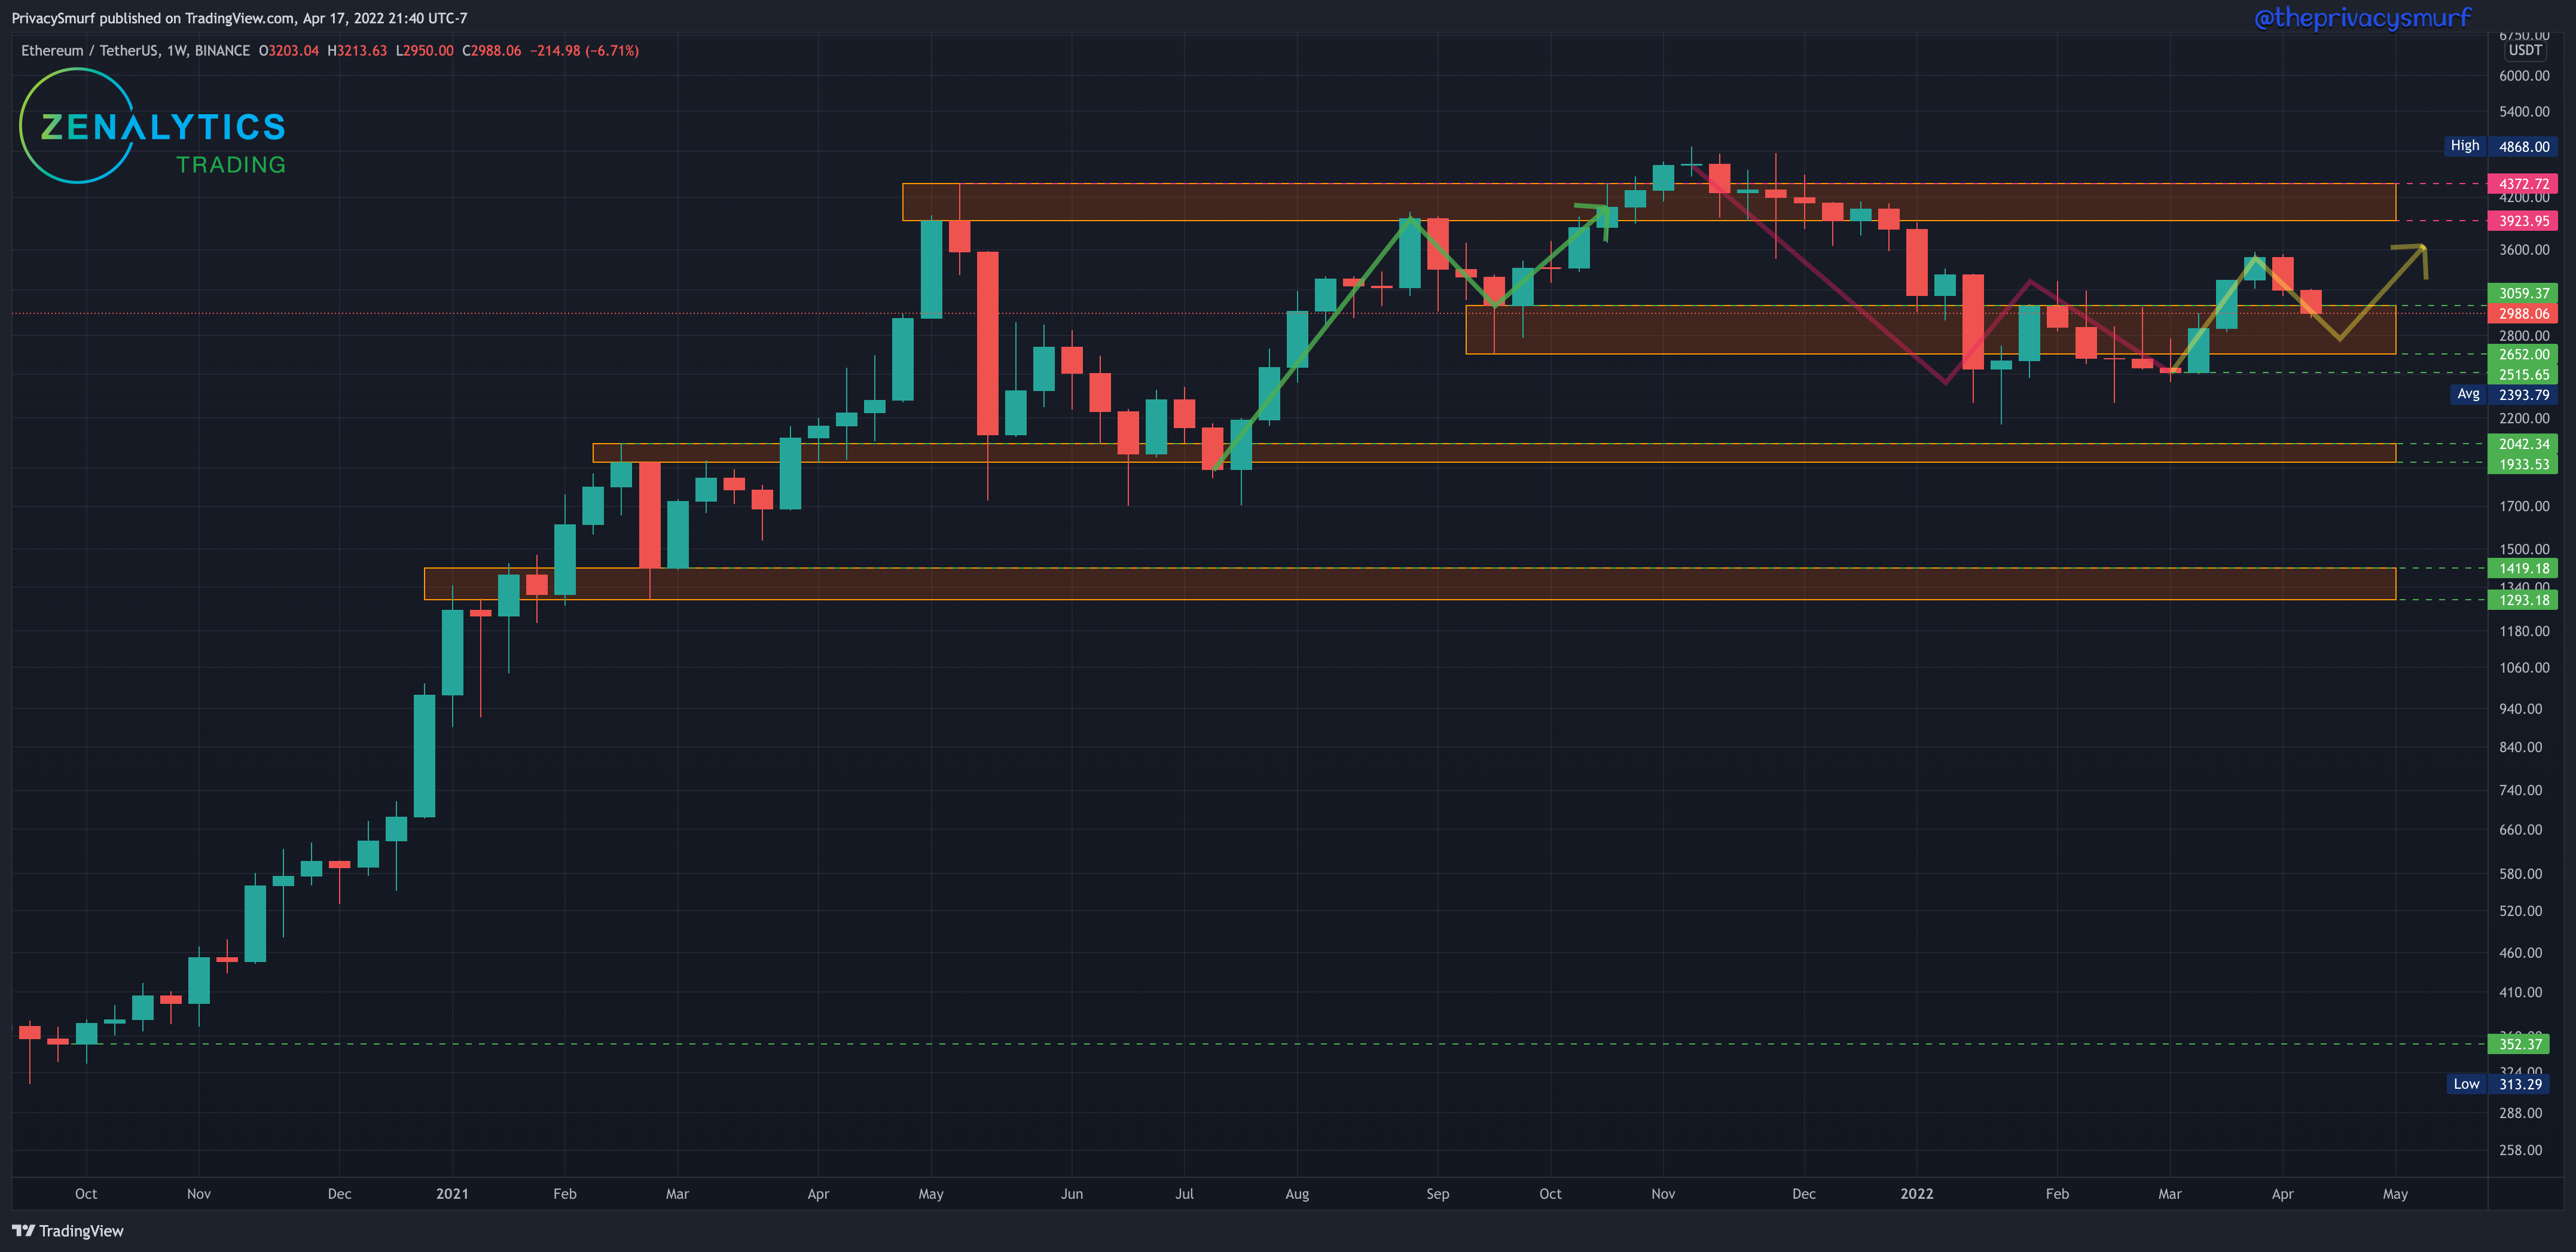
In the last Sunday Synopsis (which was way too long ago, sorry) ETH had closed above low support zone for the first time and I said this.
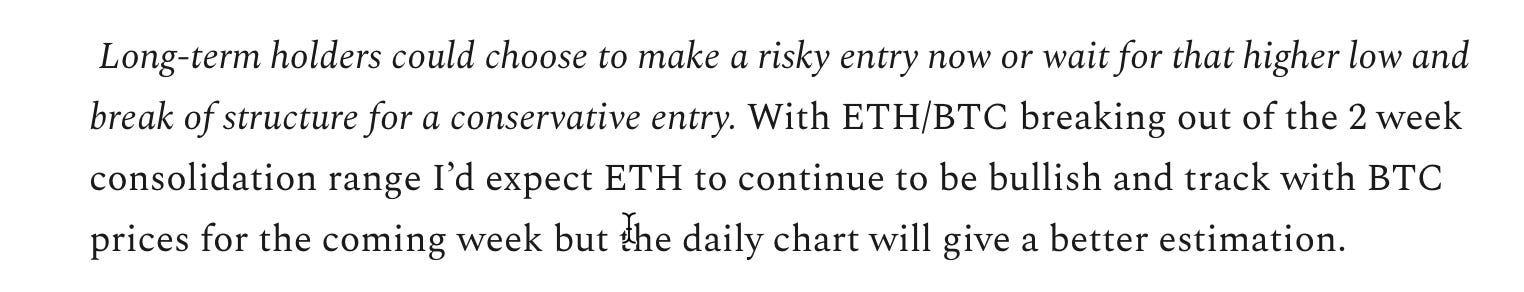
Both scenarios played out. The following week was bullish AND the risky proposition of buying the breakout showed why waiting for confirmations of strength is often a sound risk management strategy as the price tracked with BTC and fell for the next two weeks.
We are currently trending down to make (hopefully) a higher low. The bullish structure is still maintained unless a weekly close occurs below $2515. The daily chart will give a hint to the new week’s expectations.
ETH/USDT Daily Chart
https://www.tradingview.com/chart/xbB6lkZu/
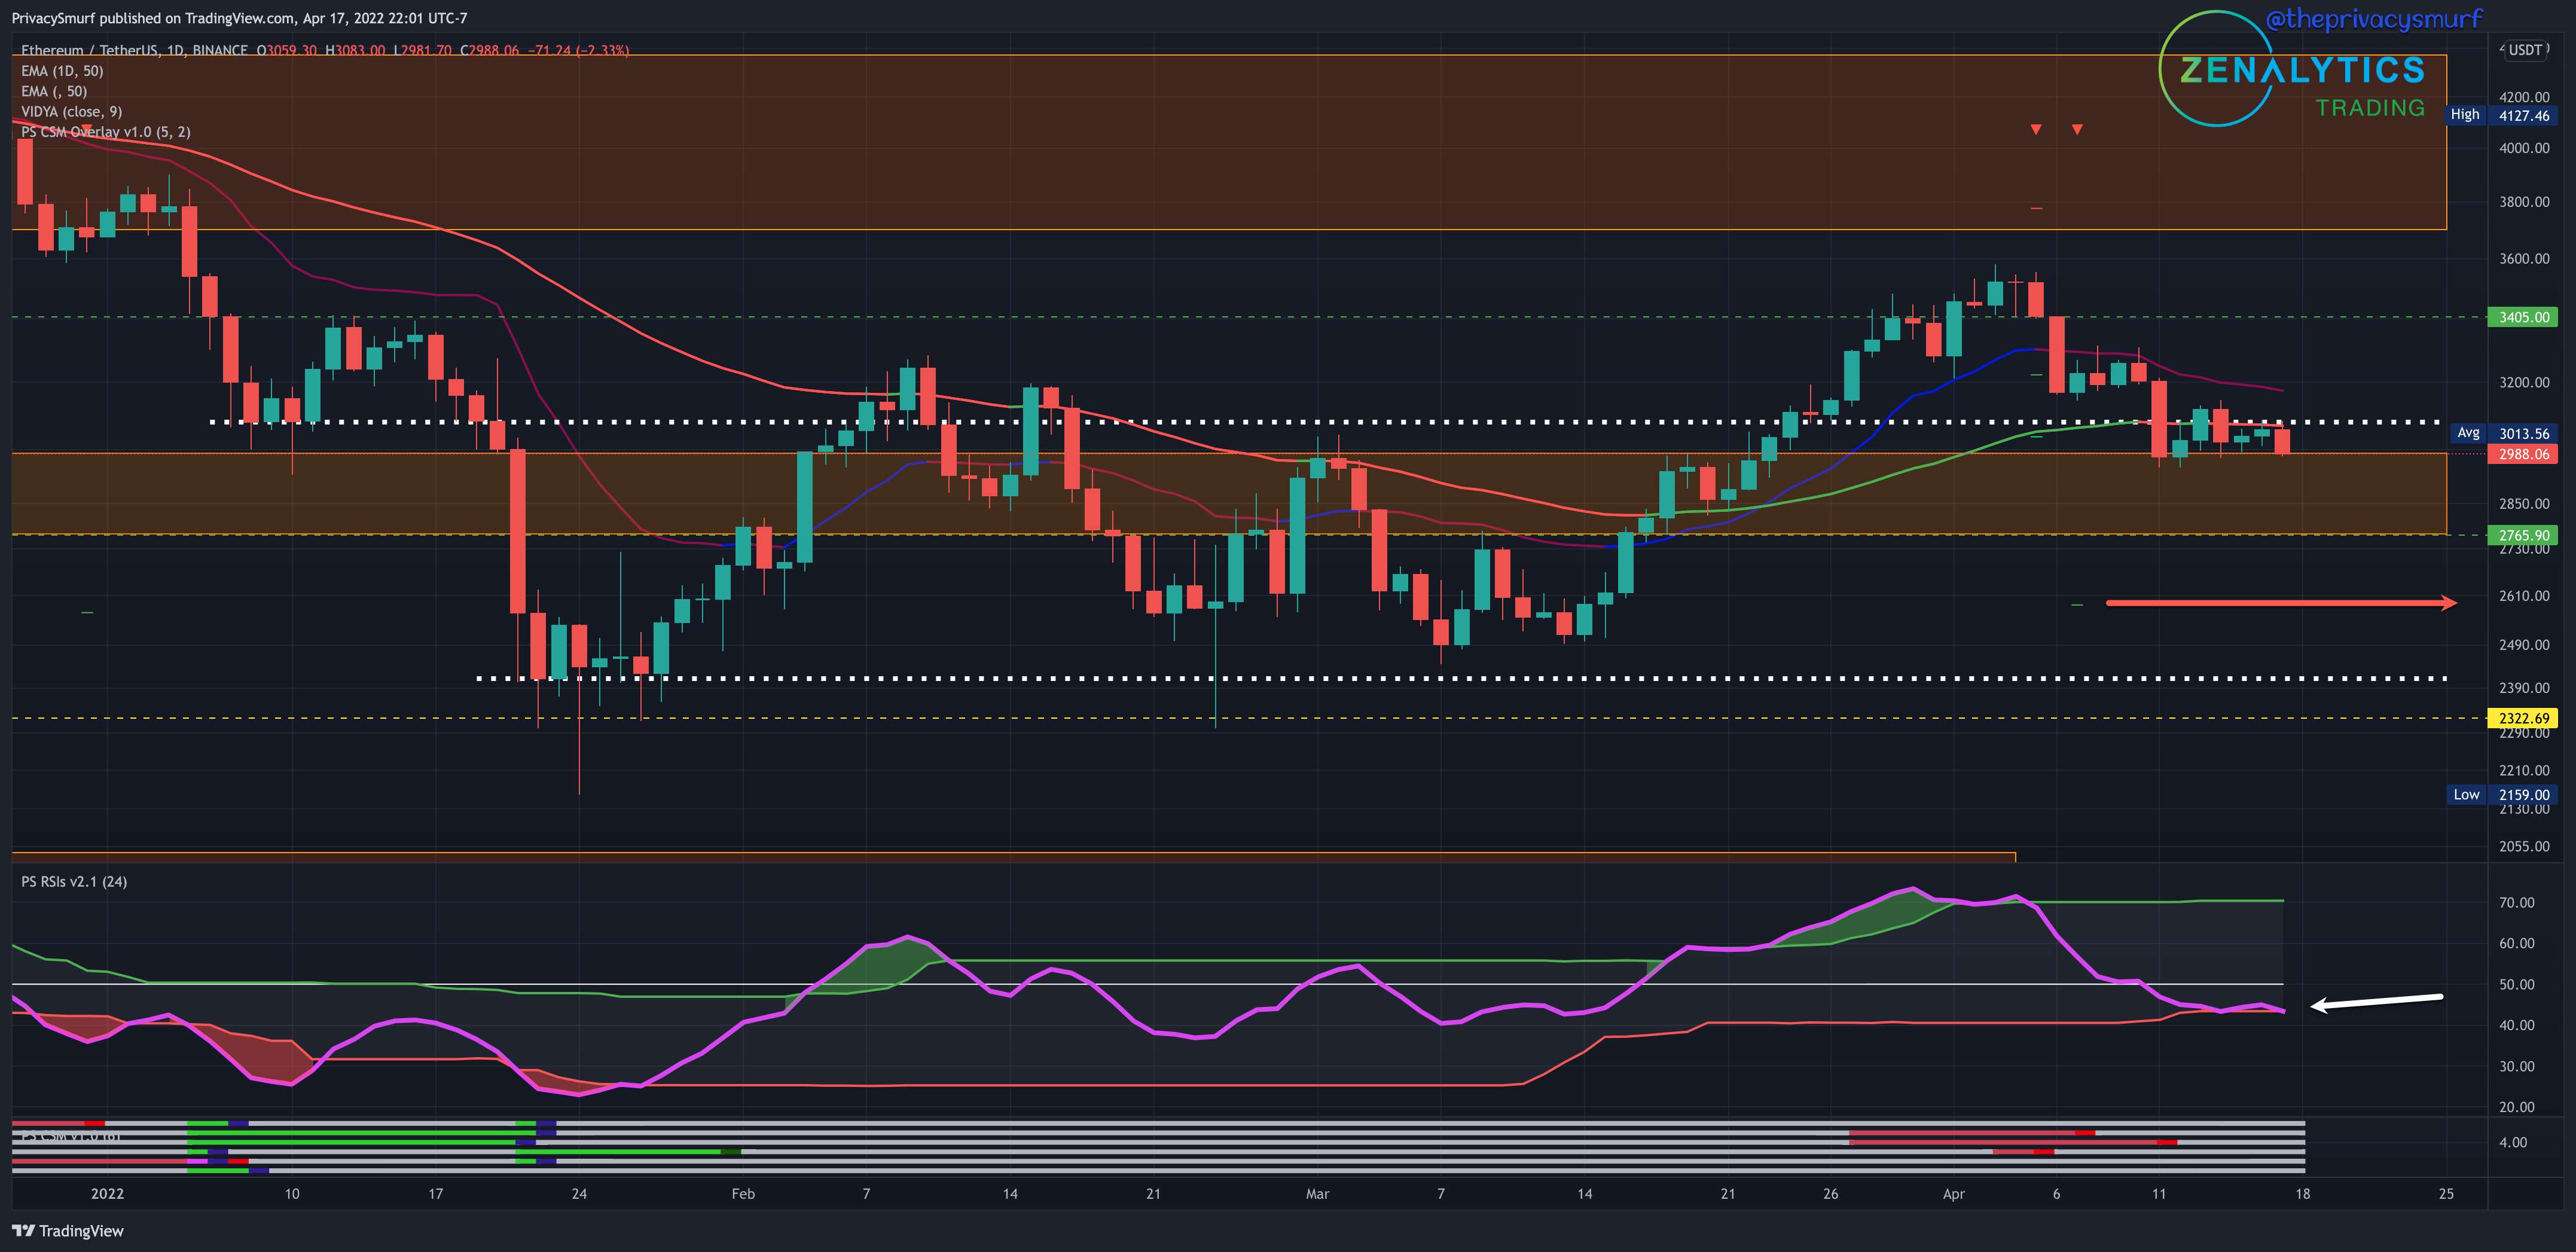
ETH matched BTC with a failure of supports and is currently consolidating under teh prior range high at $3100. It also matched with bearish divergences shown on the Correction Strength Meter at the bottom of the chart noted in the last Sunday Synopsis.
The high side resistance held up and the bearish divergences were not invalidated and eventually triggered a short trade setup. The initial targets plotted at $3200 and $3000 have been hit and there’s still one remaining target around $2600 but I’m not expecting that at the moment. With the RSI trending towards a downside break of the bottom band (white arrow) it’s not outside the realm of possibility to expect that sort of bearish volatility but this week I’m anticipating a floor around $2700 and a ceiling around $3200.
There are rumblings of potential buy volume from the US as tax season will be passed us but that’s pure speculation and not currently reflected in momentum of the money flow. It’s possible but it’s pretty risky to bet on with no signs of it. I’m hopeful but I’m not gonna make a trade on hopes.
Everyone have a great week. Side note, thanks for all the well wishes about my knee injury. It’s been getting better slowly every day. I should be back on track for posts this week. Ugh. I’m the worst, lol.
@theprivacysmurf
Thank you! I needed some confirmation of what I was observing but didn’t want to accept lol.