

Sunday Synopsis #38: Anything
Sunday Synopsis #38: Anything
I just wanna feel anything. Anything with you.

It is so easy to check out with the market sometimes when it’s slow and you just want to see something, ANYTHING, happen for some excitement.
BTC/USDT Weekly Structure
https://www.tradingview.com/chart/4v8qizyI/
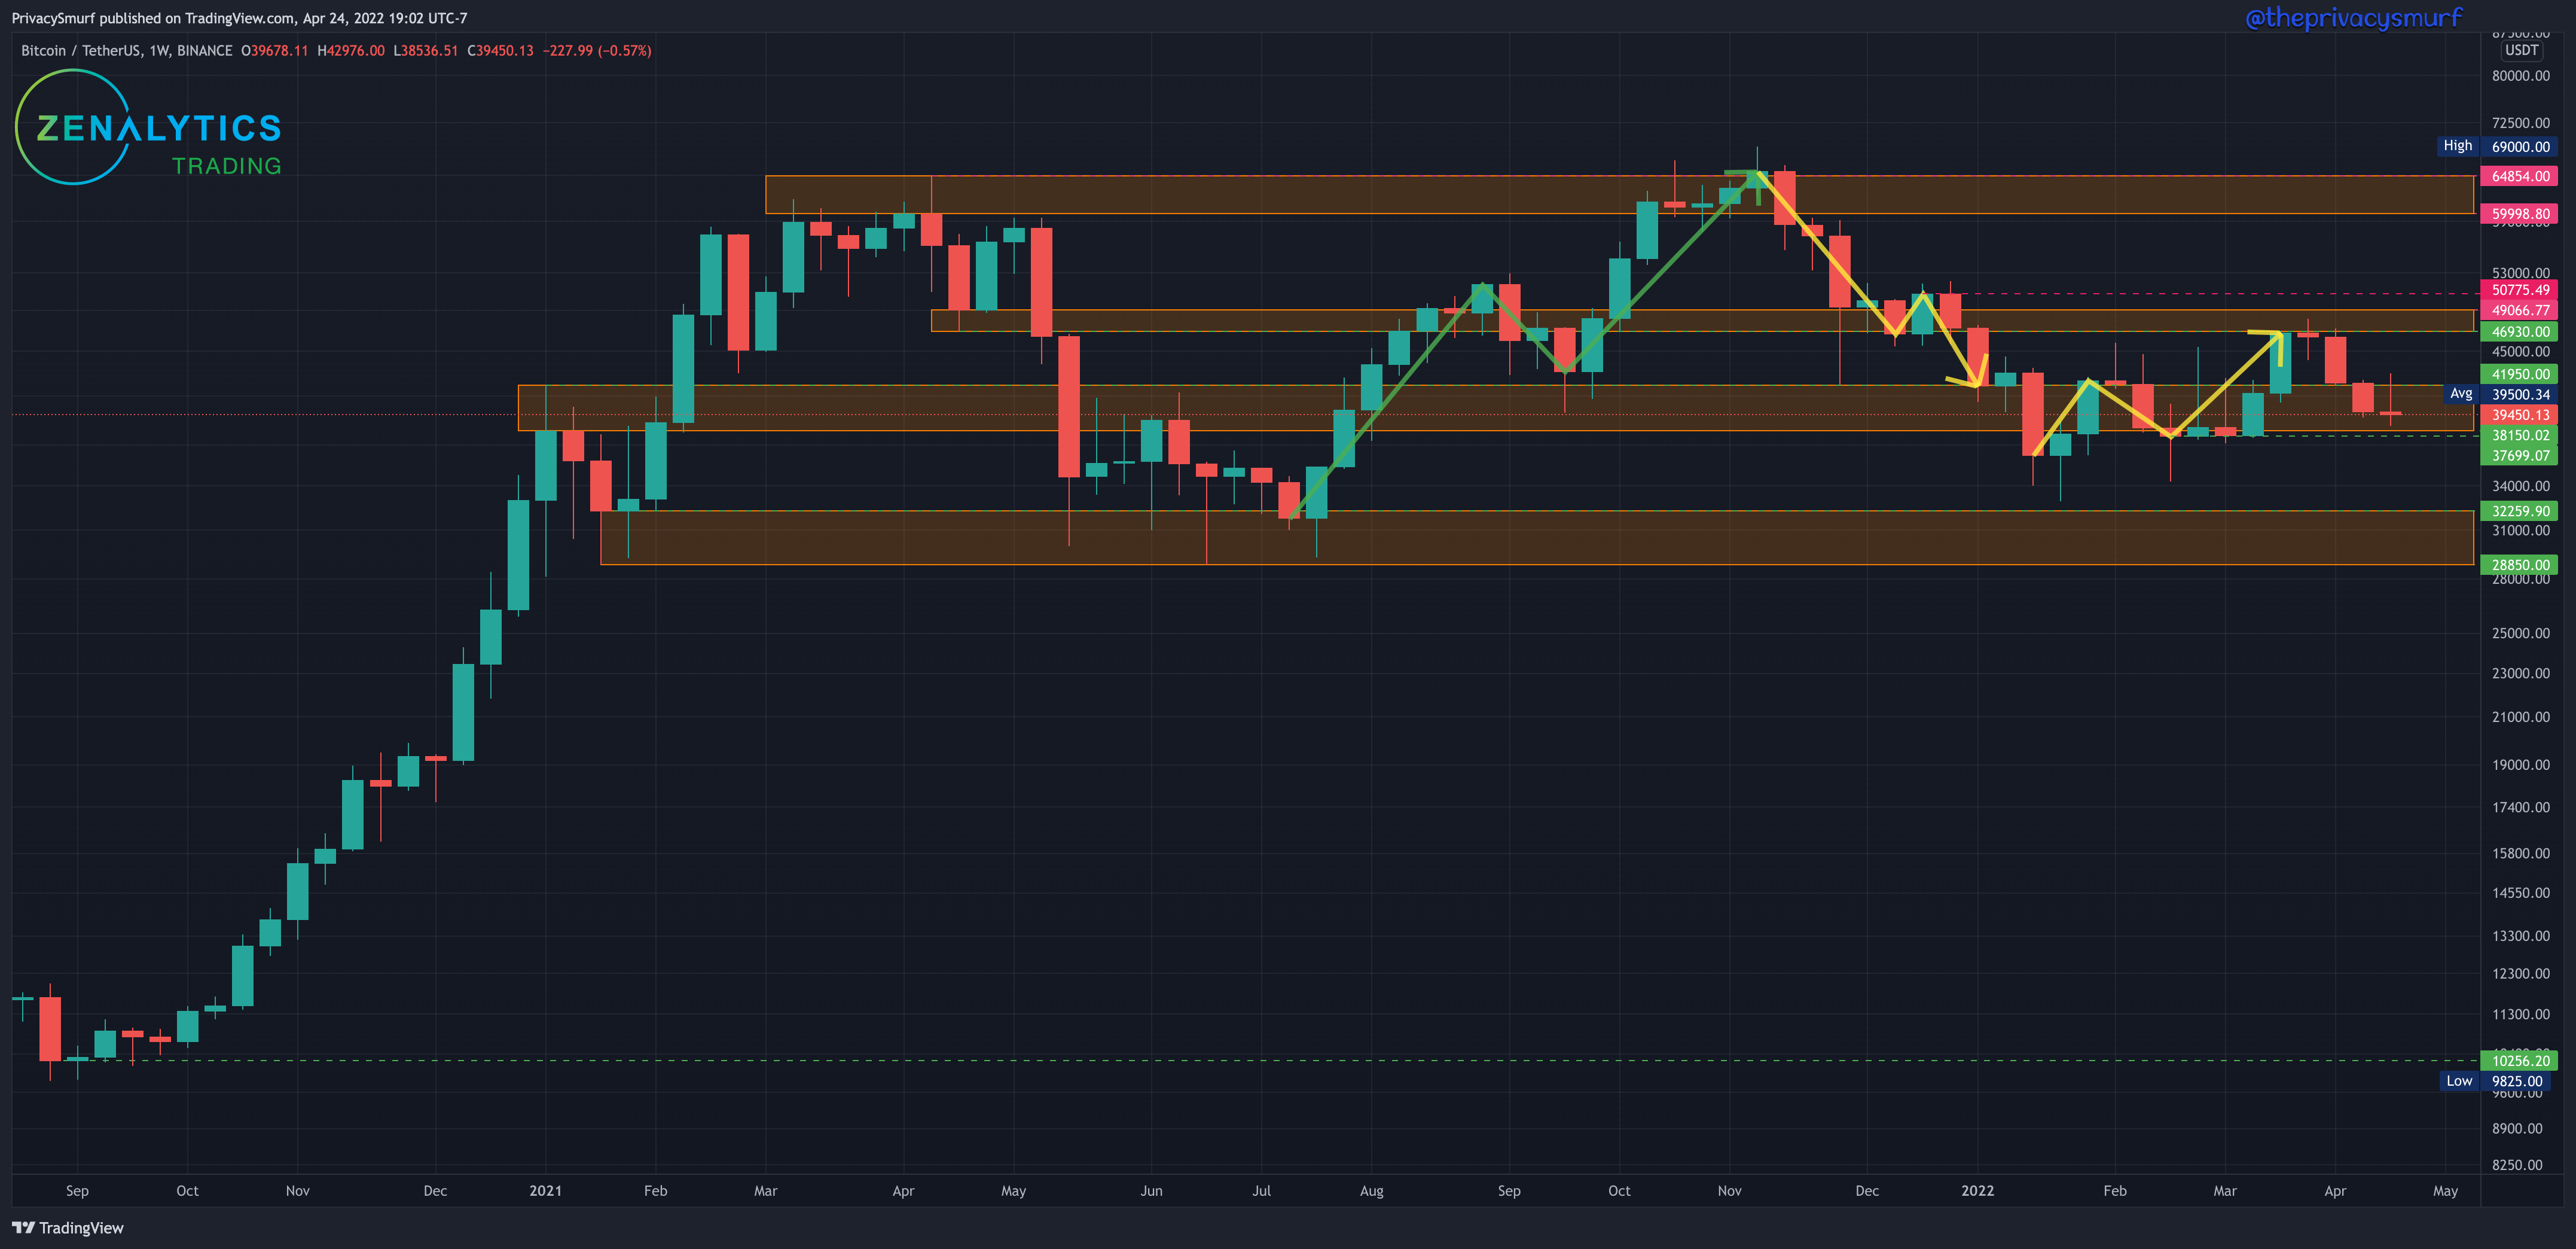
This week honestly is a repeat of last week.
Another bearish week as we close lower in the weekly support zone. The weekly trend still remains bullish in terms of market structure. A weekly close below $38180 would put the trend back into consolidation. I am expecting support to come in at that $38k level but wicking action below is very possible. In my opinion long term positions could be added to on daily prices trading as low as 36k before I take a pause. Once the price is trading below those levels the potential for a meaningful deeper retracement increases.
Closing this week as a bearish pattern (shooting star candlestick) would suggest a possible bearish price continuation the following week. The daily chart will help determine the likelihood of that.
BTC/USDT Daily Chart
https://www.tradingview.com/chart/jjSdFW4b/
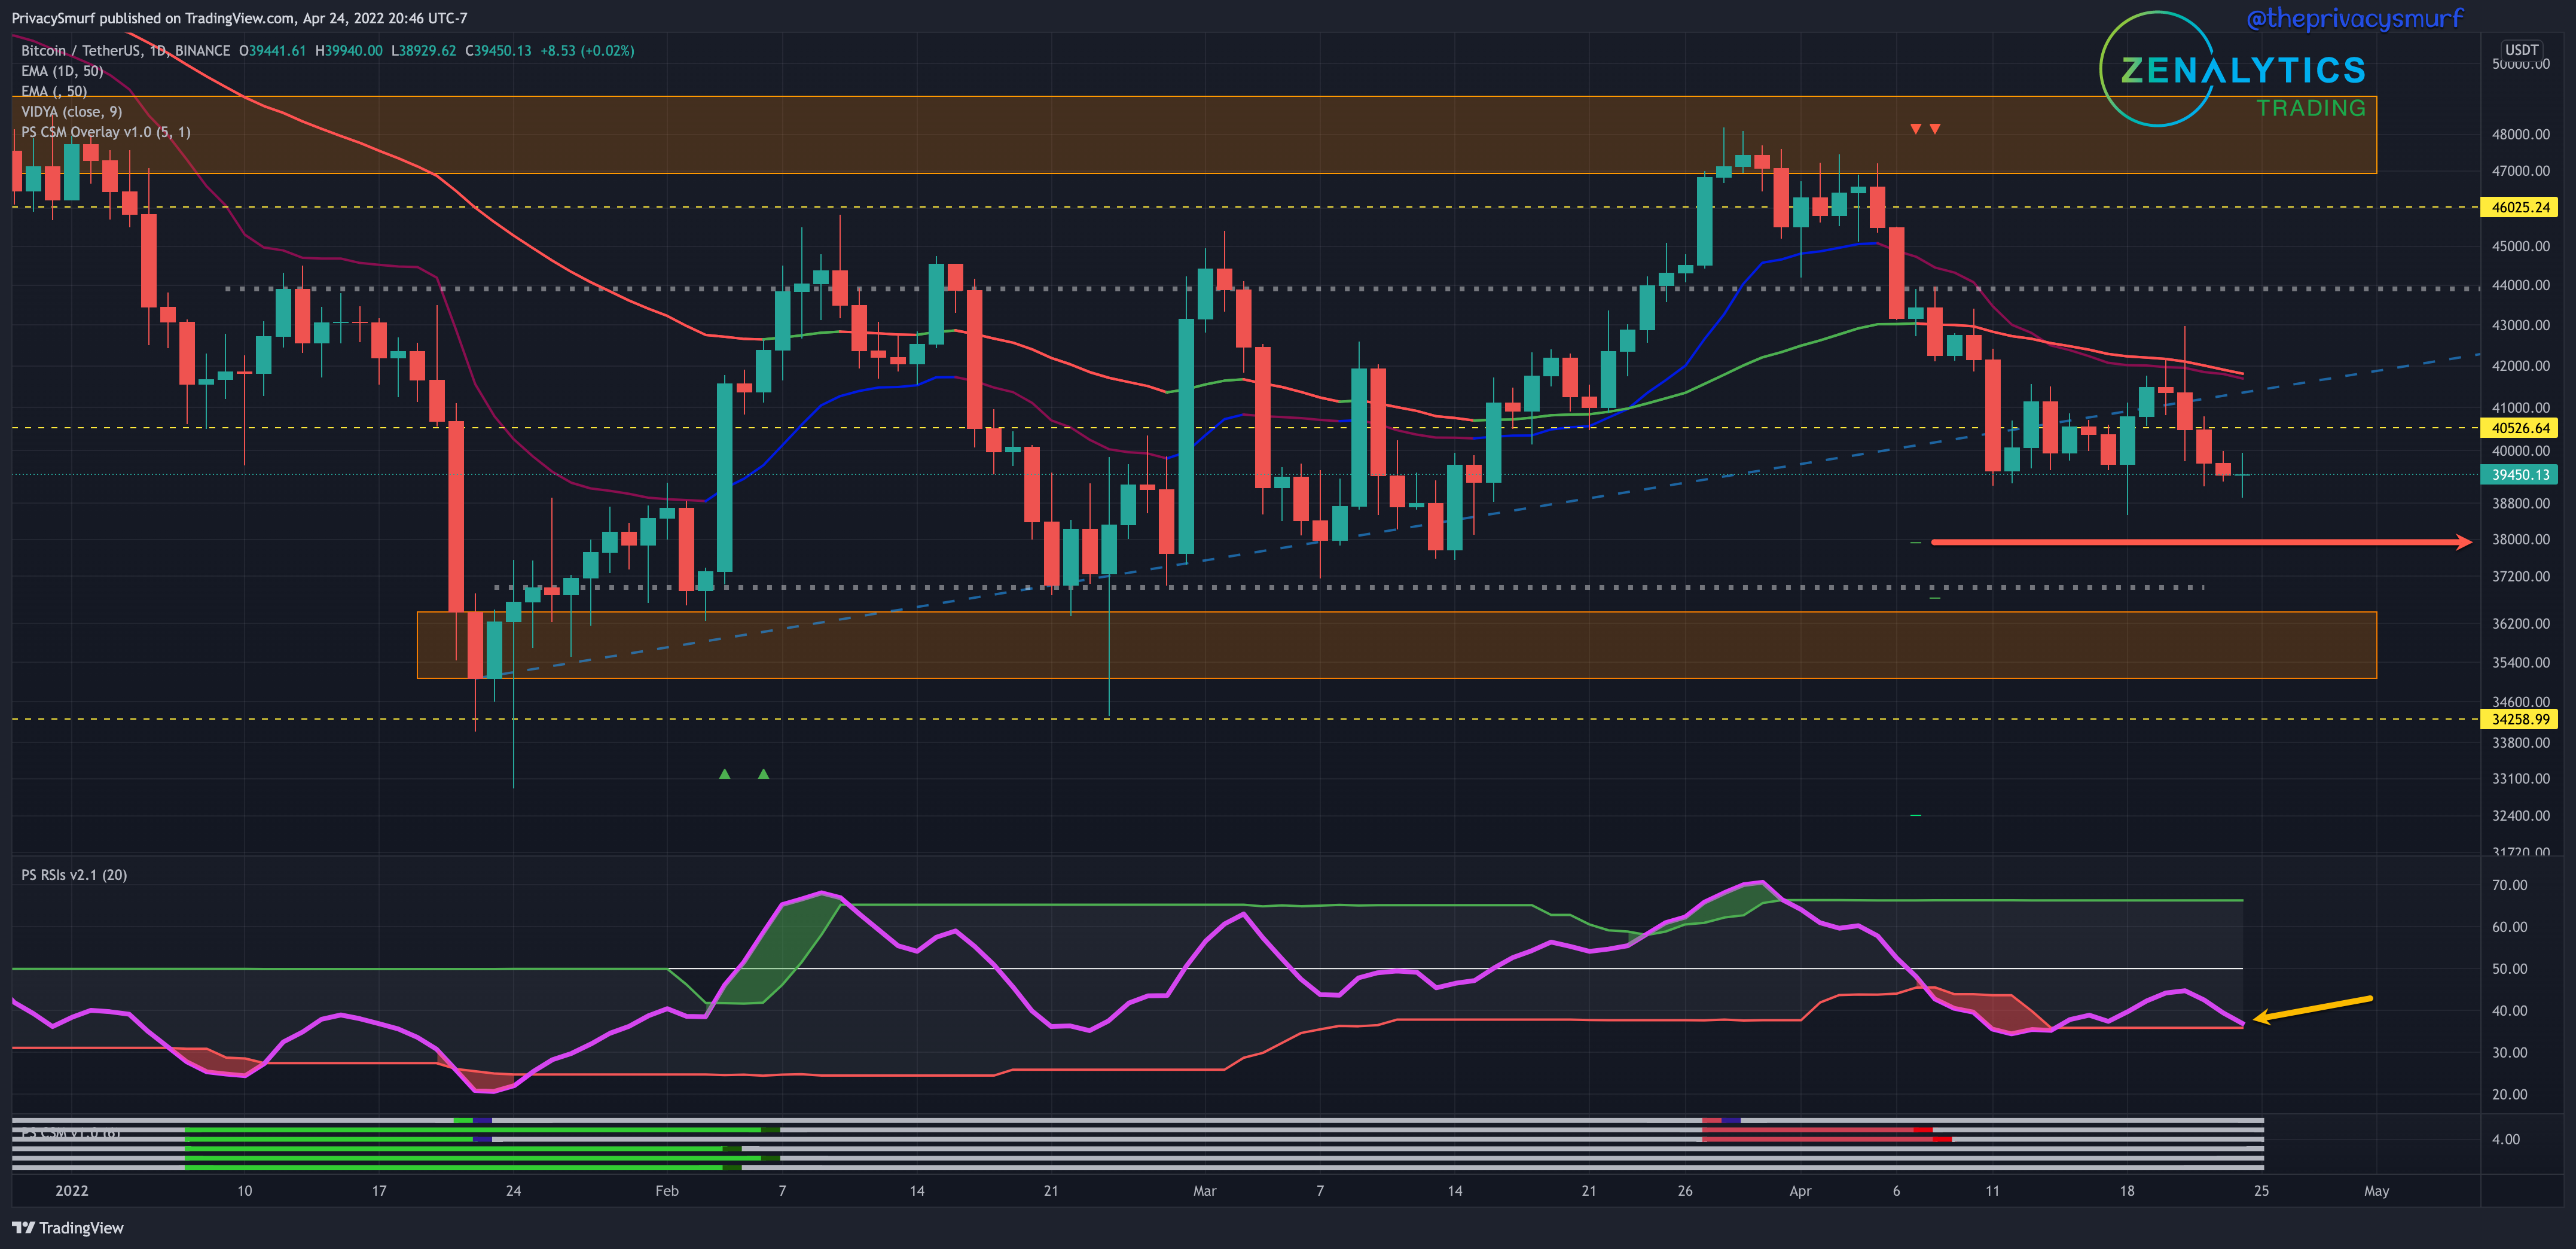
The ascending trendline that price has loosely been respecting in my opinion its validity. This is due to new lower daily closes. The daily trend is bearish at this point. We can revisit last week’s synopsis here as well.
With the RSI trending back towards a downside break of the bottom band (yellow arrow) I’d expect a retracement early in the week. My custom indicator, shown on the bottom of the chart, the Correction Strength Meter (which is private but available upon request and payment) has signaled since April 7th the potential for a bearish retracement with initial targets for a short trade around the $38k price level. At the moment this target is not outside of expectations. The bullish structure was lost at the failure at $41k. I’d put an expected range this week around $37k to $42k.
ETH/BTC Weekly Structure
https://www.tradingview.com/chart/sacHlXOv/
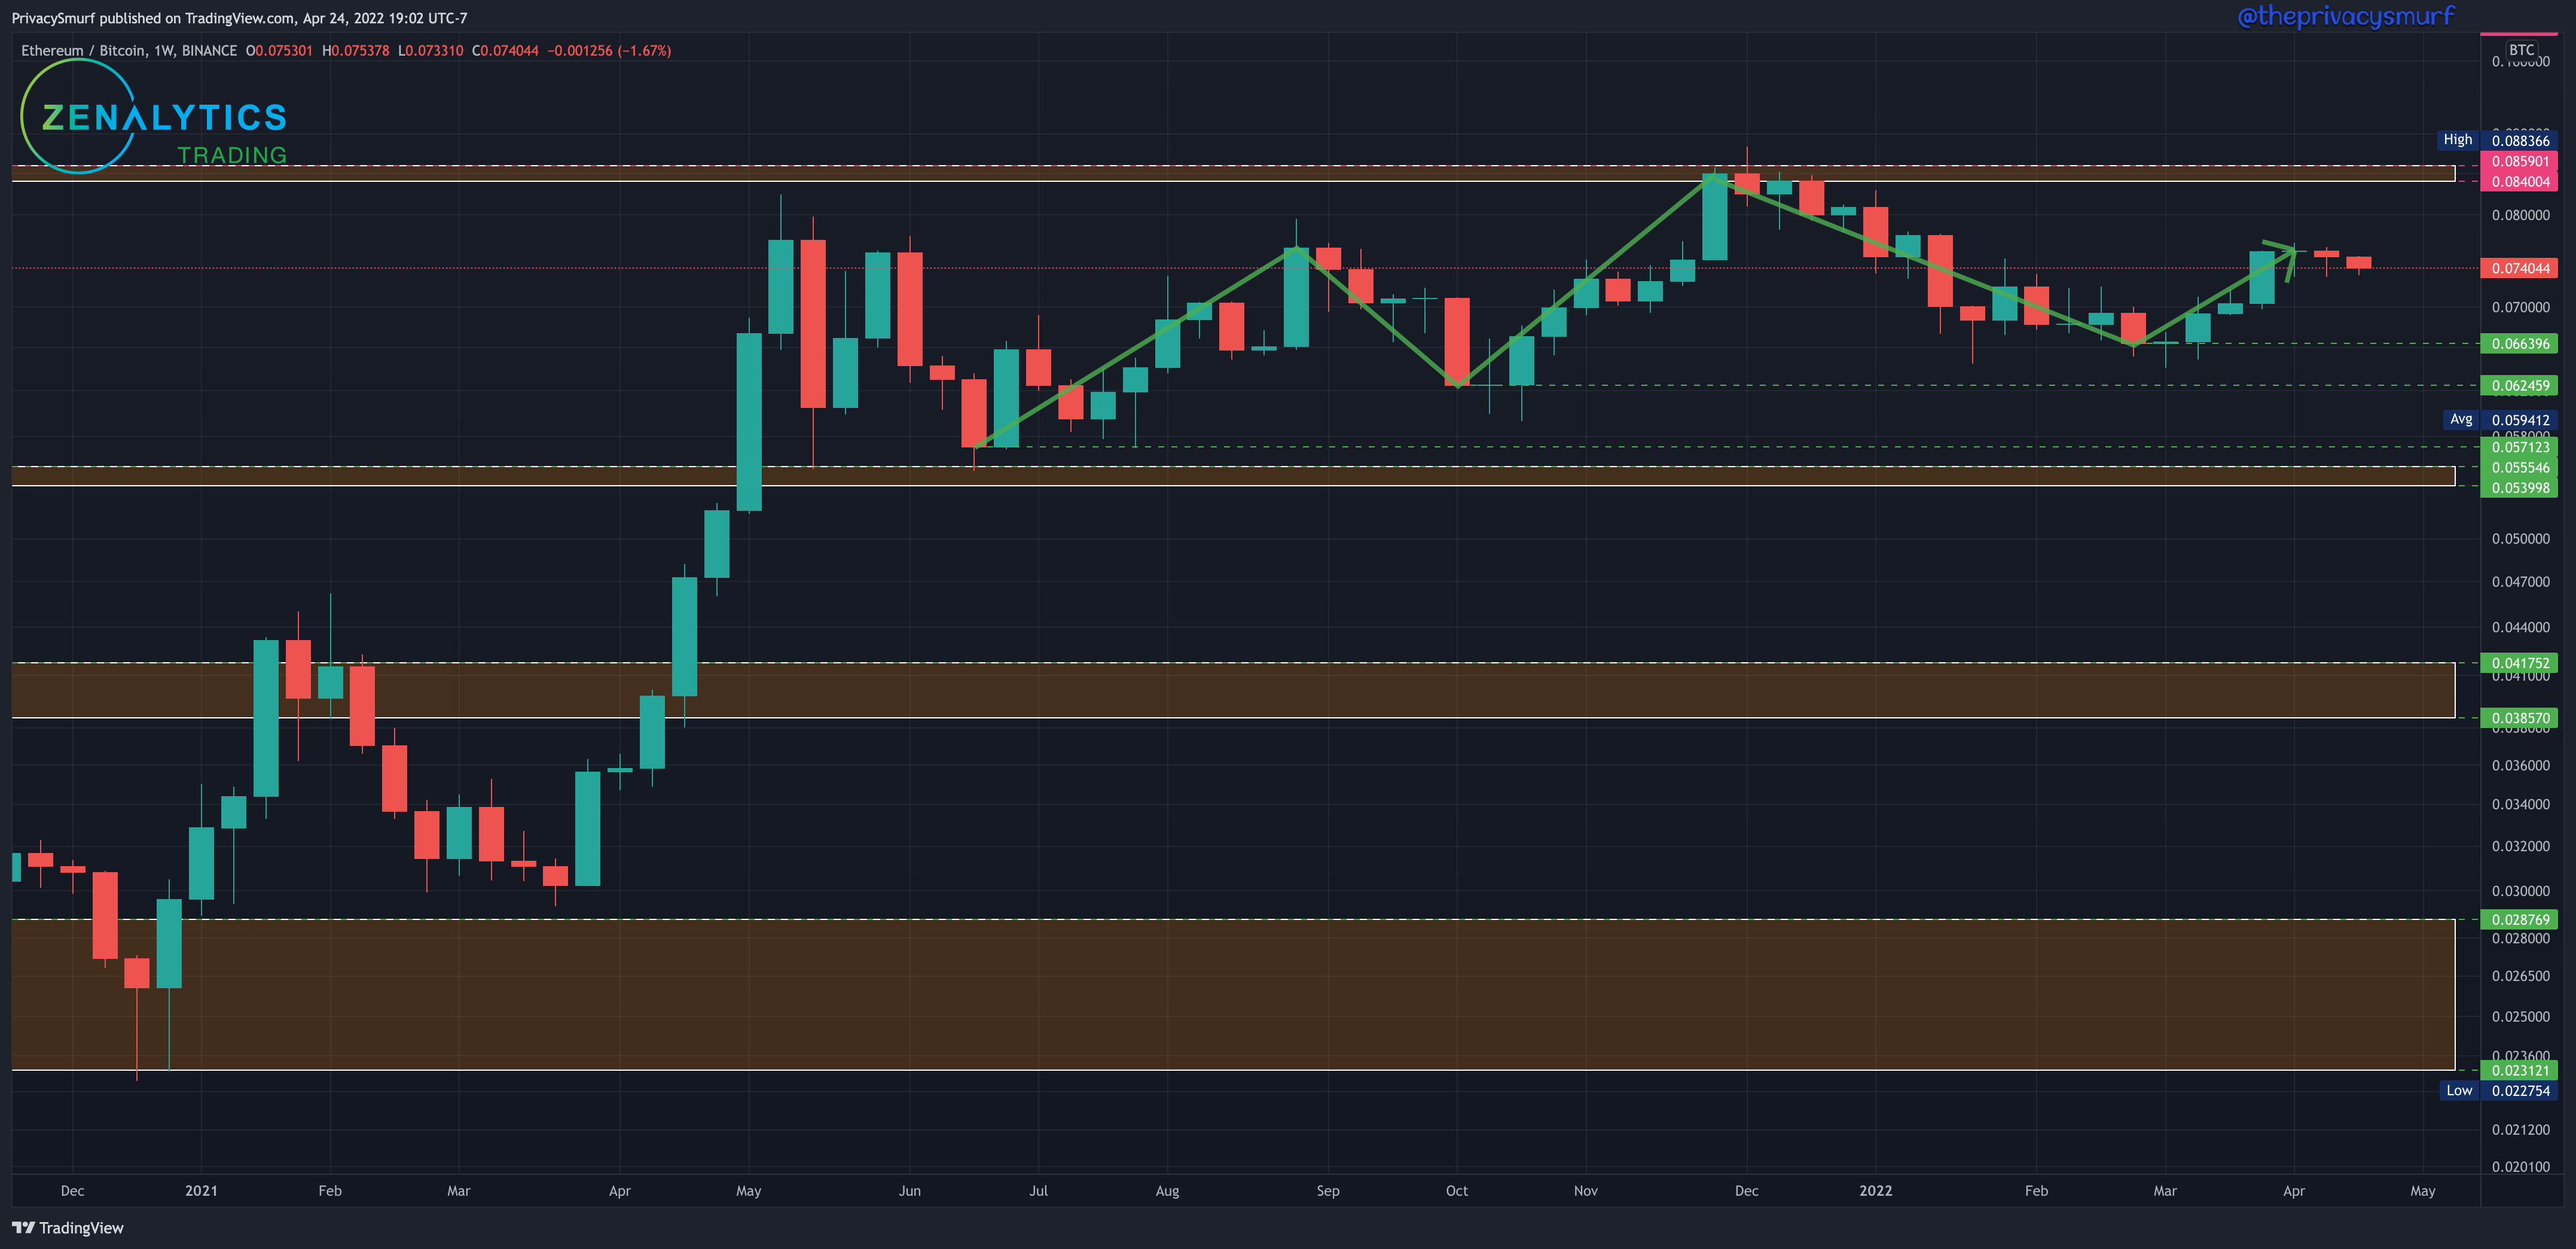
We have another bearish close in the ETH/BTC relationship. With the weekly chart of BTC presenting bearish this relationship will likely follow. There aren’t any moves to be made with this chart on a longer-term scale. The daily chart will give an idea of the potential for another bearish week. A weekly close under 0.066 would transition to consolidation. I’m not expecting this by any means this week.
ETH/BTC Daily Chart
https://www.tradingview.com/chart/gTkSjkj6/
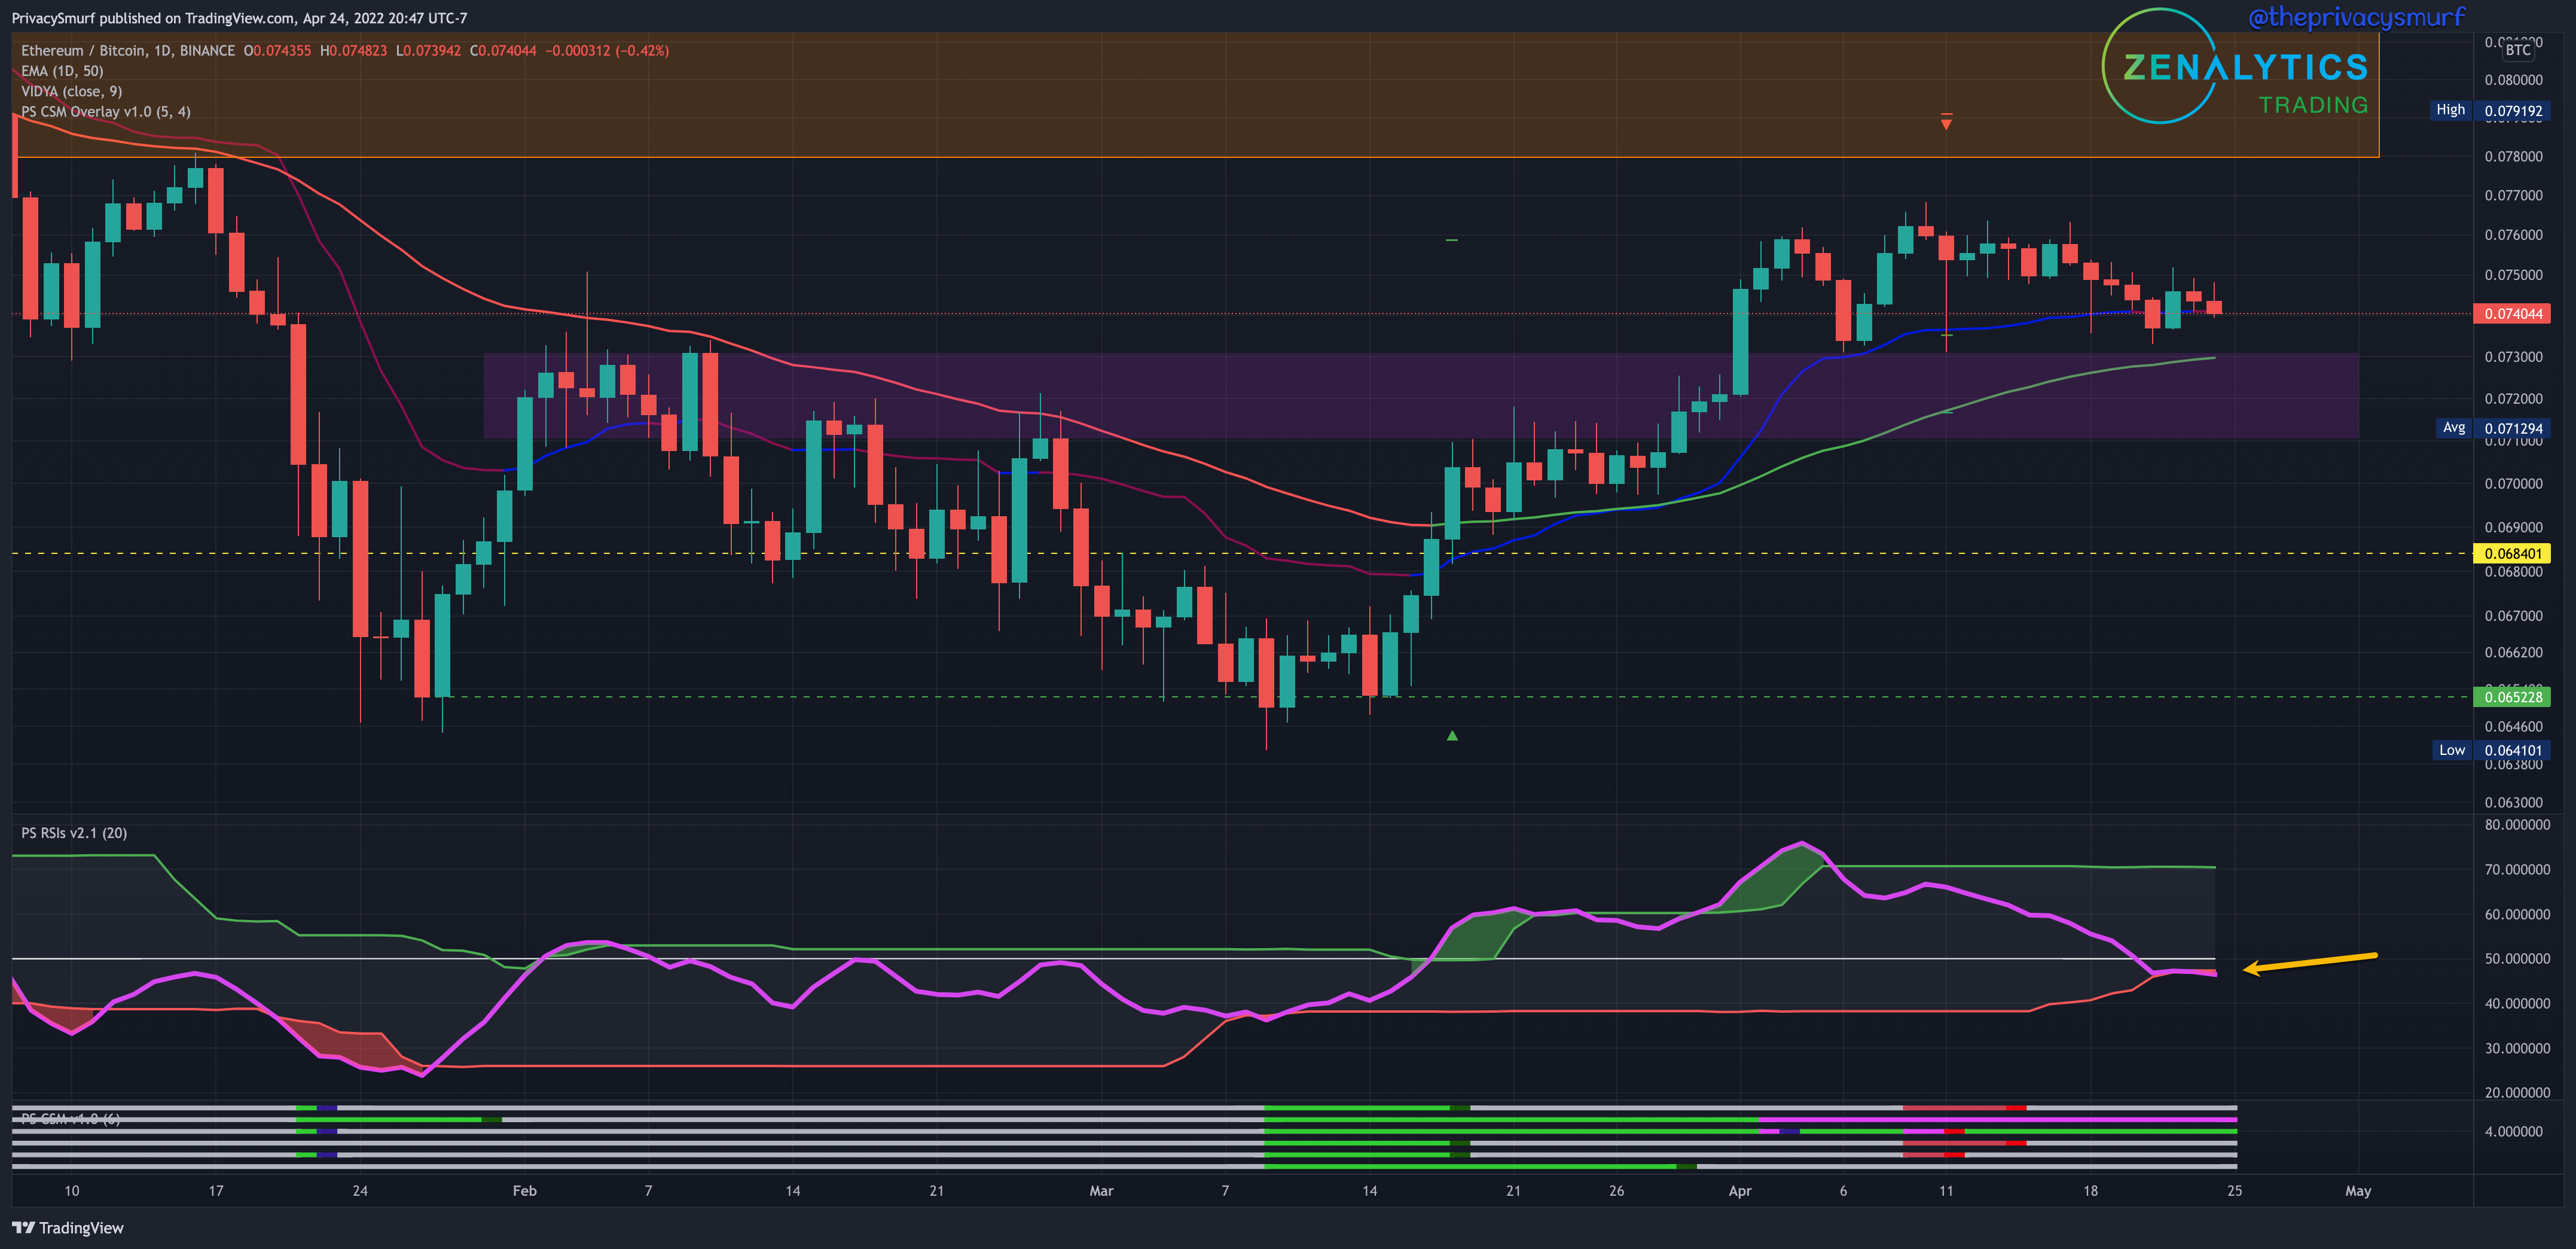
Price action has been trending down this past week. The RSI bottom band has also moved up to meet the price. A downside break of the bottom band would likely be accompanied by prices trading down into the support zone. I’d expect some support to come in at the 50-Day EMA which is currently at 0.073 but I’d be prepared for prices to move down towards the bottom of the zone at 0.071.
ETH/USDT Weekly Structure
https://www.tradingview.com/chart/JPTp0aXw/
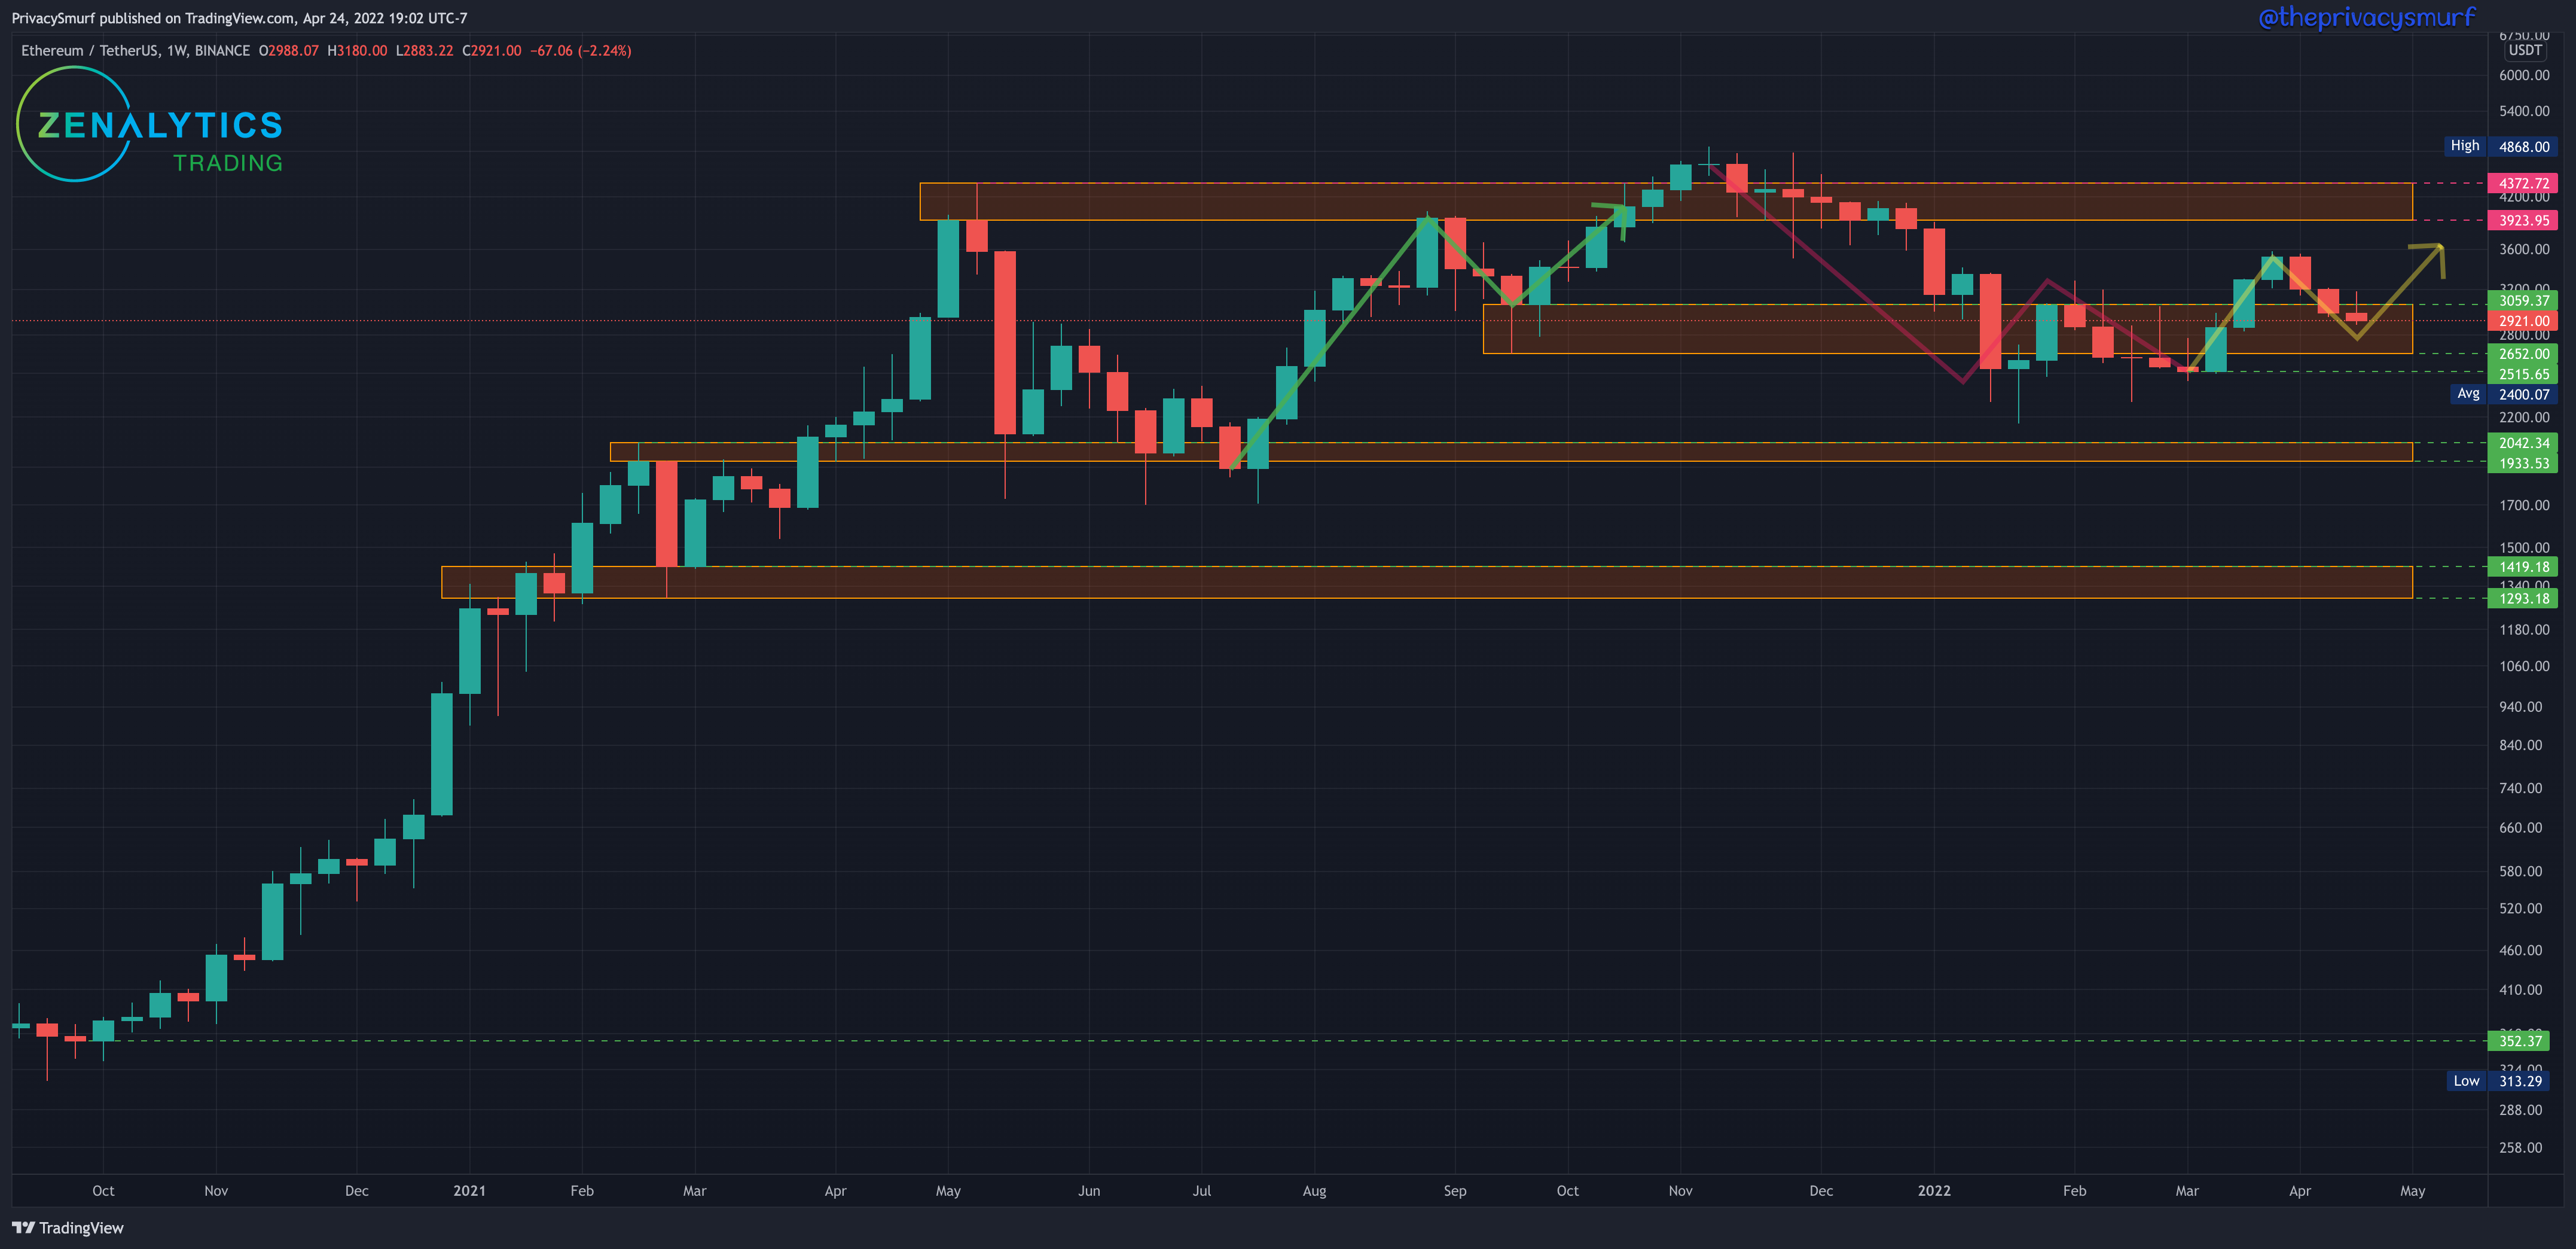
Another bearish week on ETH/USDT. We are still currently trending down to make (hopefully) a higher low. The bullish structure is still maintained unless a weekly close occurs below $2515. Closing this week as a bearish pattern (shooting star candlestick) would suggest a possible bearish price continuation the following week. The daily chart will help determine the likelihood of that.
ETH/USDT Daily Chart
https://www.tradingview.com/chart/xbB6lkZu/
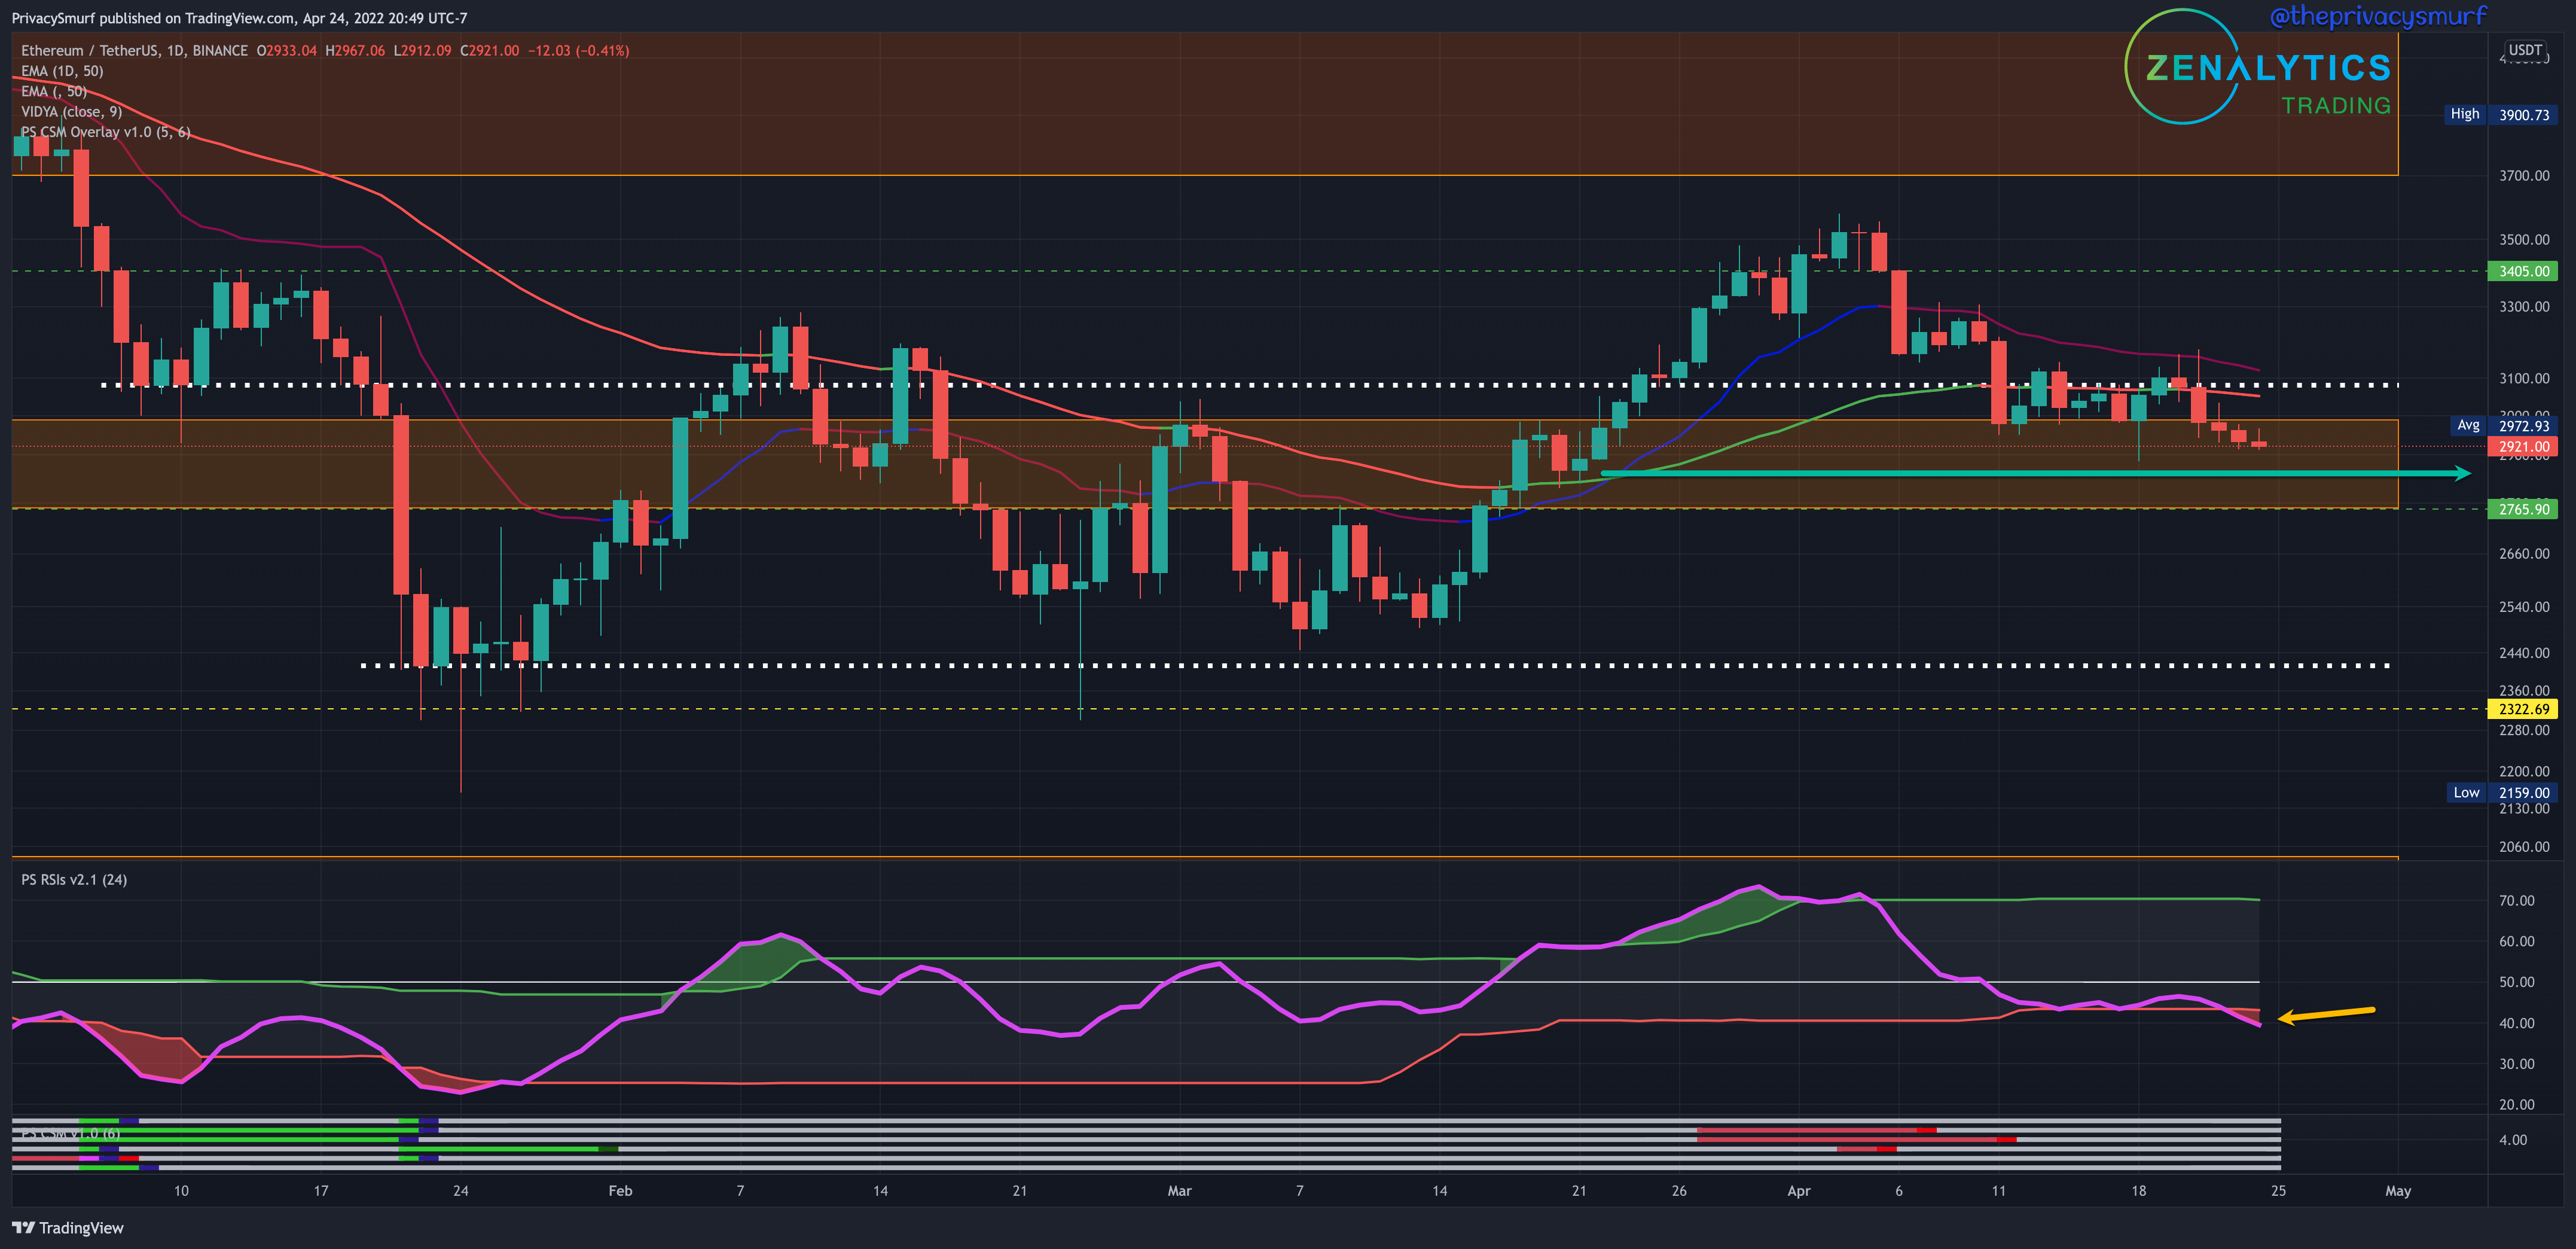
This week broke out of the consolidation pattern at the high side of the range and started trending down. The daily trend will still be bullish until the daily closes plot below the last lowest low close at $2890. With the RSI now trading under the bottom band (yellow arrow) I’d be expecting a bearish price continuation early this week. I’m anticipating a floor around $2700 and a ceiling around $3200 same as last week.
Apparently, I’m being bullied to write a post about multiple timeframe analysis. Look for it Thursday. Get off my back Qball.
:-p
Everyone have a good week.
@theprivacysmurf
Every week I look forward to your AWESOME NEWSLETTERS to be posted. I can’t thank you enough. Thank you! Can you also send me a payment form for your indicator? Enjoy your day Terry!
Great music to go hand in hand with a great read. I'm very interested in your CSM indicator. Please send me a payment form. Thanks!