

Sunday Synopsis #39: Everything is new
Sunday Synopsis #39: Everything is new
Change has been released.

Well, we are out of the range, finally.
I dropped a brief tweet with some initial thoughts about the cycle data I posted early last month.


I’ll add more to those thoughts here this week. Promise I have no trips coming up.
:-p
BTC/USDT Weekly Structure
https://www.tradingview.com/chart/4v8qizyI/
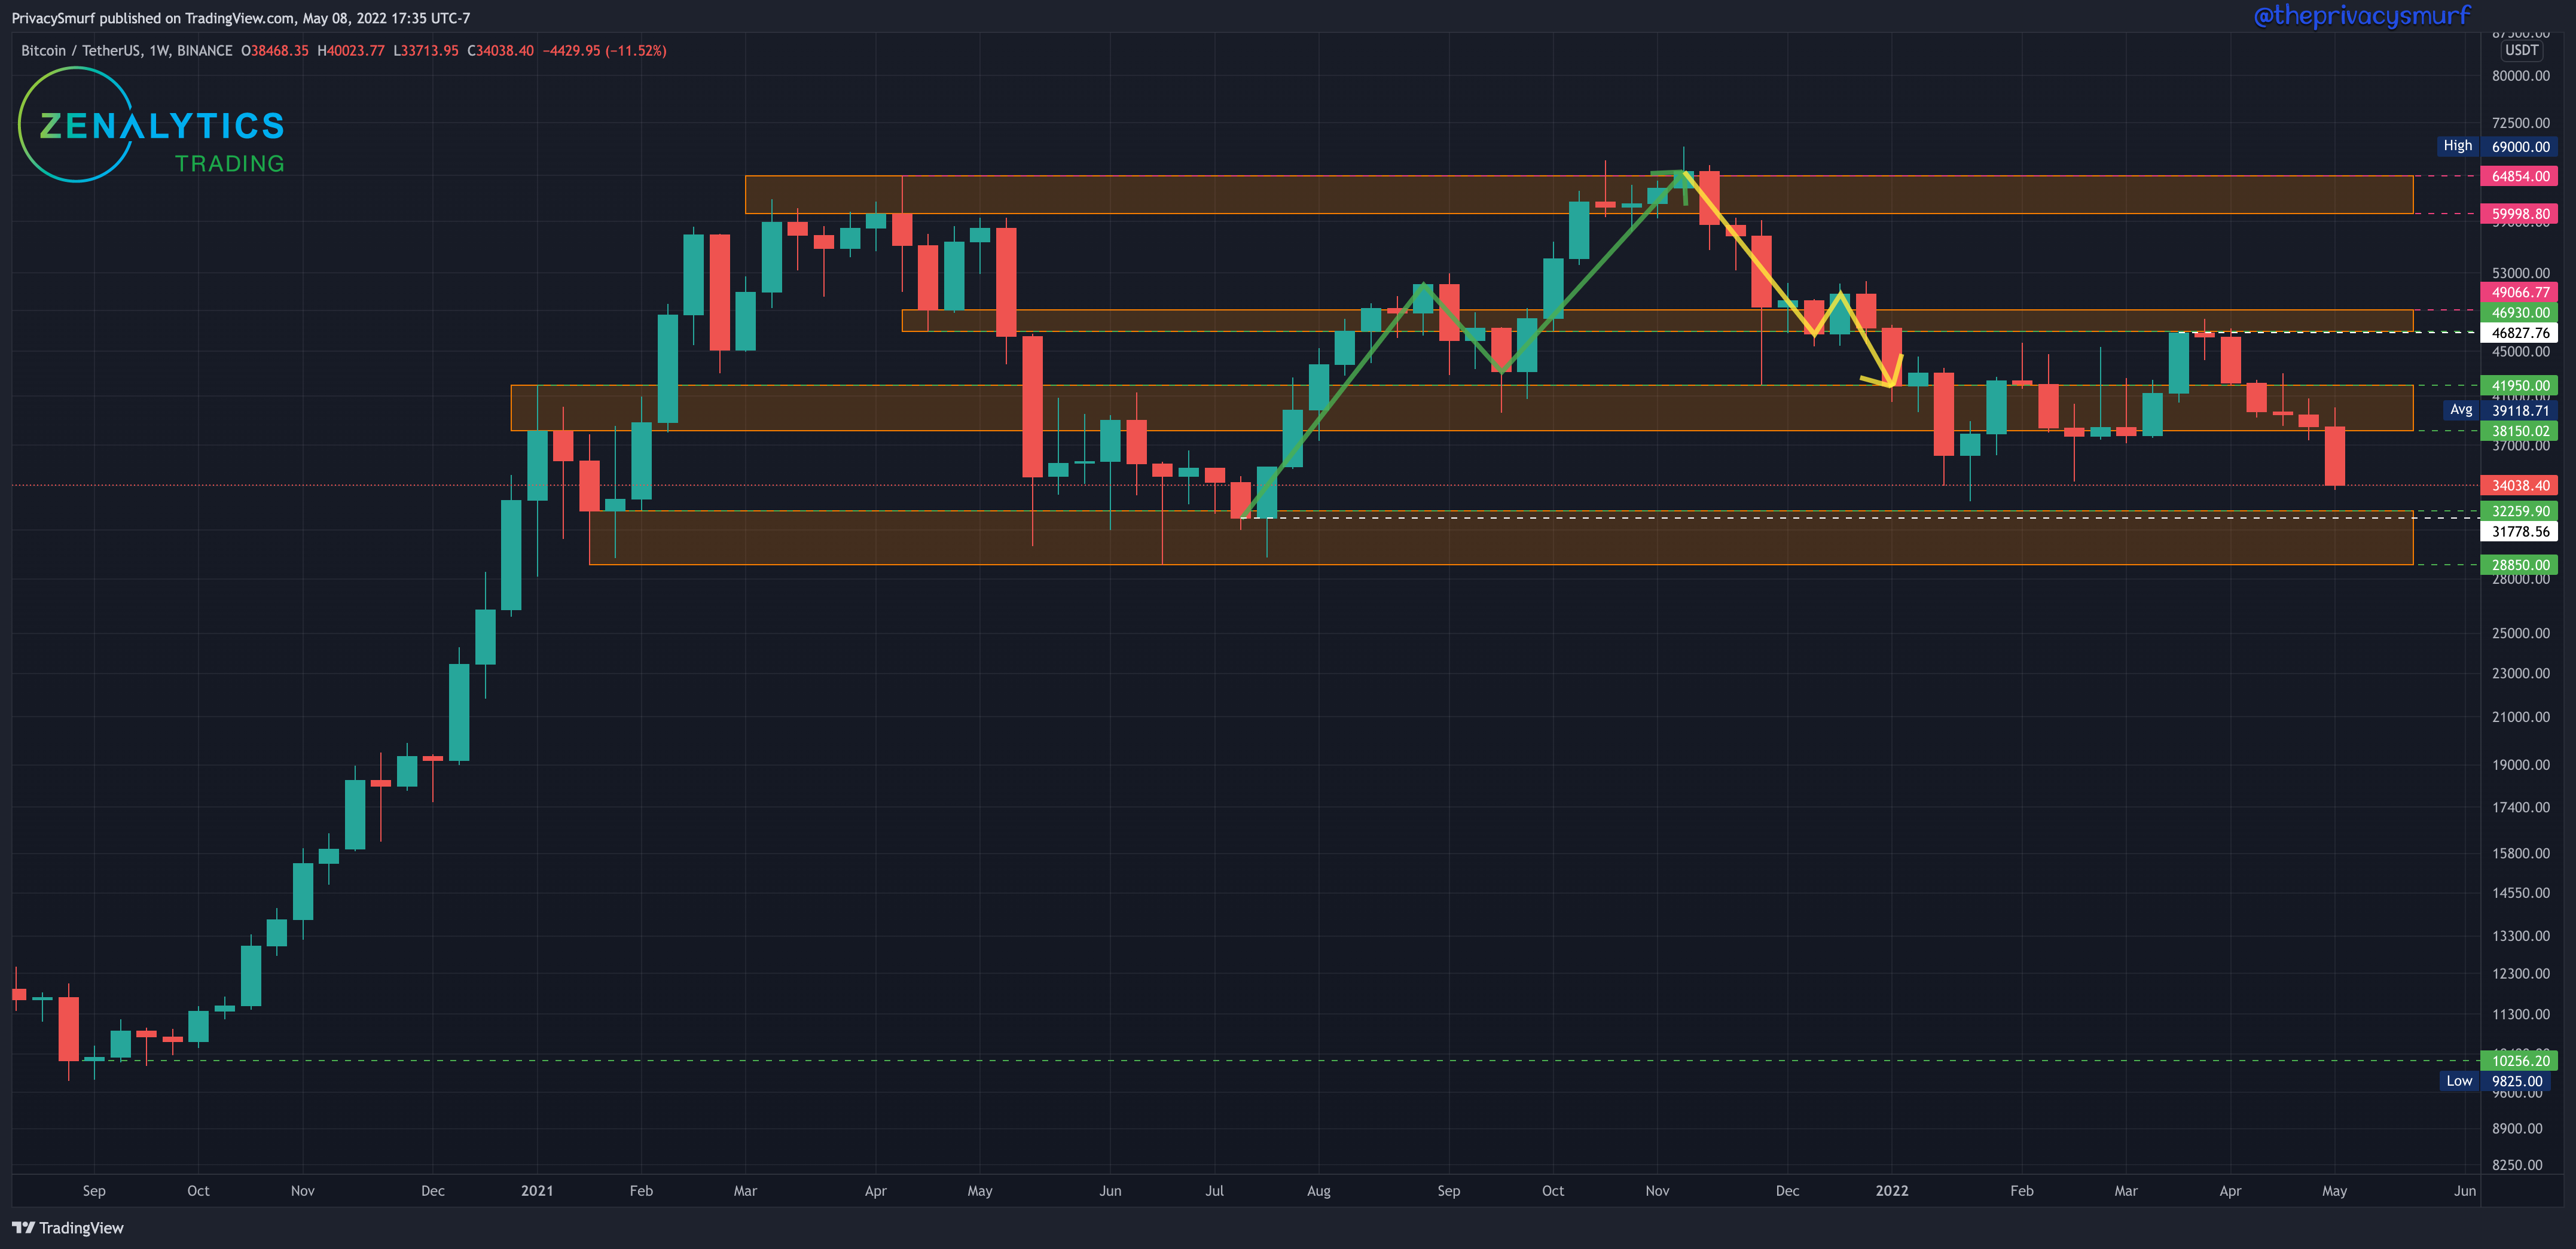
The past week closed below the support zone at $38k and lower than the last lowest low close at $36.2k back in January. We are now at the lowest weekly close of the year again. This new low close puts the trend in a consolidation phase since BTC put in higher high closes in March and now new lower low closes, I’d expect a bearish bias but ranging between the low support and the zone that just failed.
I’d transition the market structure classification to bearish with a weekly close below $31.7, the lowest close in July 2021. I’d transition the market structure classification to bullish with a weekly close above $46.8k, the most recent high close in March. I’d add to long-term positions in the support zone ONE time as prices trades under 32k but wait for some daily price action to show bullishness before adding anymore because closing below the support zone opens the door for much lower prices.
BTC/USDT Daily Chart
https://www.tradingview.com/chart/jjSdFW4b/
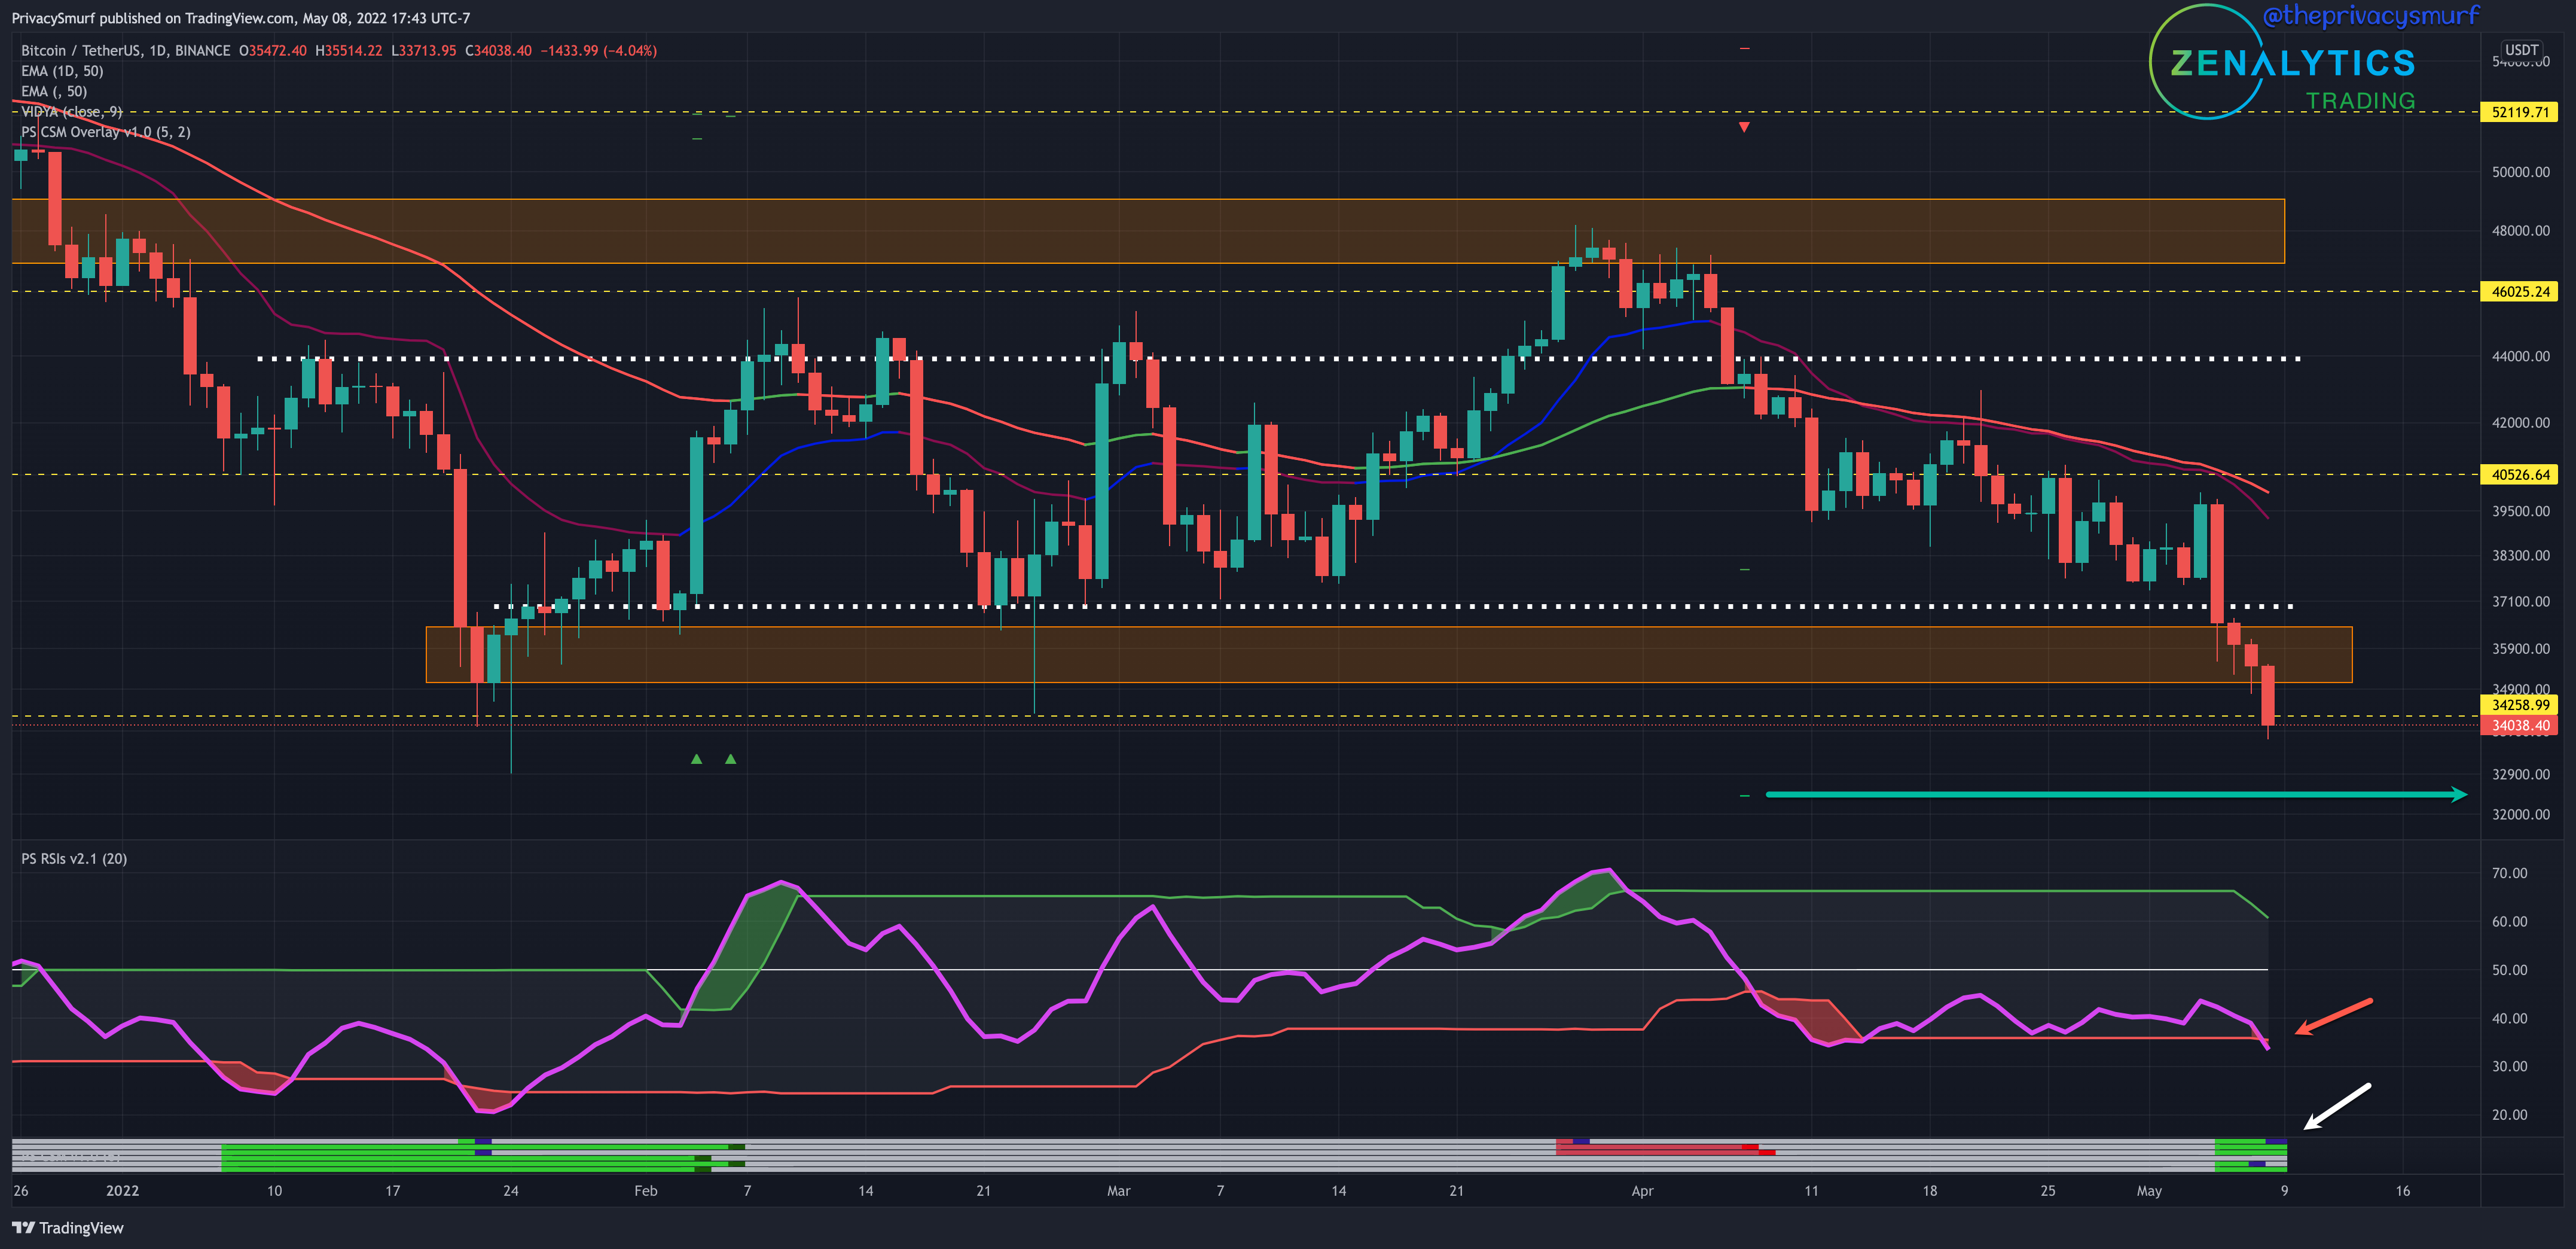
The final day of the week included a hard bearish push breaking below our lowest daily close this year and an older support waaaaay back from Jan 2021 which was the first retracement of +15% looking at closes since the start of the covid rally in March 2020. Not a great look. In April, the bearish trade signal from the Correction Strength Meter (my custom indicator at the bottom of the chart, which is private but available upon request) is on track to hit the second bearish profit target at $32.4k (green horizontal arrow). The RSI is trending down below the adaptive bottom band suggesting bearish price continuation (red arrow). The CSM also is showing blue dots on the green lines which indicates invalidation of bullish divergences (white arrow). Oscillators are all setting new lows in line with new lows in price. This also suggests bearish price continuation. I’d put some possible supports at $33k and $31.6k. I can probably tighten up the trading range by the Wednesday Update but a safe buffer IMO would be a new trading range of $32k to $37k.
ETH/BTC Weekly Structure
https://www.tradingview.com/chart/sacHlXOv/
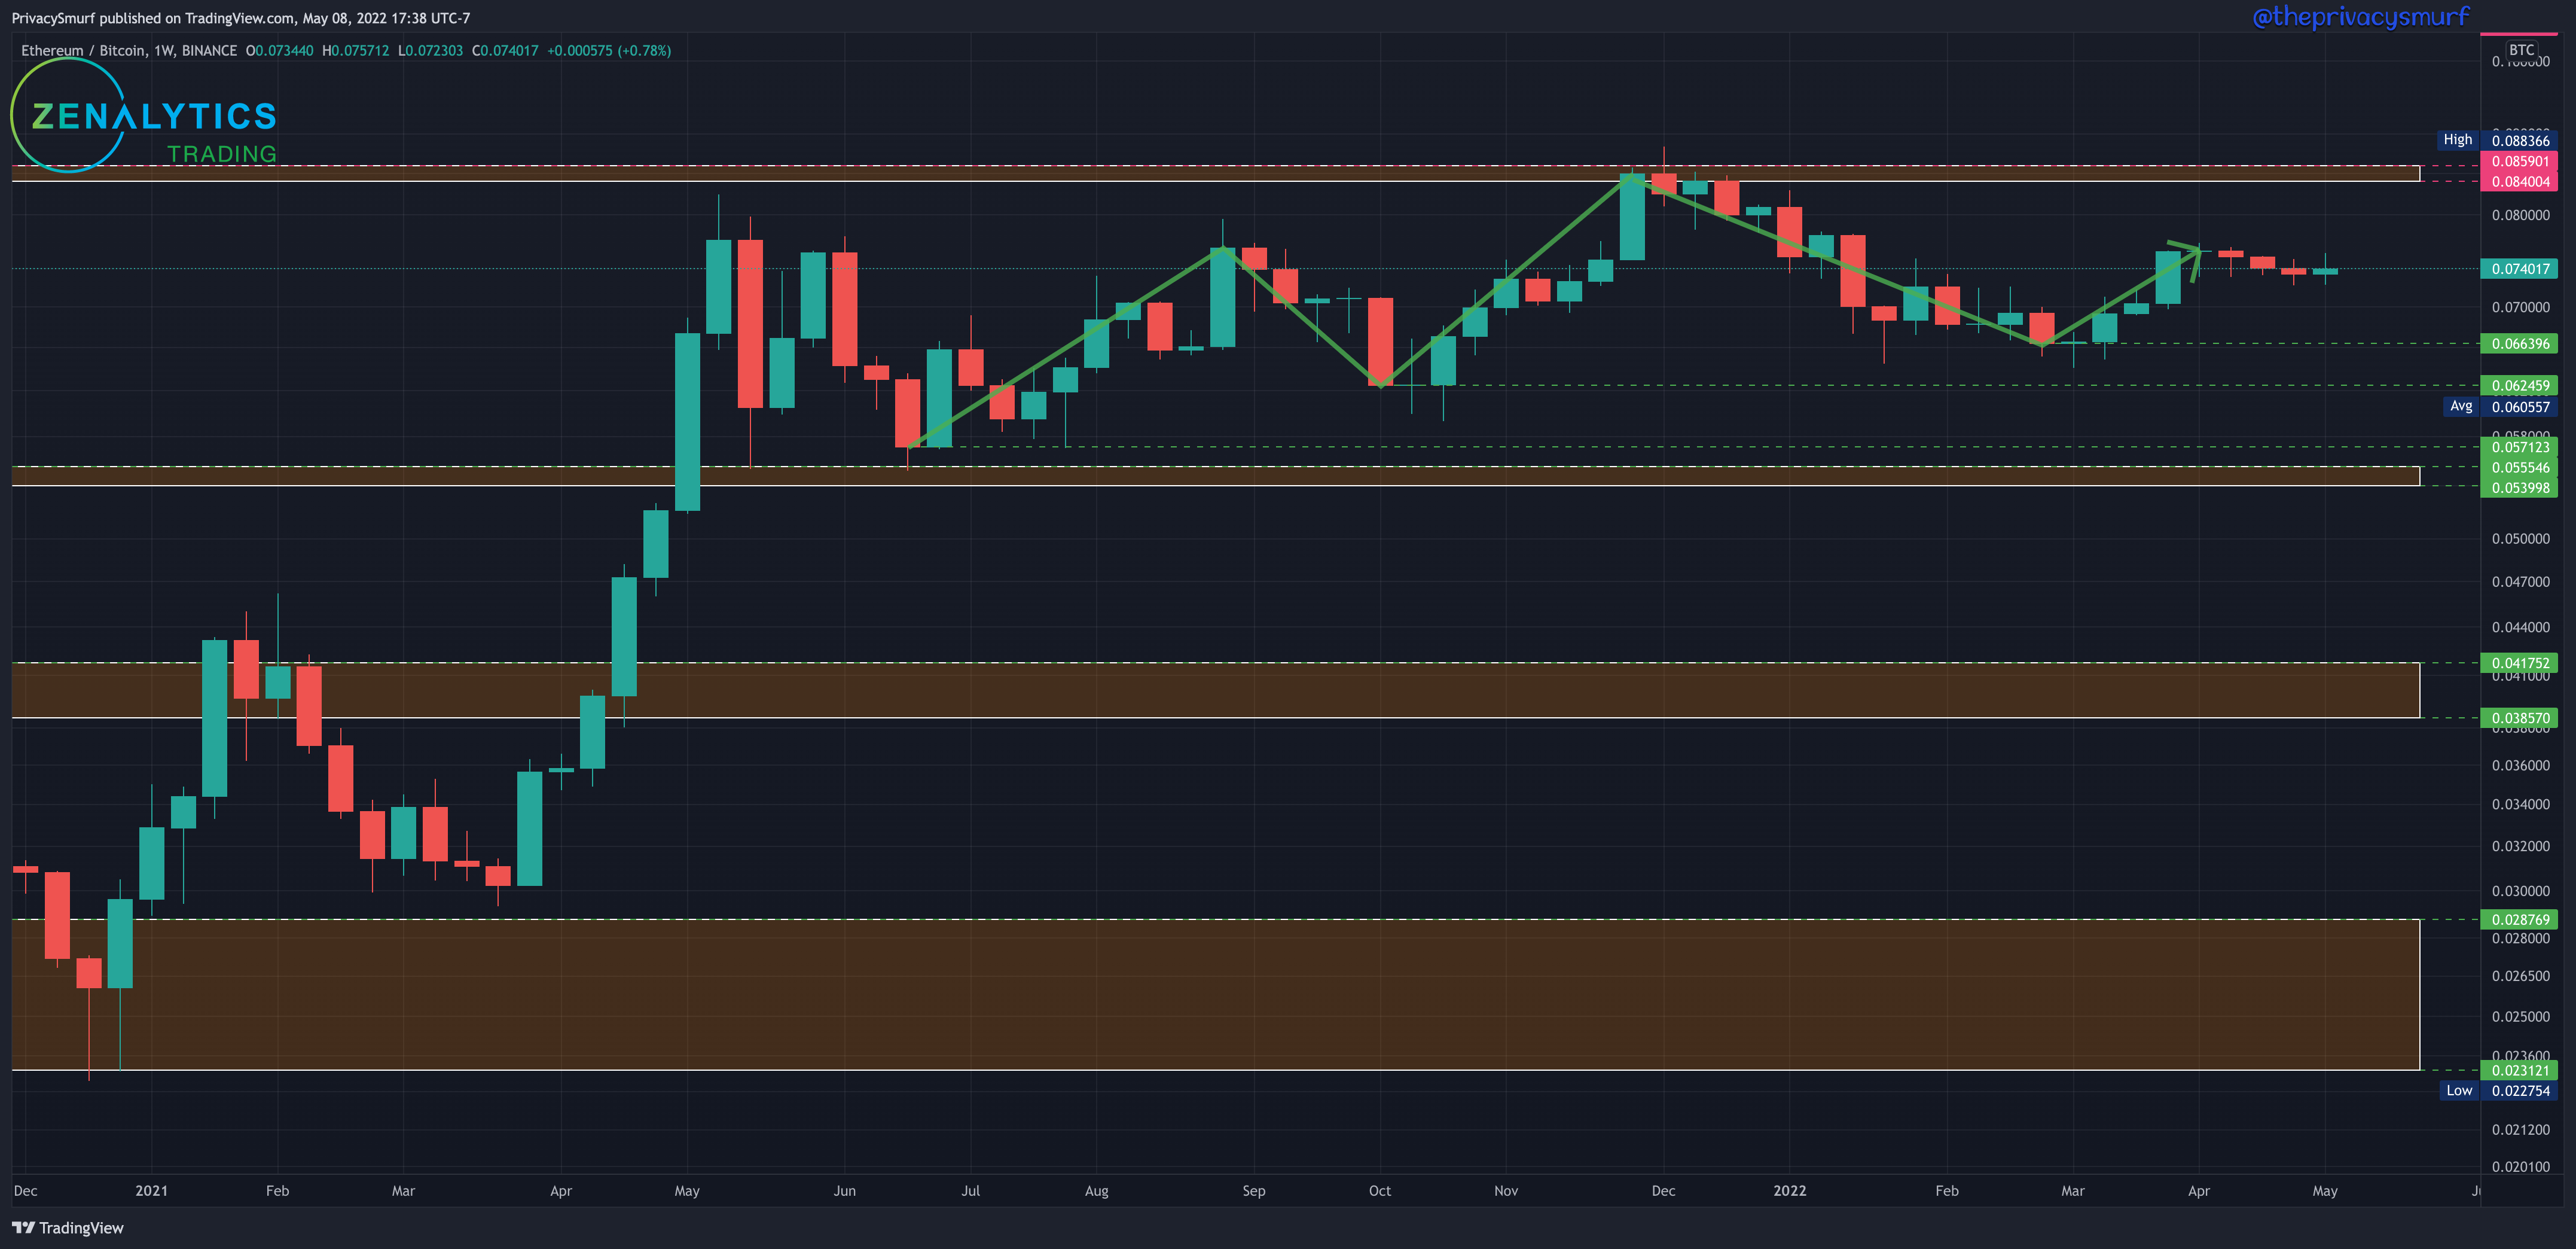
We have a bullish close in the ETH/BTC relationship surprisingly. There aren’t any moves to be made with this chart on a longer-term scale since this value relationship is in a tight range for the past month. A weekly close under 0.066 would transition to consolidation. I’m not expecting this by any means this week.
ETH/BTC Daily Chart
https://www.tradingview.com/chart/gTkSjkj6/
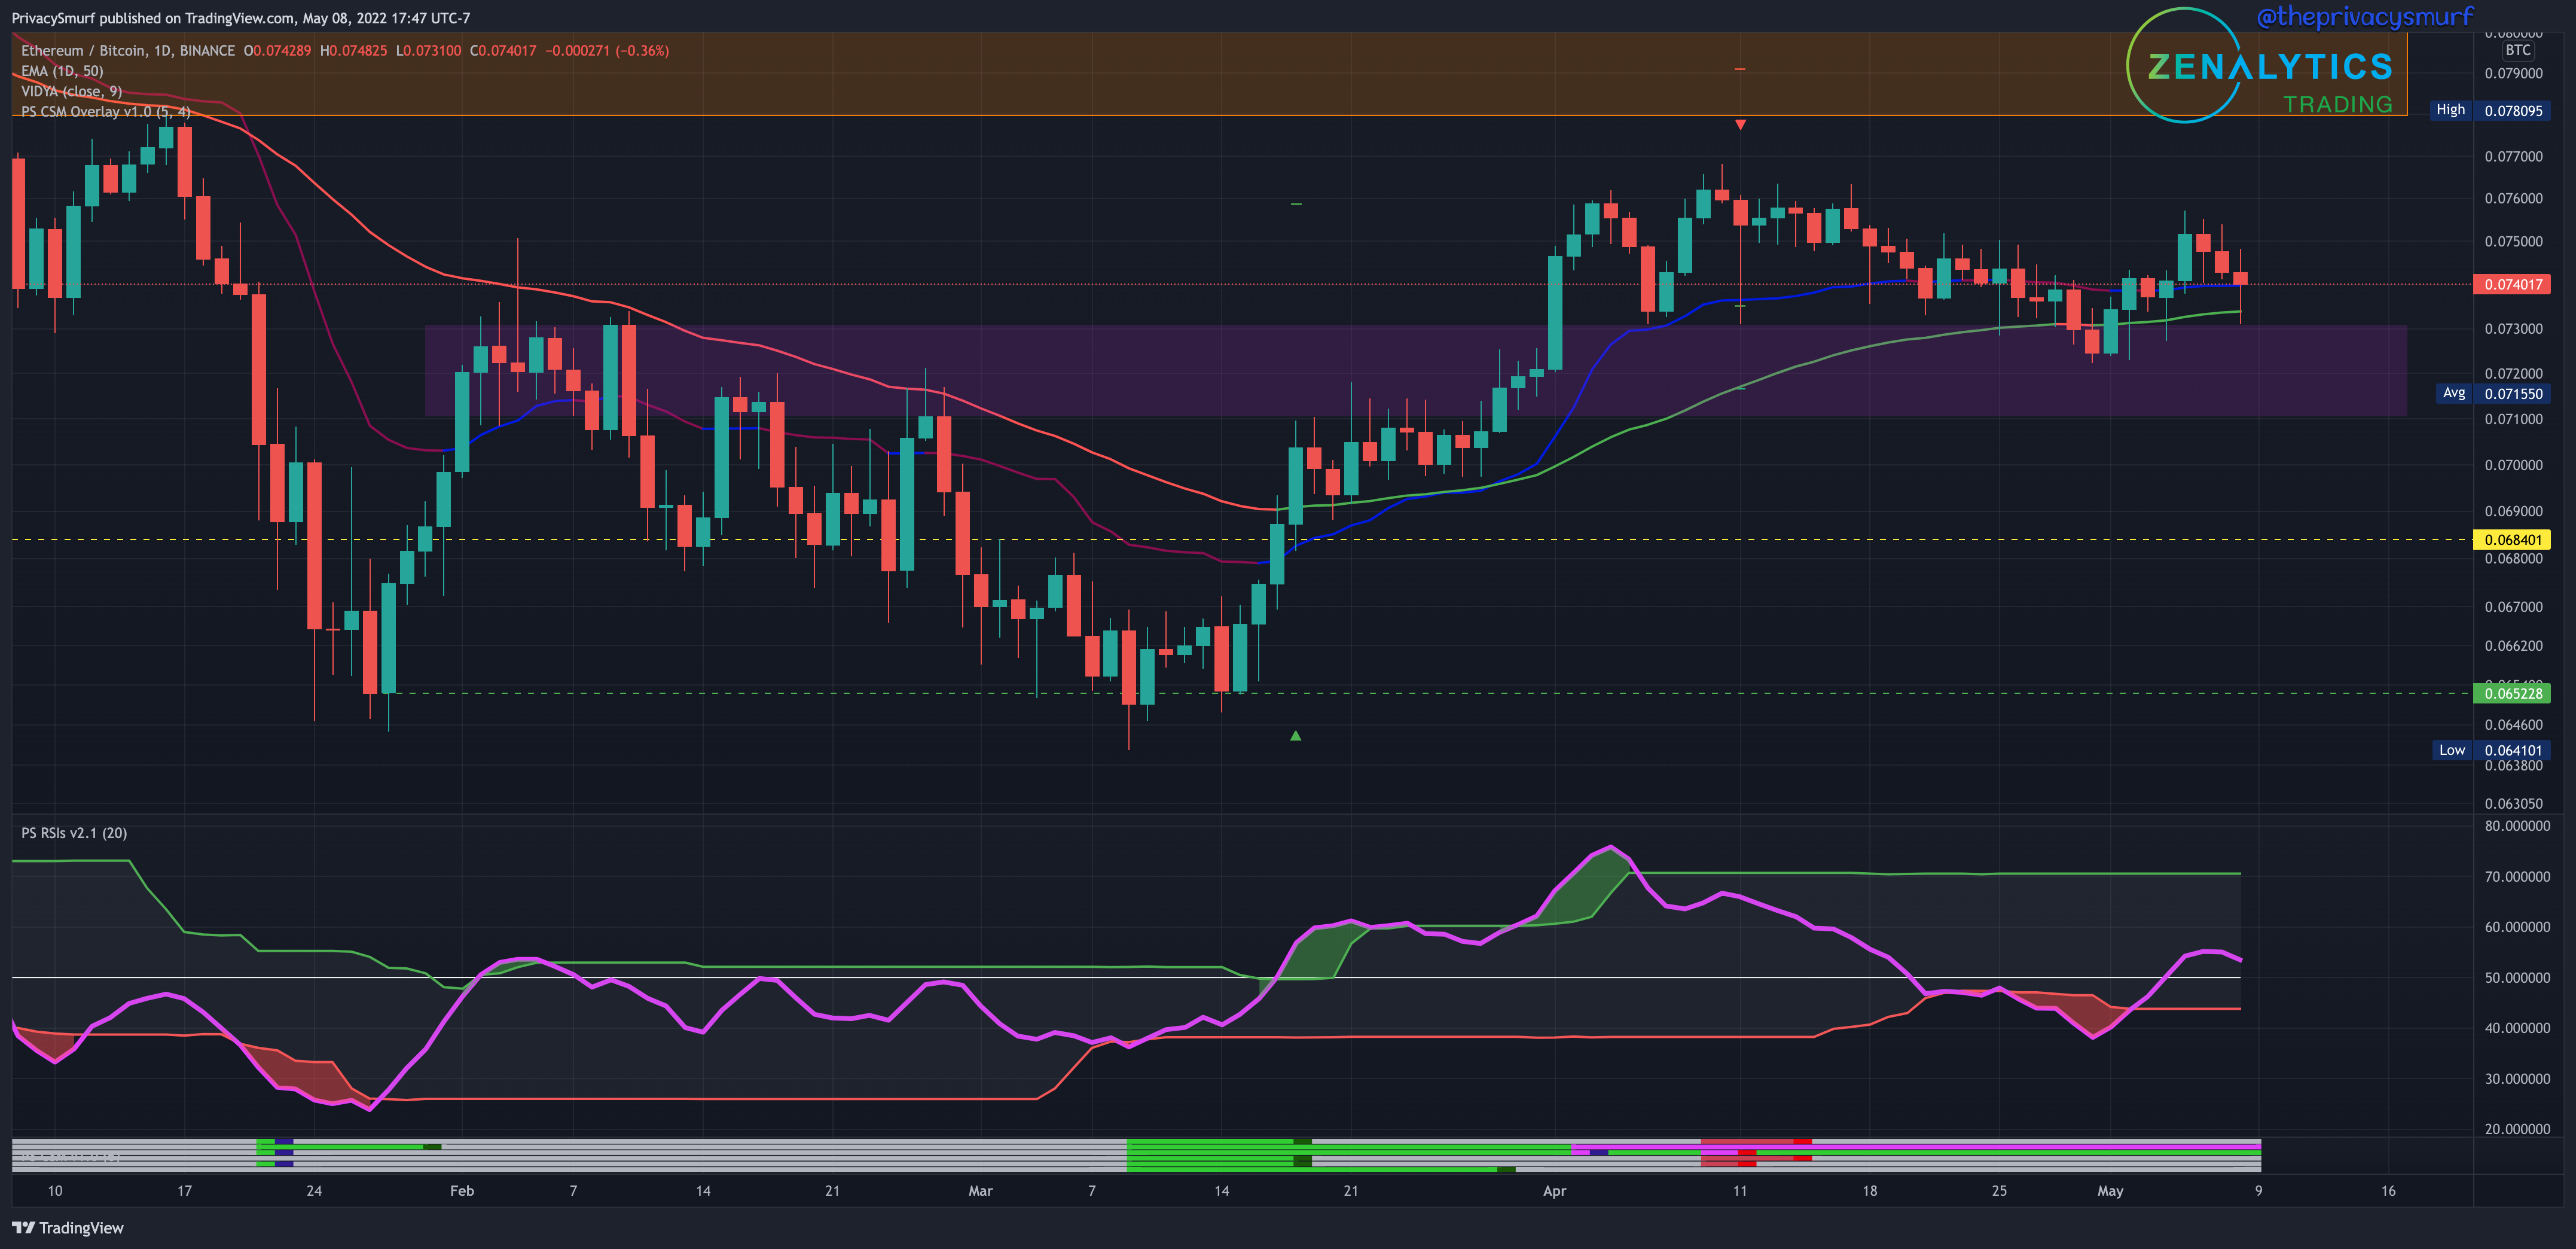
Price action made a slight bullish return this past week as posted on Wednesday. With the RSI back inside the adaptive bands and trending towards the midline in line with price, I’d expect a support test and possible continuation of the consolidation with a slight bearish bias as the price has set a lower high under 0.076 and pivoted lower. I’m still expecting consolidation between 0.072 and 0.076 but a daily closer under 0.072 would transition the chart to bearish and the lower parts of the support zone will likely be tested.
ETH/USDT Weekly Structure
https://www.tradingview.com/chart/JPTp0aXw/
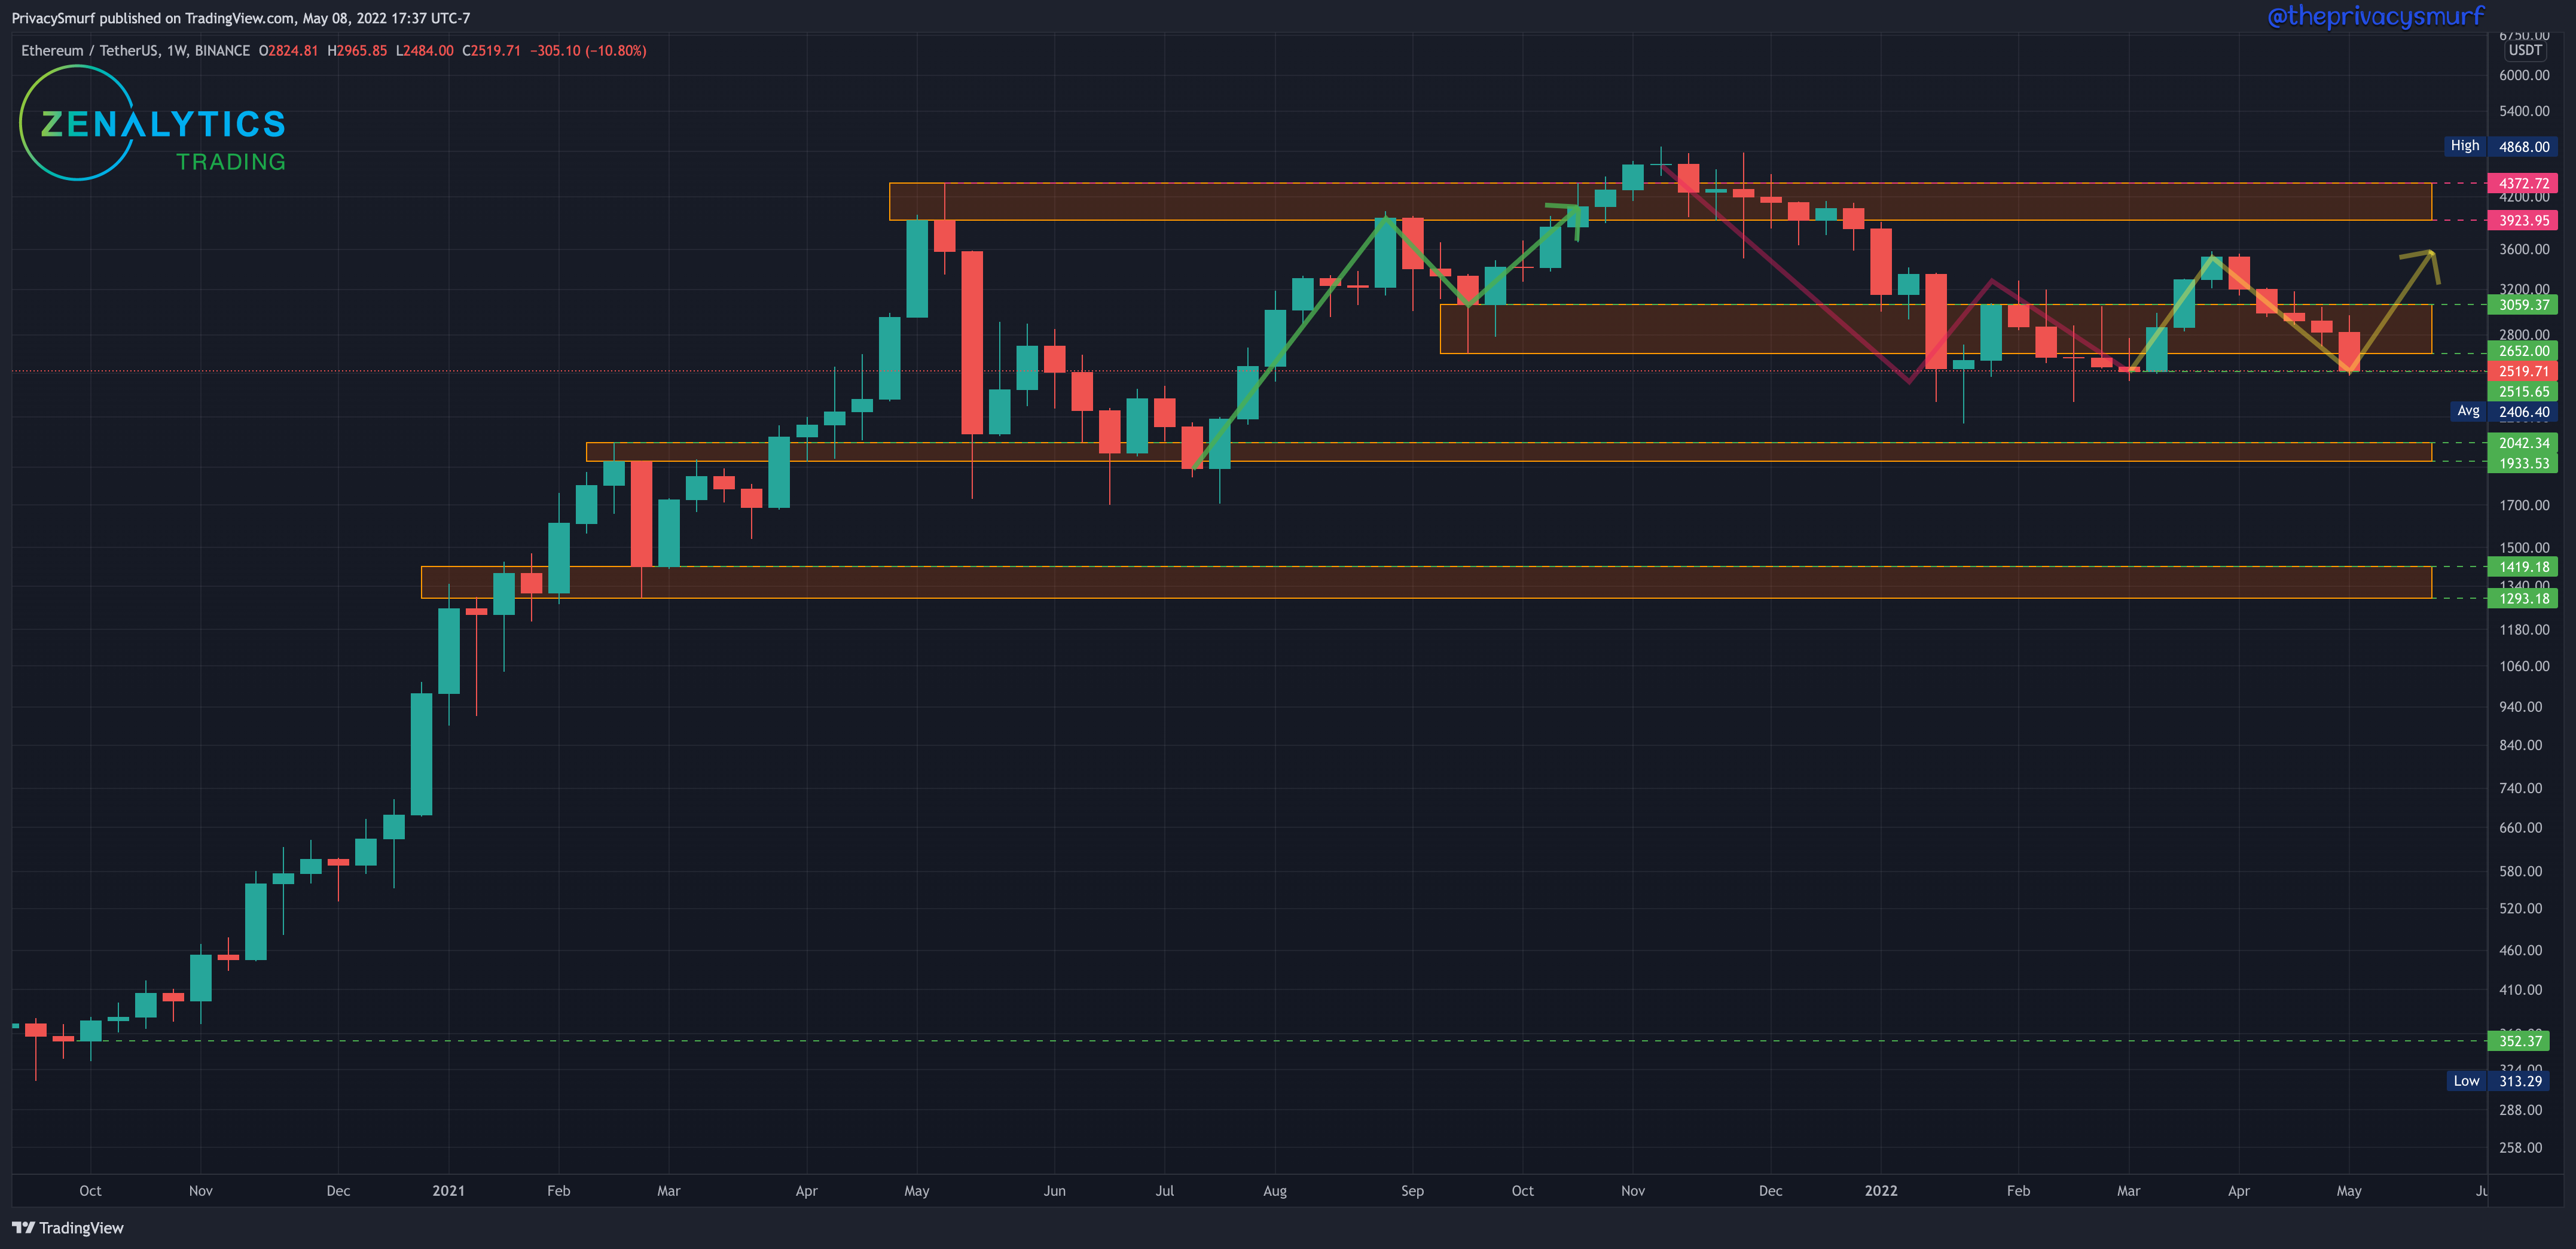
Another bearish week on ETH/USDT but a lower low close was NARROWLY avoided staying above $2515. The bullish structure is still maintained unless a weekly close occurs below that this week. There’s not much that would suggest a break from this bearish price continuation so a look at the daily chart will help determine the likelihood of that.
ETH/USDT Daily Chart
https://www.tradingview.com/chart/xbB6lkZu/
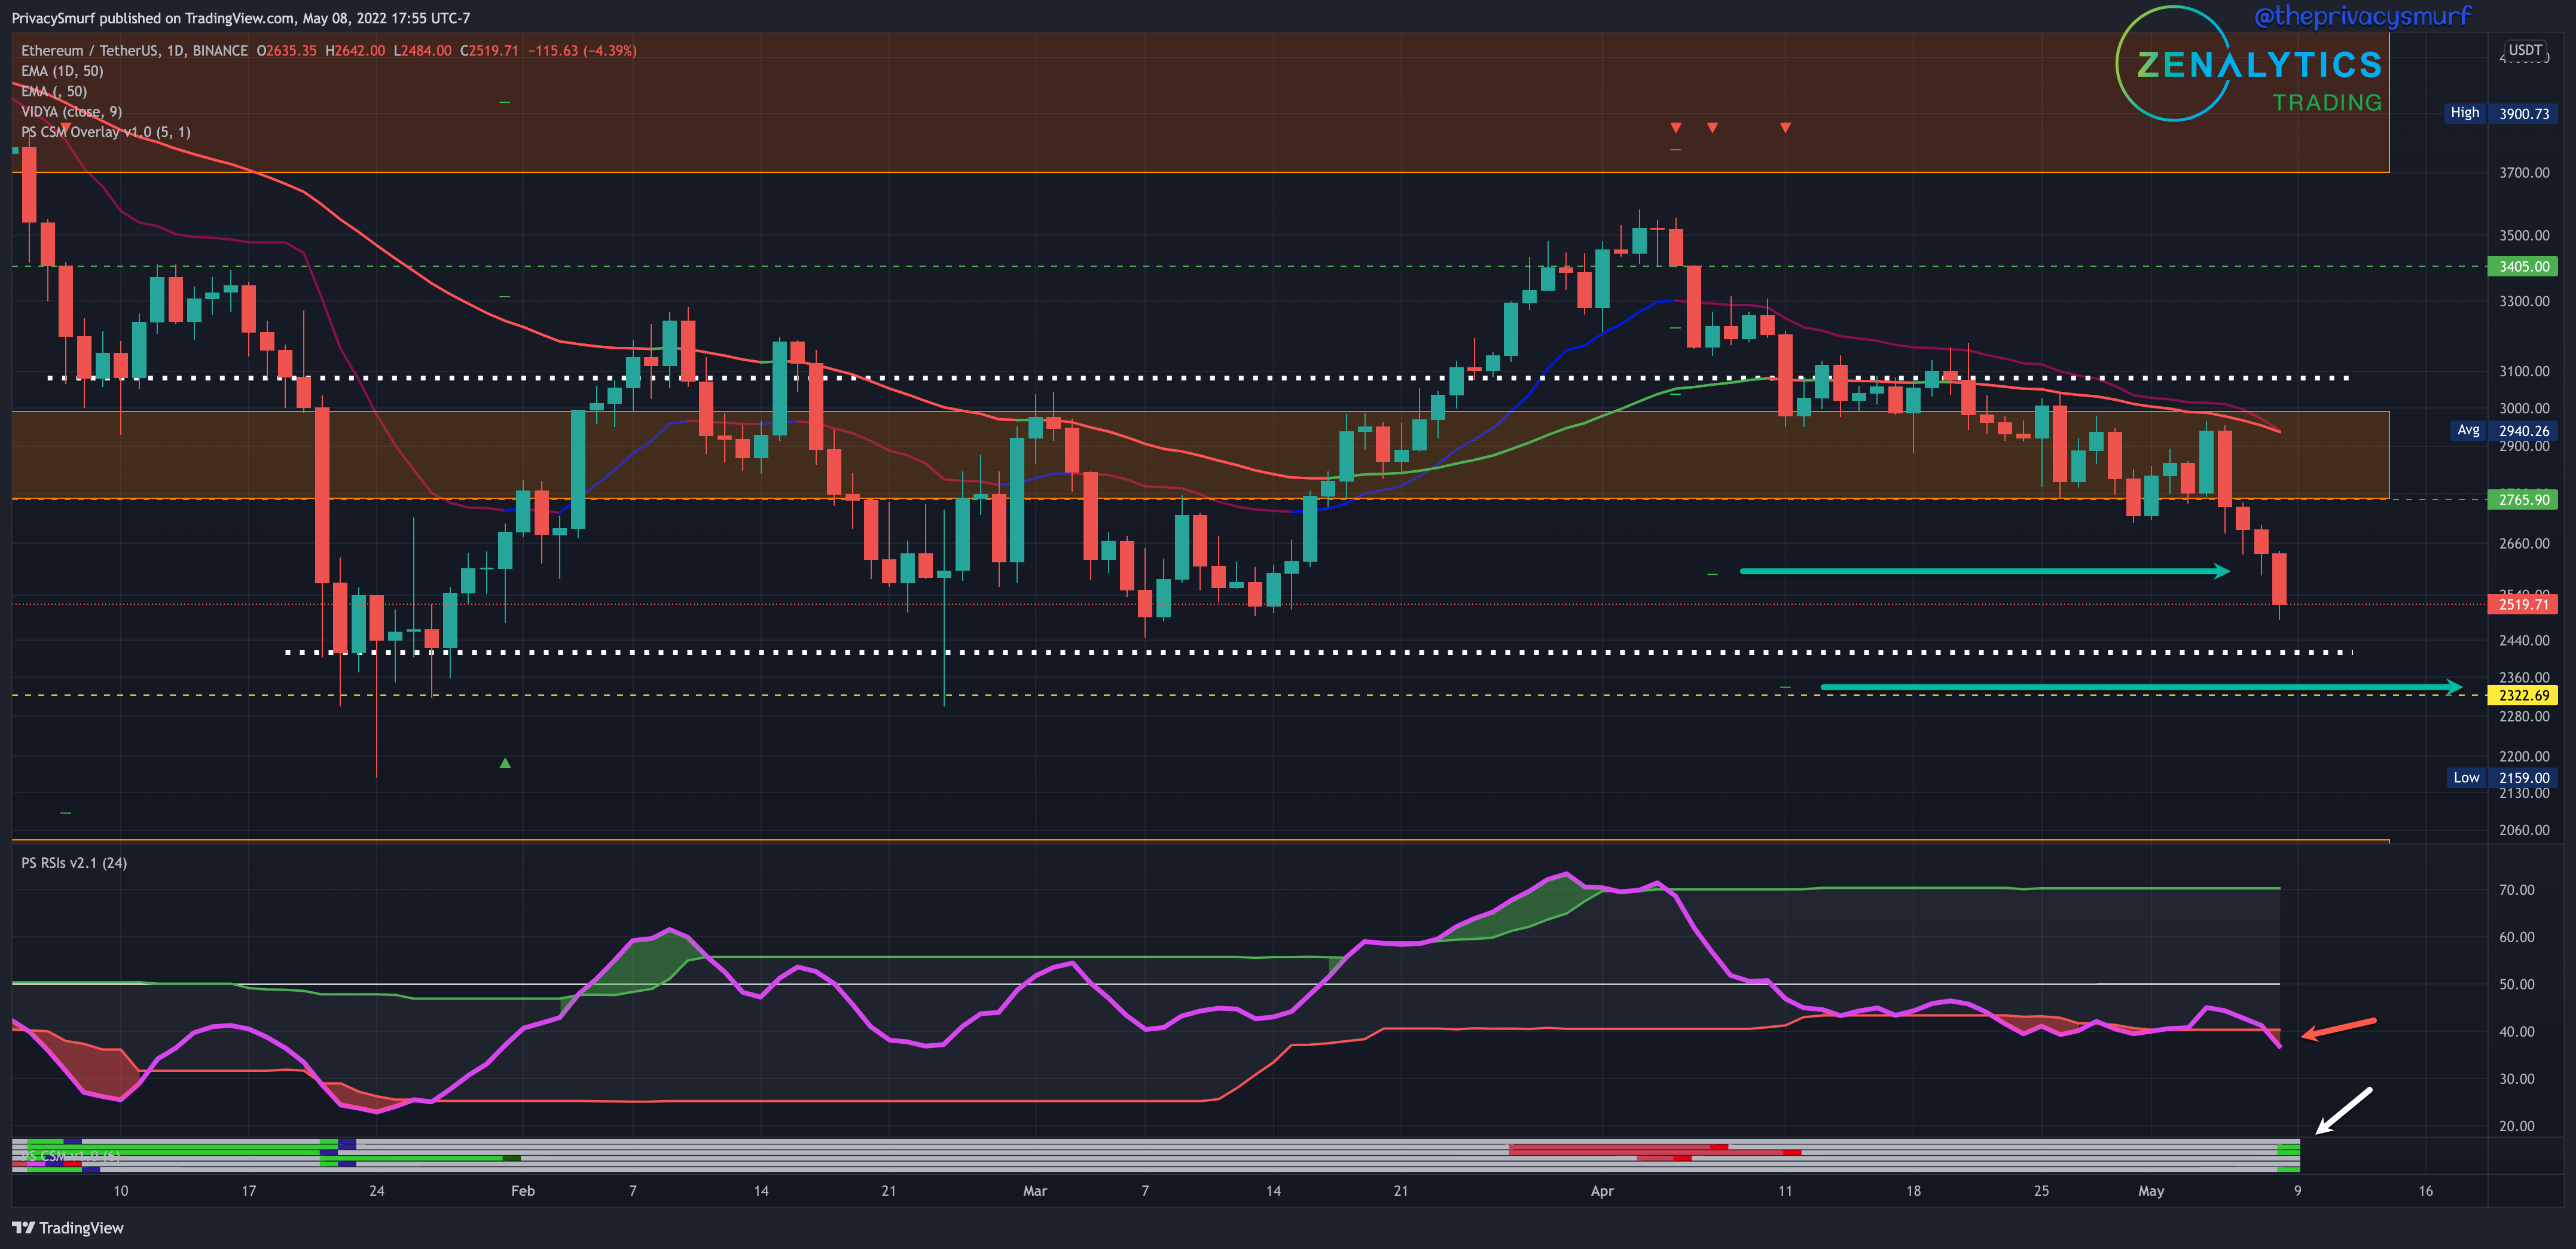
The week ended bearish and lost the support zone again. In April, multiple bearish trade signals from the Correction Strength Meter (my custom indicator at the bottom of the chart, which is private but available upon request) were cued. The 2nd was achieved on Saturday and the price is trending towards the 3rd target just under $2360 (green horizontal arrow). The RSI is trending down below the adaptive bottom band suggesting bearish price continuation (red arrow). The CSM is showing NO blue dots on the green lines which indicates that bullish divergences are intact (white arrow). Oscillators aren’t setting new lows while new lows are being set by the price, however more bearish price action will likely invalidate these if prices continue down over the next couple of days. I’d put some possible supports at $2412 and $2322 (which is a historical area of support/resistance from summer 2021). I can probably tighten up the trading range by the Wednesday Update but a safe buffer IMO would be a new trading range of $2300 to $2700.
Here’s some extra reading. Way back when we were in a similar place. Just because the weekly market structure is turning to garbage doesn’t mean things are all going to hell in a handbasket. Market structure is a tricky thing on higher timeframes which can completely ruin you.

Enjoy your week. Do yourself a favor and find the communities in the space right now that are active, building, and positive during times like these. It will pay off when the market starts to kick back off again because you’ll be positioned in the good places and know the things that others who walked away from the market won’t.
@theprivacysmurf