

Sunday Synopsis #40: Second City
Sunday Synopsis #40: Second City
Staring blindly into space, getting up to splash my face. Wanting just to stay awake wondering how much I can take.

It’s said that it’s darkest before the dawn so here’s some TA and tunes while we are ‘waiting for the break of day’ in these dark times.
BTC/USDT Weekly Structure
https://www.tradingview.com/chart/4v8qizyI/

This week was a big red one. The market structure officially transitioned to bearish logging in the lowest weekly close since Dec 2020. It’s not all doom and gloom though. The same lower close happened back in July 2021 and that was the lead up to a new ATH four months later. The last bastion of support IMO is the lowest weekly low back from early 2021 at $28.8k. A week closing below that will leave very little room for bullishness.
A lot of folks have been posting about how BTC has never had this many weeks red before ever. I’m not surprised by that. In this older post from Dec, I talked about the significant and unprecedented weakness in BTC. If you’ve ever listened to me ramble on before you’re probably familiar with my commentary on how I think it’s silly to say something can’t happen (or isn’t a thing) because it’s never happened before. Anything is possible at any point in time and discounting that will only lead to eventual ruin.
What now for the long term? Nothing IMO. I’ve already had a buy order to DCA at these low prices and I’m not entirely sure that prices can’t/wont go lower so I’m not loading all up now. Another lower weekly close and I’d be expecting deeper higher timeframe bearish targets to be hit that I’d surely like to DCA so I’m DCAing VERY sparingly across my long-term holds.
The trend and bias on the weekly chart are still bearish on the weekly chart. I’m not expecting a quick turnaround. You can’t just stop a train on a dime when it’s moving quickly in one direction. That being said, below we’ll look at the daily chart and it would appear that the breaks are slowly being applied.
BTC/USDT Daily Chart
https://www.tradingview.com/chart/jjSdFW4b/
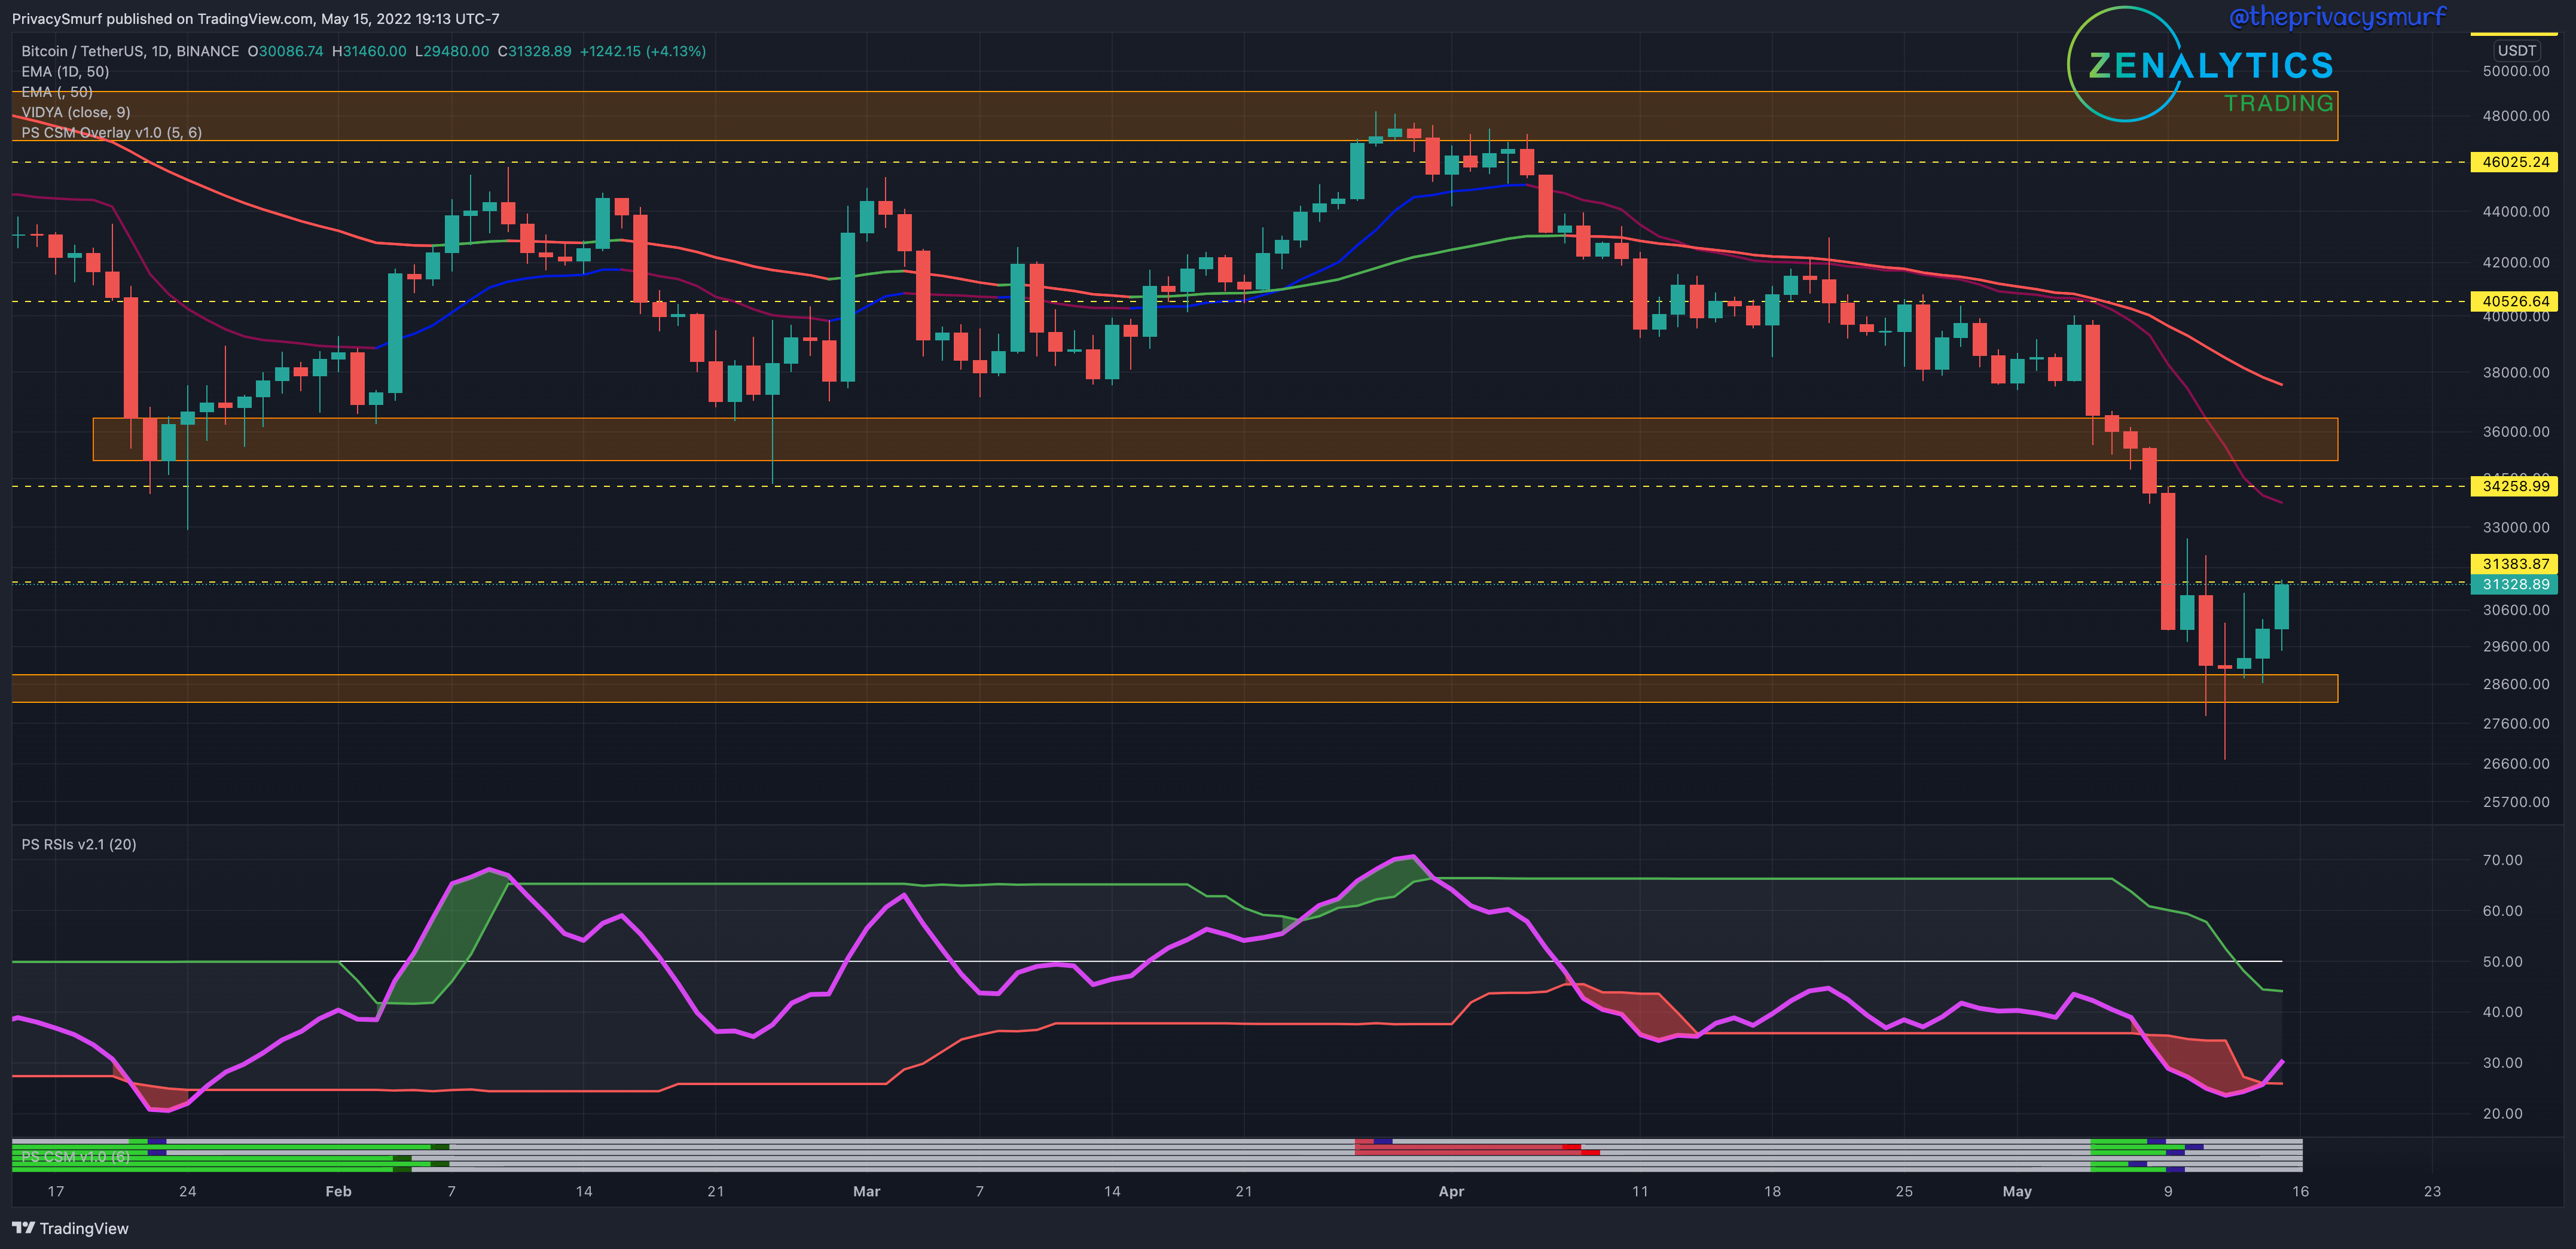
Thursday I posted a quick update about the potential of a bottoming range showing up. I’m still in favor of that range so give it a quick look ($23.7 - $32.6).

Looking at our daily chart we see the bottom support zone held up with no closes breaking below. This makes me slightly optimistic about this being the potential bottom until the daily cycles turn back bullish at the end of this coming week.


The RSI has also curled back up into the adaptive bottom band. This would suggest the potential exhaustion of the bearish price continuation. All the bullish divergences shown by the green lines at the bottom of the chart have been invalidated shown by the blue caps at the right end. This would suggest we have the potential for further downside or at a minimum a slower uphill battle to turn the momentum back to being bullish. One bright side is that the top band is also moving down to an ideal place for bullish price continuation if the RSI can end up breaking above it. I’m expecting ranging prices this week at levels expressed above but I’m cautiously aware of the soft floor we are treading on. Ideally, we’d build up some bullish momentum and then have a quick shakeout late in the week and make new lows with higher measurements on the RSI to reestablish bullish divergences. That would be a better setup for a potential rally into June/July. Daily closes below the low, however, would be no good and I’d have a short bias for day trades.
ETH/BTC Weekly Structure
https://www.tradingview.com/chart/sacHlXOv/
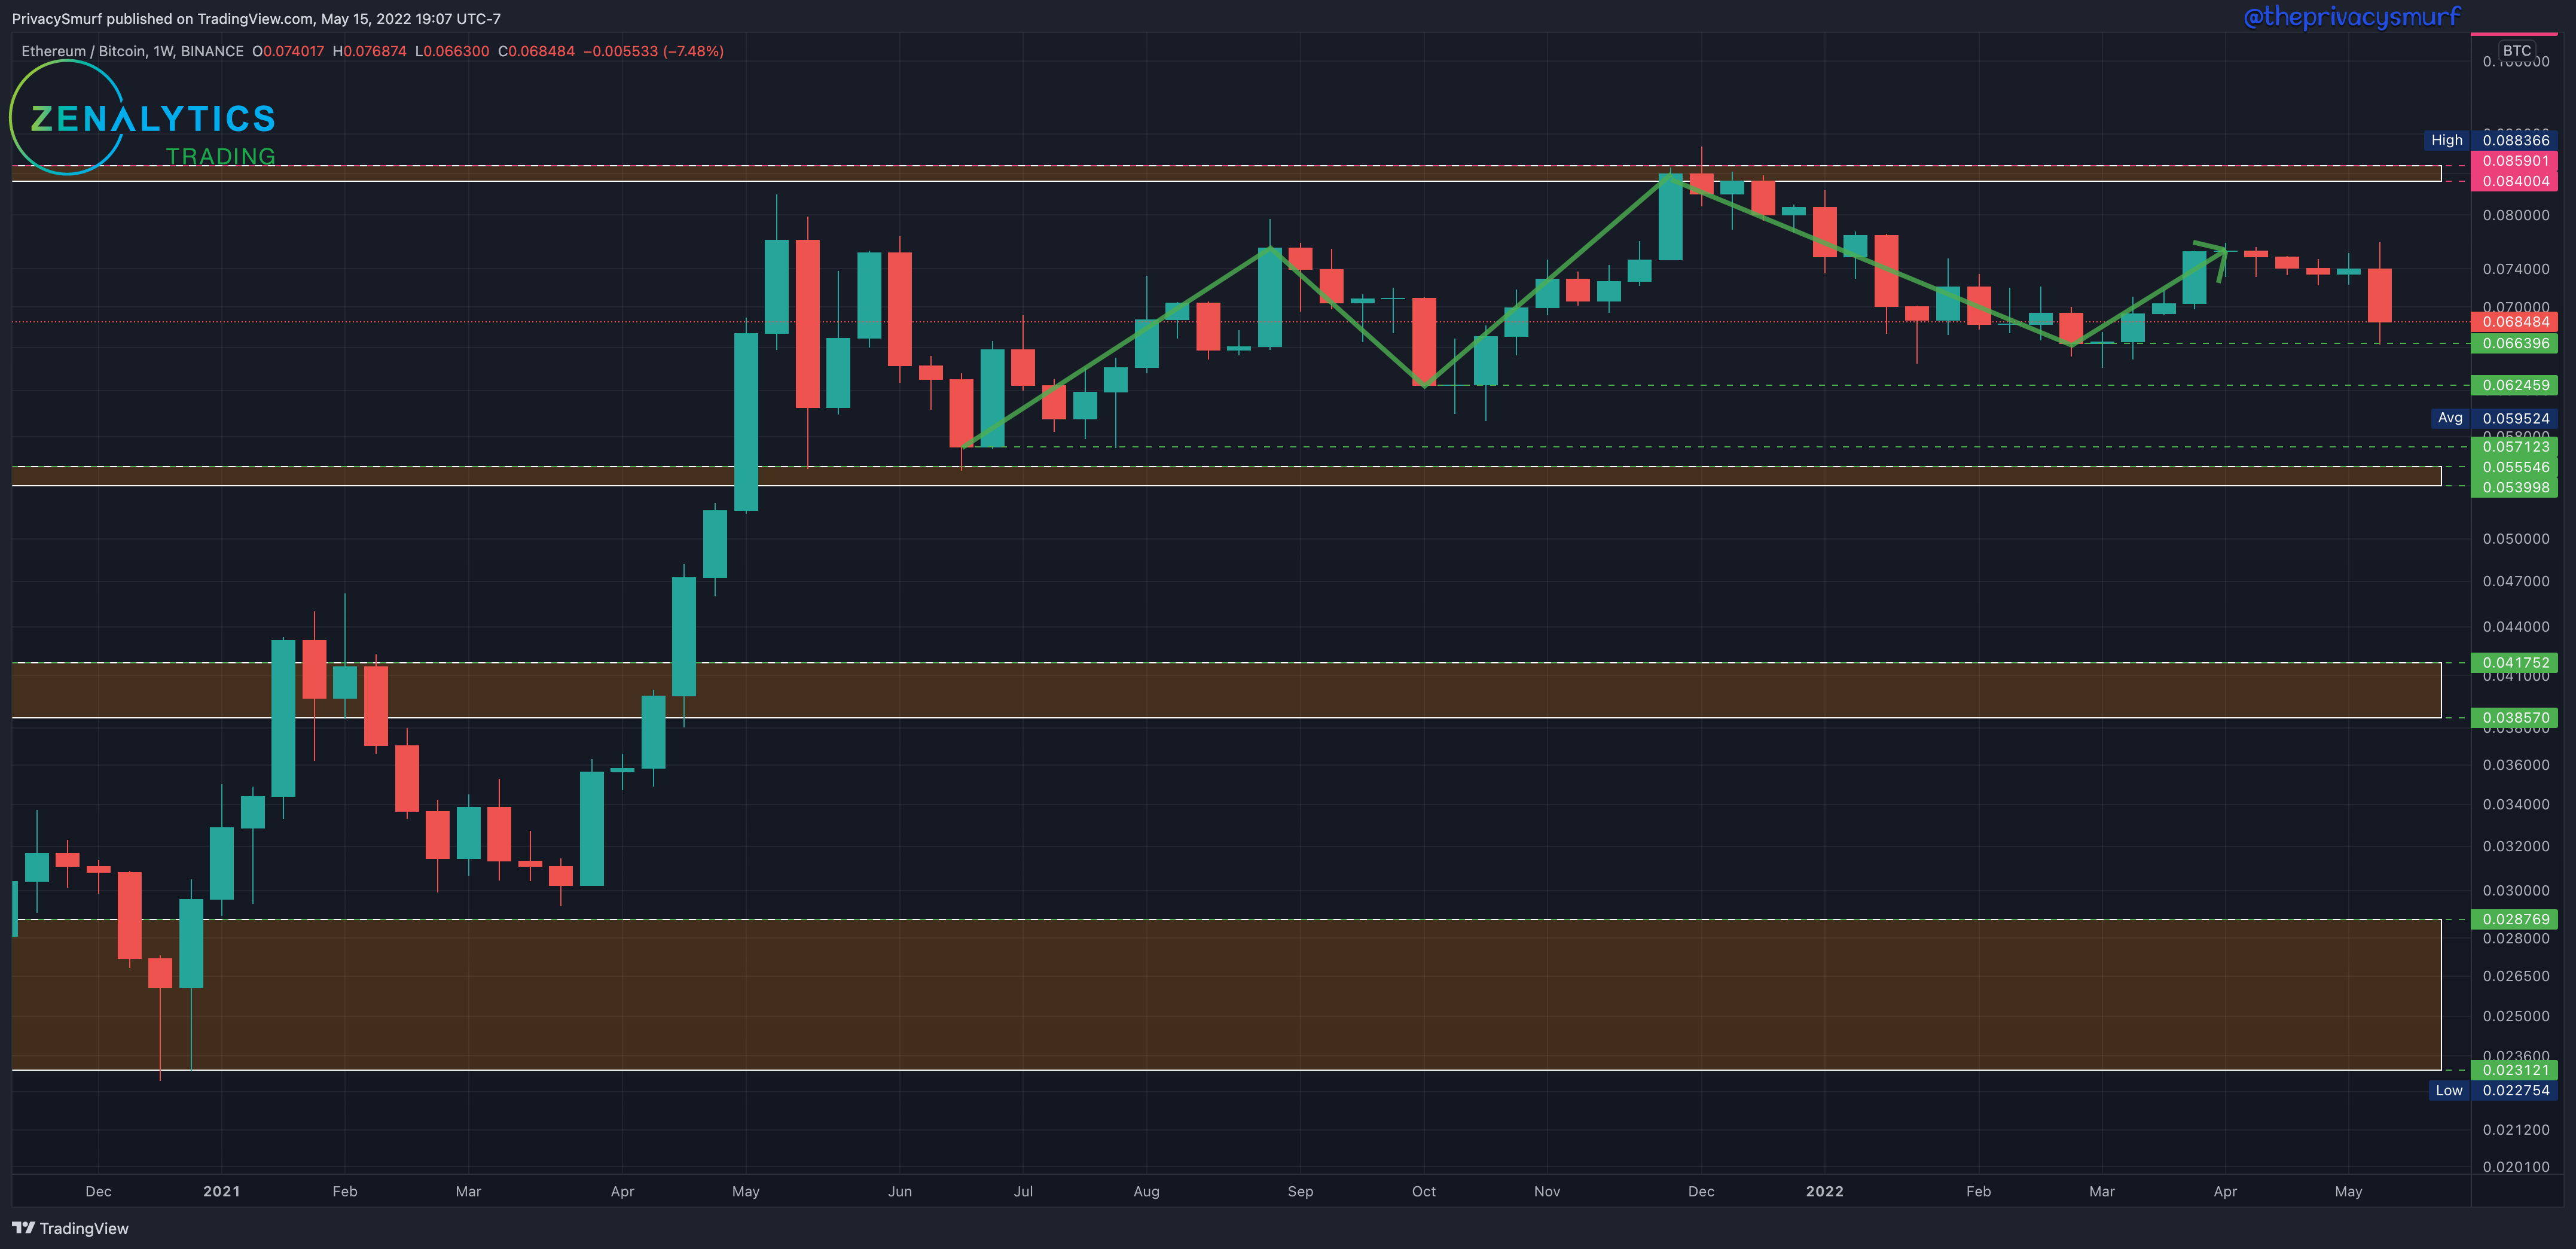
There was a decent breakdown in the ETH/BTC relationship. There still aren’t any moves to be made with this chart on a longer-term scale. I’d consider scooping up some ETH with BTC if the chart started trading at the 0.066 level if the daily chart suggested bullishness. A weekly close under 0.066 would transition to the consolidation phase and potential for ETH losing value relative to BTC. IF this occurs it’s likely that BTC is also losing its lower support level.
ETH/BTC Daily Chart
https://www.tradingview.com/chart/gTkSjkj6/
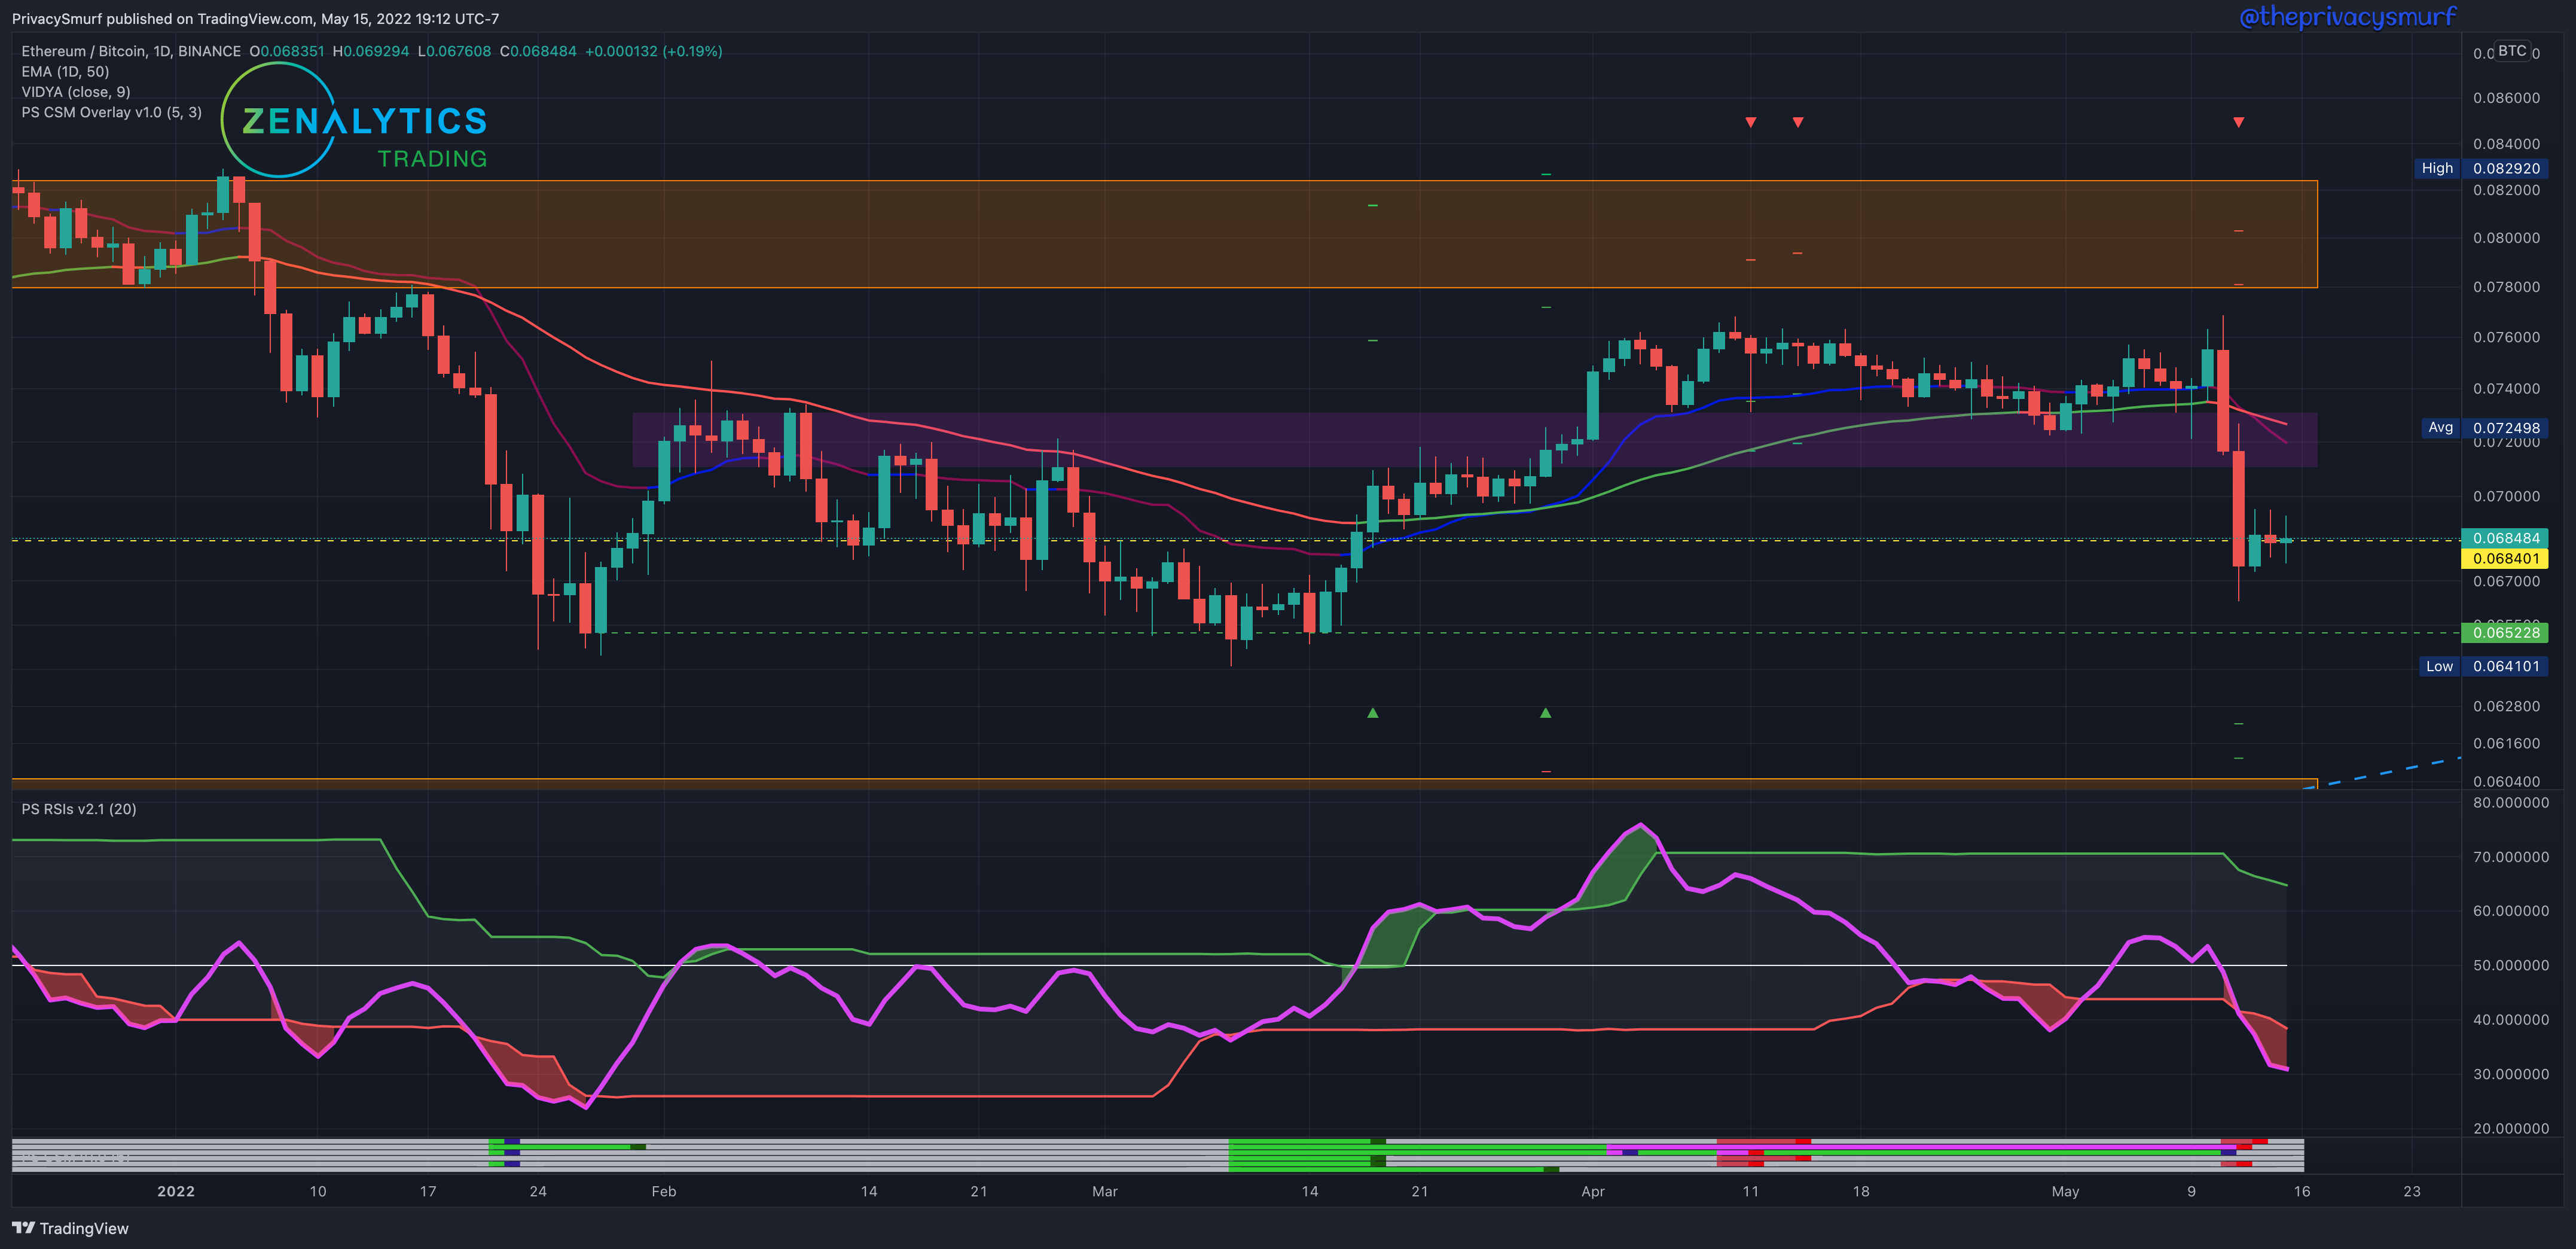
This chart broke down quite quickly. The sharp moves in BTC cause a ripple through the market and not much held up in value relative to BTC, and ETH was no exception. The support zone broke and the lower horizontal support is trying to hold. The RSI is measuring below the bottom band suggesting bearing price continuation. The Correction Strength Meter, my custom indicator at the bottom of the chart, which plots bullish and bearish trades, (email me if you’d like access: terry@zenalytics.info) has bearish targets plotted out at the 0.062 level. I’m not expecting that early this week as there’s still some support above that but if BTC fails at its support again later this week it’s likely that the low target will be tagged. It’s a bit early on this chart to call a range as it’s gone from a steep drop to a tight consolidation the last couple of days but a tentative trading range may be between 0.65 and 0.071. Wednesday should have a better picture to firm up the range.
ETH/USDT Weekly Structure
https://www.tradingview.com/chart/JPTp0aXw/
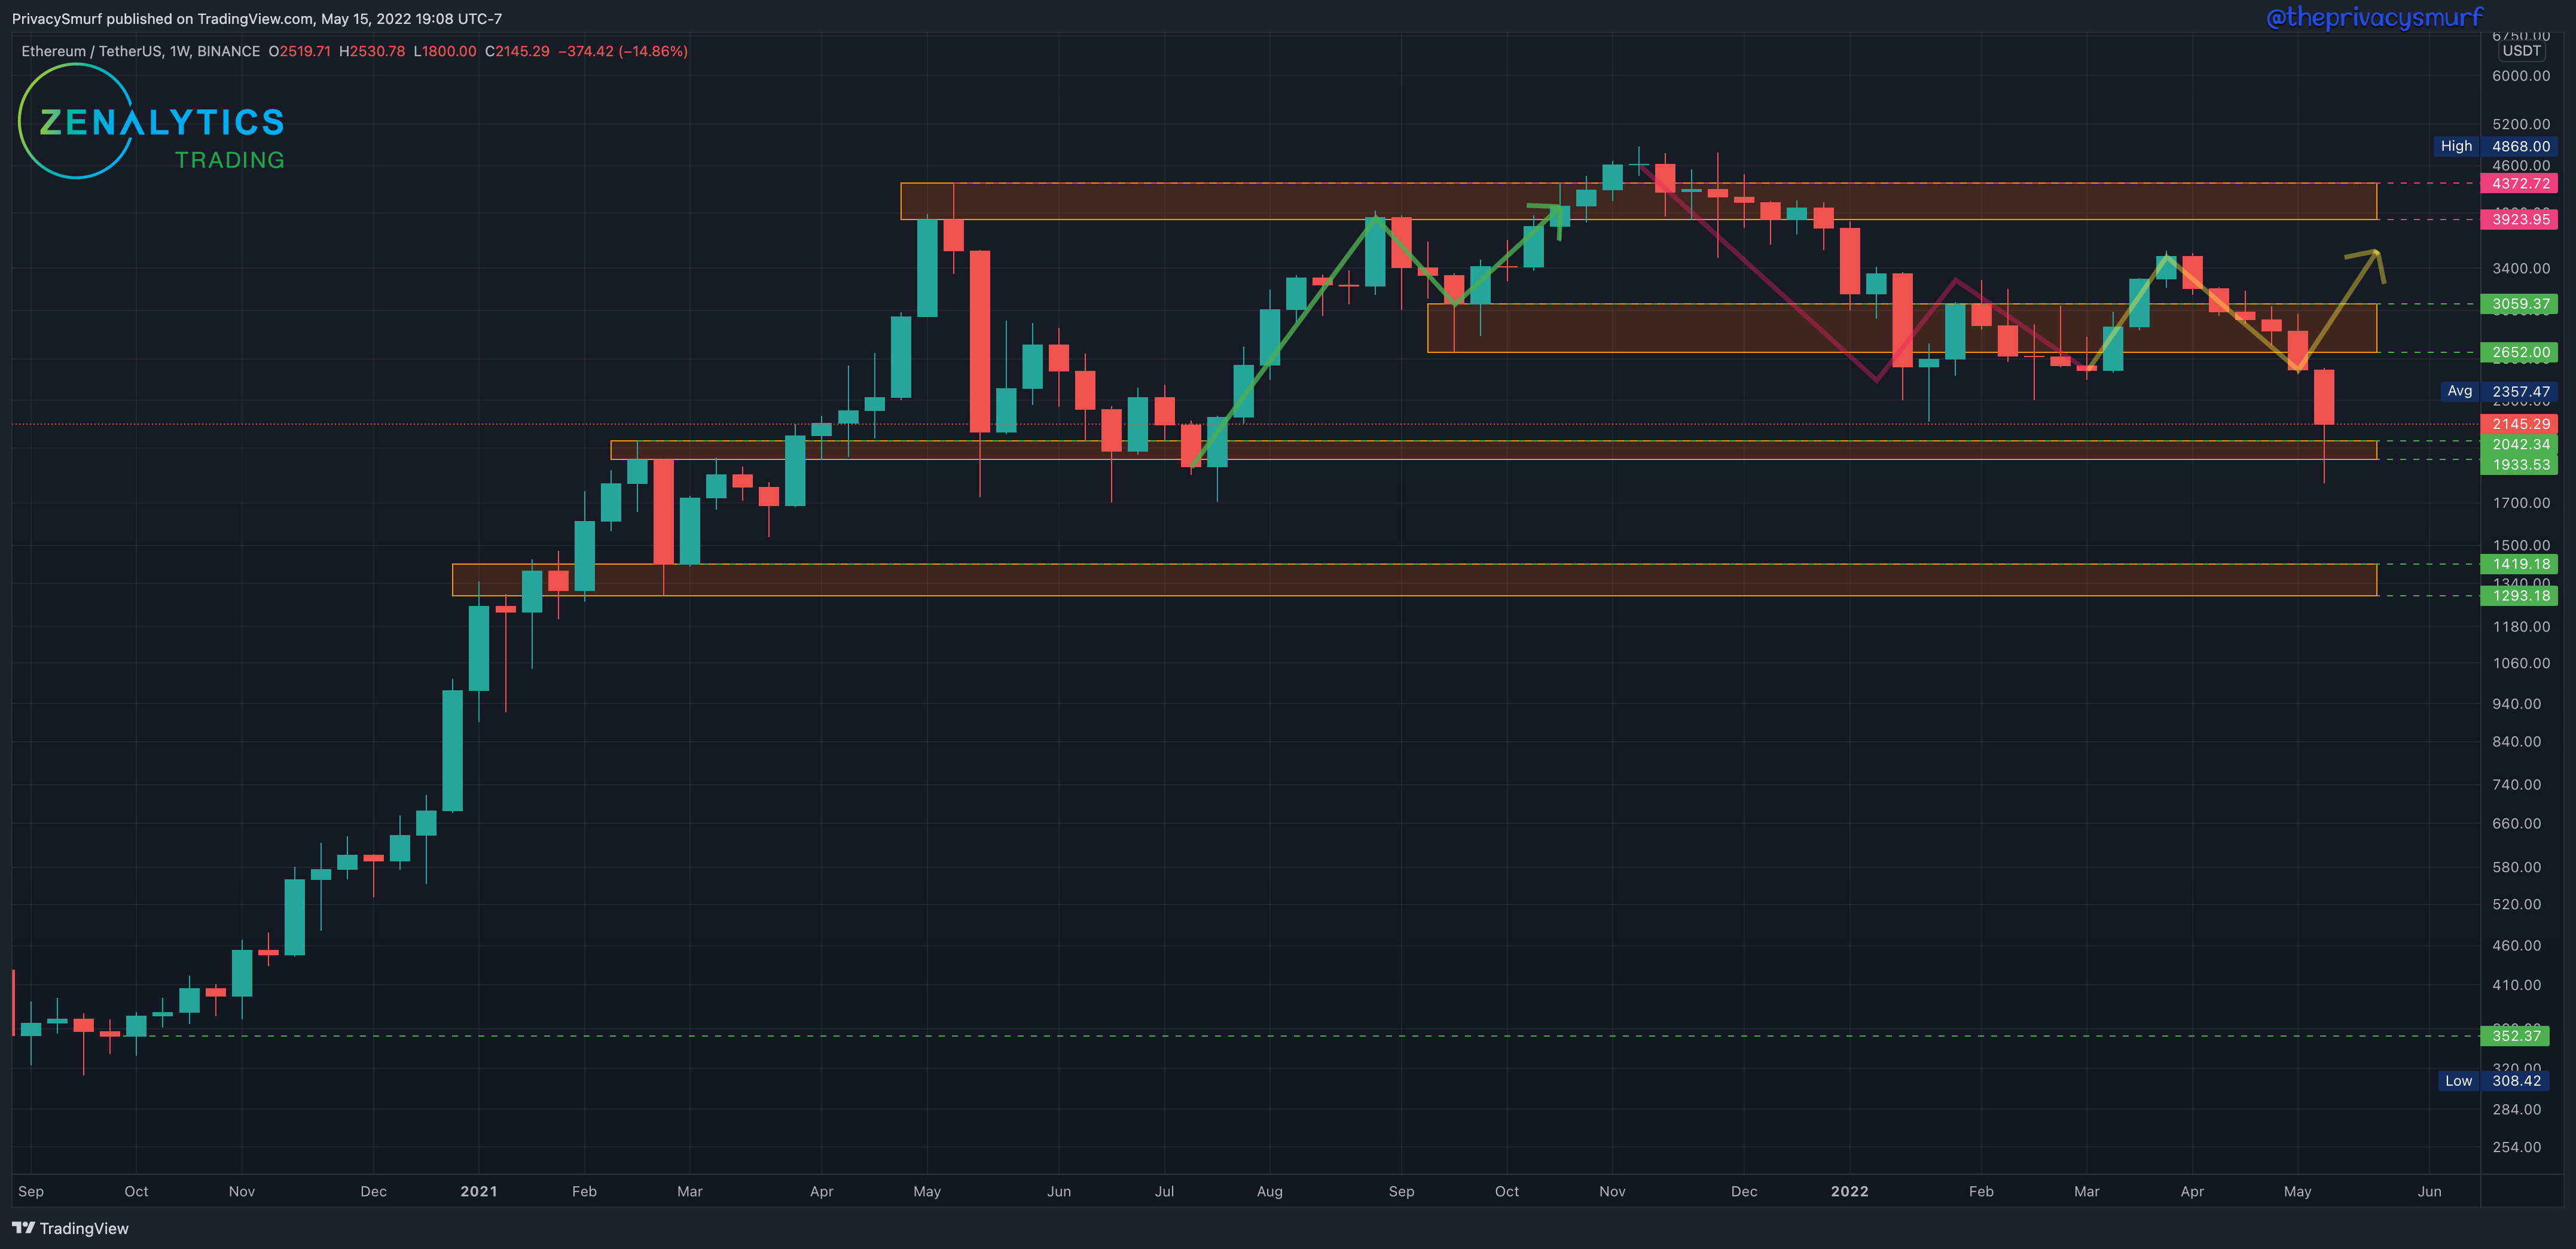
The yellow arrow signifying the potential bullish transition can be deleted now as ETH has established a new low close breaking market structure. In an effort to make the market structure concept a more objective and repeatable measure for everyone I’ll show a different method that takes out some of the confusion of consolidation periods. ETH is in slightly better shape than BTC as it has plenty of floors remaining underneath. If ETH/BTC loses its floor it’s likely the levels at $2042 will also fail here. The long wick below is enough to add in some optimism as it shows there is a buy-side bid but the trend is still bearish and will take some higher highs and higher lows to resolve the trend to the upside. The long term is similar to BTC. I’ve had DCA orders go off at these levels but I’m deploying funds sparingly as there are no signals of upside resolution yet.
ETH/USDT Daily Chart
https://www.tradingview.com/chart/xbB6lkZu/
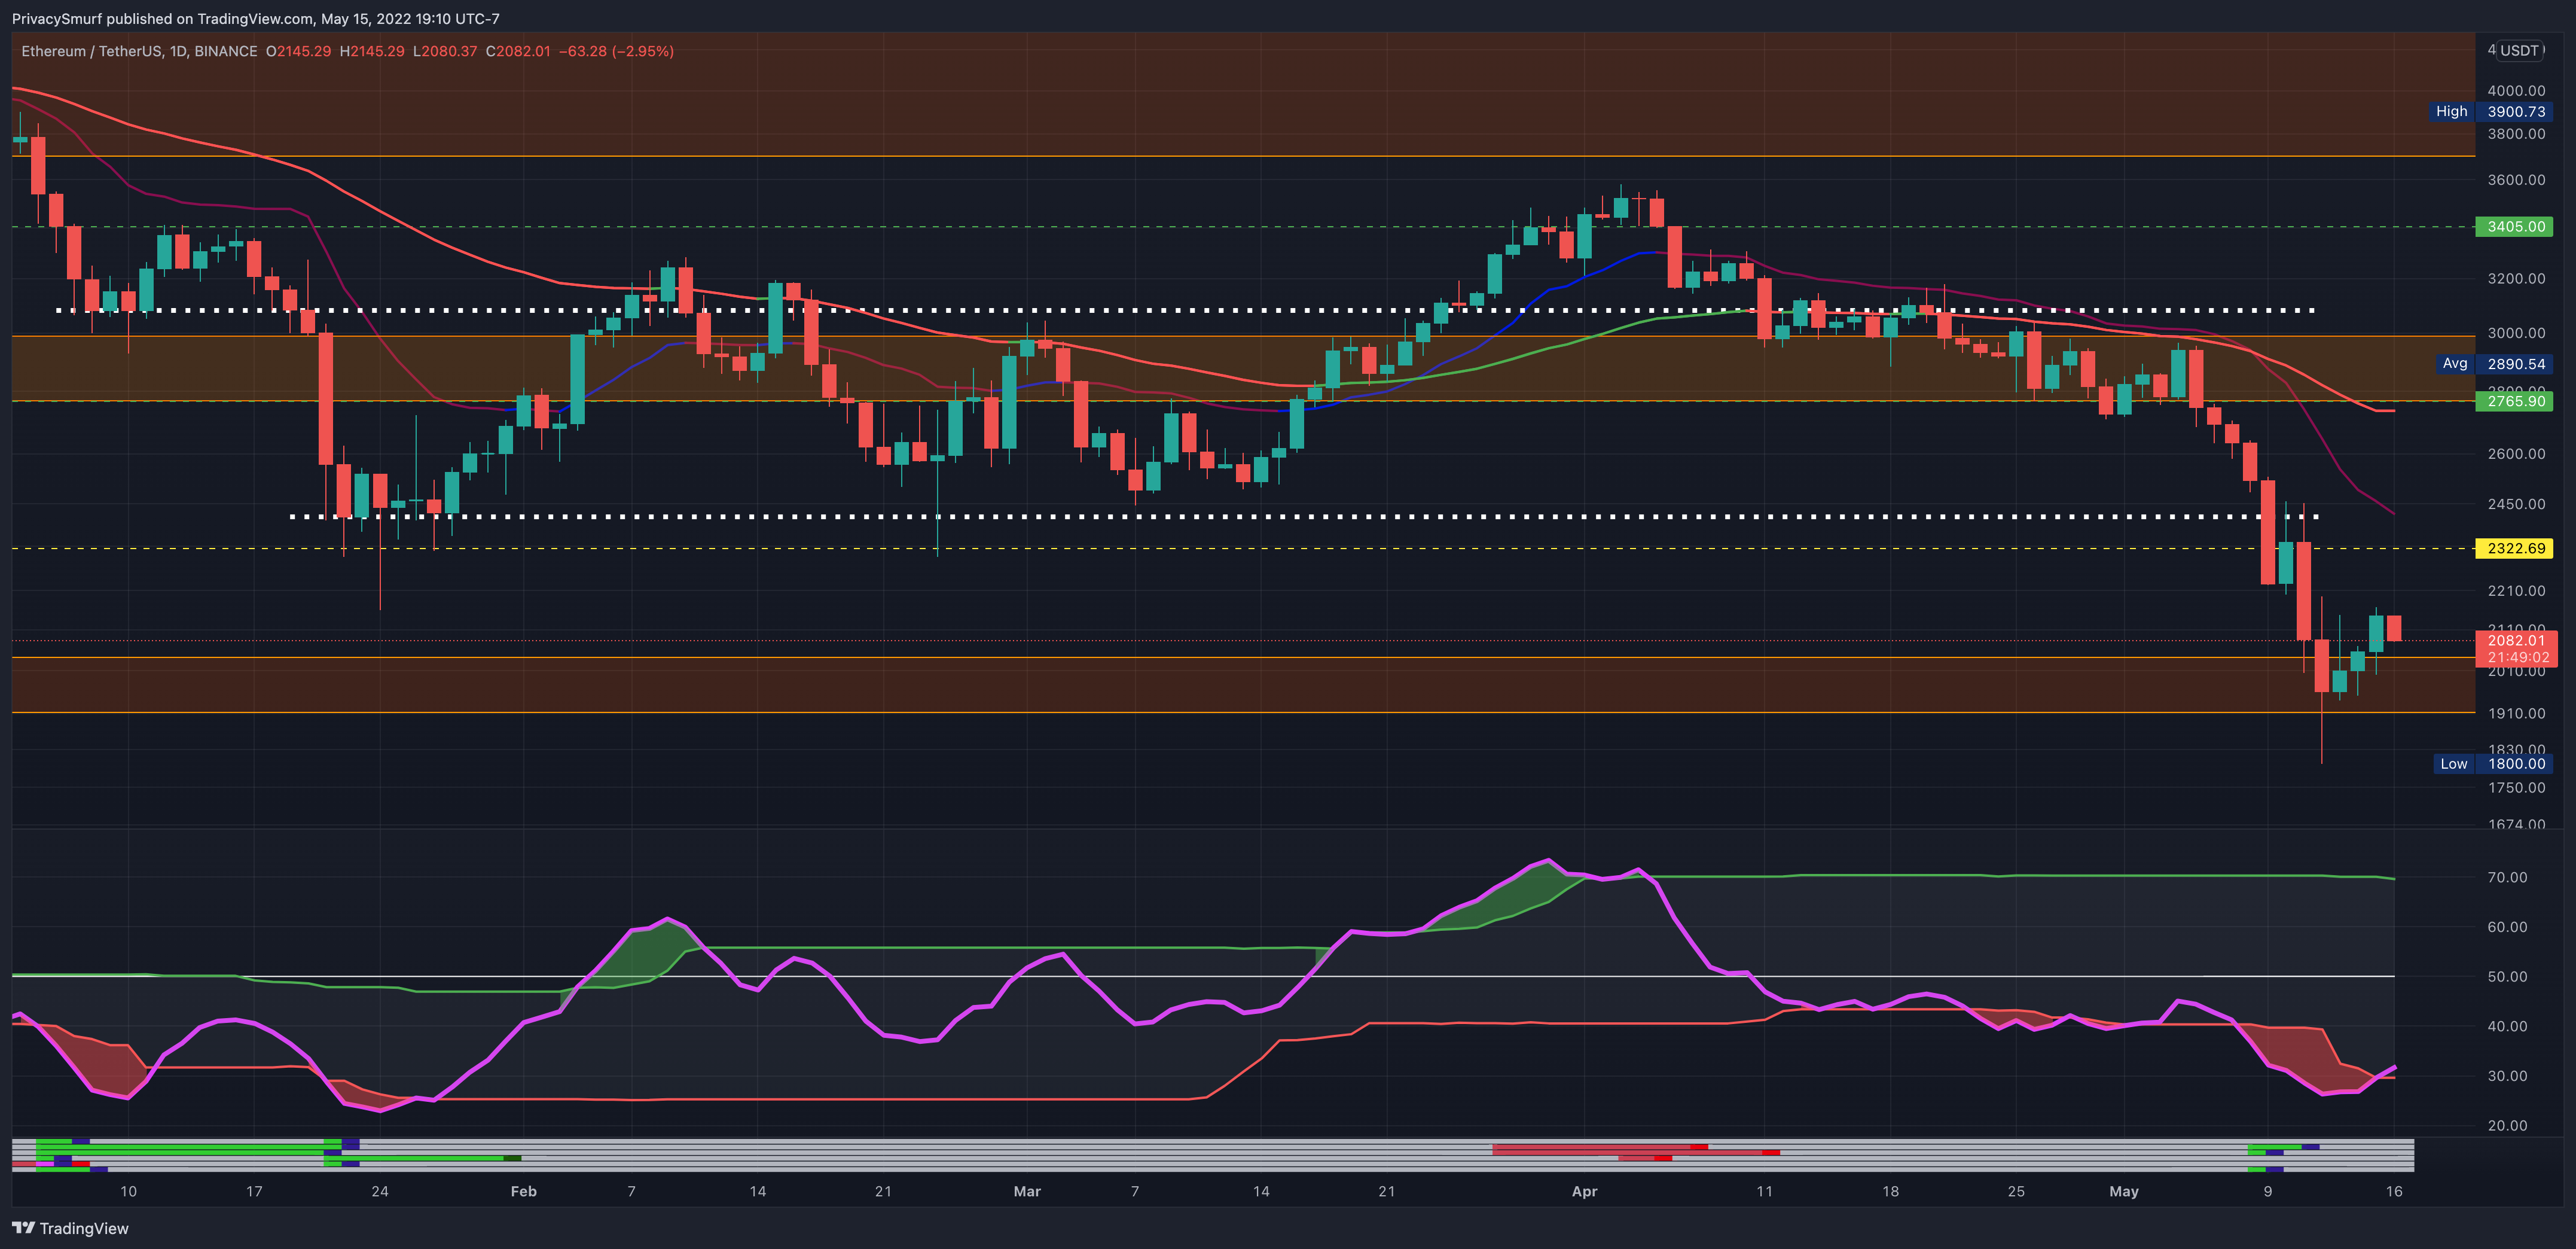
The Thursday post that I linked above also included the new potential ETH range($1880 - $2420). Same as BTC Looking at our daily chart we see the bottom support zone held up with no closes breaking below. This makes me slightly optimistic about this being the potential bottom until the daily cycles turn back bullish at the end of this coming week. The RSI here has also curled back up into the adaptive bottom band. This would suggest the potential exhaustion of the bearish price continuation. All the bullish divergences shown by the green lines at the bottom of the chart have been invalidated shown by the blue caps at the right end. This would suggest we have the potential for further downside or at a minimum a slower uphill battle to turn the momentum back to being bullish. I’m expecting ranging prices this week at levels expressed above but I’m cautiously aware of the soft floor we are treading on. ETH seems to be trading on the lower side of ithe range compared to BTC. A similar reestablishing of bullish divergence that I described above for the BTC daily chart wouldn’t be as good for ETH as the RSI hasn’t made as sharp of a move back up and trending back down would likely be new lows on the RSI so there would be no divergences between the RSI and new lows in price. We’ll see how that all goes. If BTC does go through that setup it may end up tripping ETH at the starting line of the next rally and take the lead.
On Tuesday I’m doing a Trading 101 AMA if anyone wants to attend. It’s for an NFT community I’ve been spending time in and contributing to centered around trading/investing and building up that Web 3 space.
Here’s the link for that discord and event if you are interested in attending.
https://discord.gg/hdE2uaV3?event=973388167619162132
@theprivacysmurf
Awesome - thanks!!!!