

Sunday Synopsis #41: Ryhthm
Sunday Synopsis #41: Ryhthm
You could put some joy upon my face.

After letting yesterday play out I think things have settled and we can get out the weekly update. Hope we can continue to enjoy this new rhythm the crypto market is pumping out.
I have to rework the post I made for describing the new method I’ll be demonstrating for defining market structure so this is gonna seem out of the blue but I’ll post it up in the next day or so with a video as well. Don’t forget that each of the charts has an associated link so you can open up the charts yourself as well and/or make a copy.
BTC/USDT Weekly Structure
https://www.tradingview.com/chart/4v8qizyI/
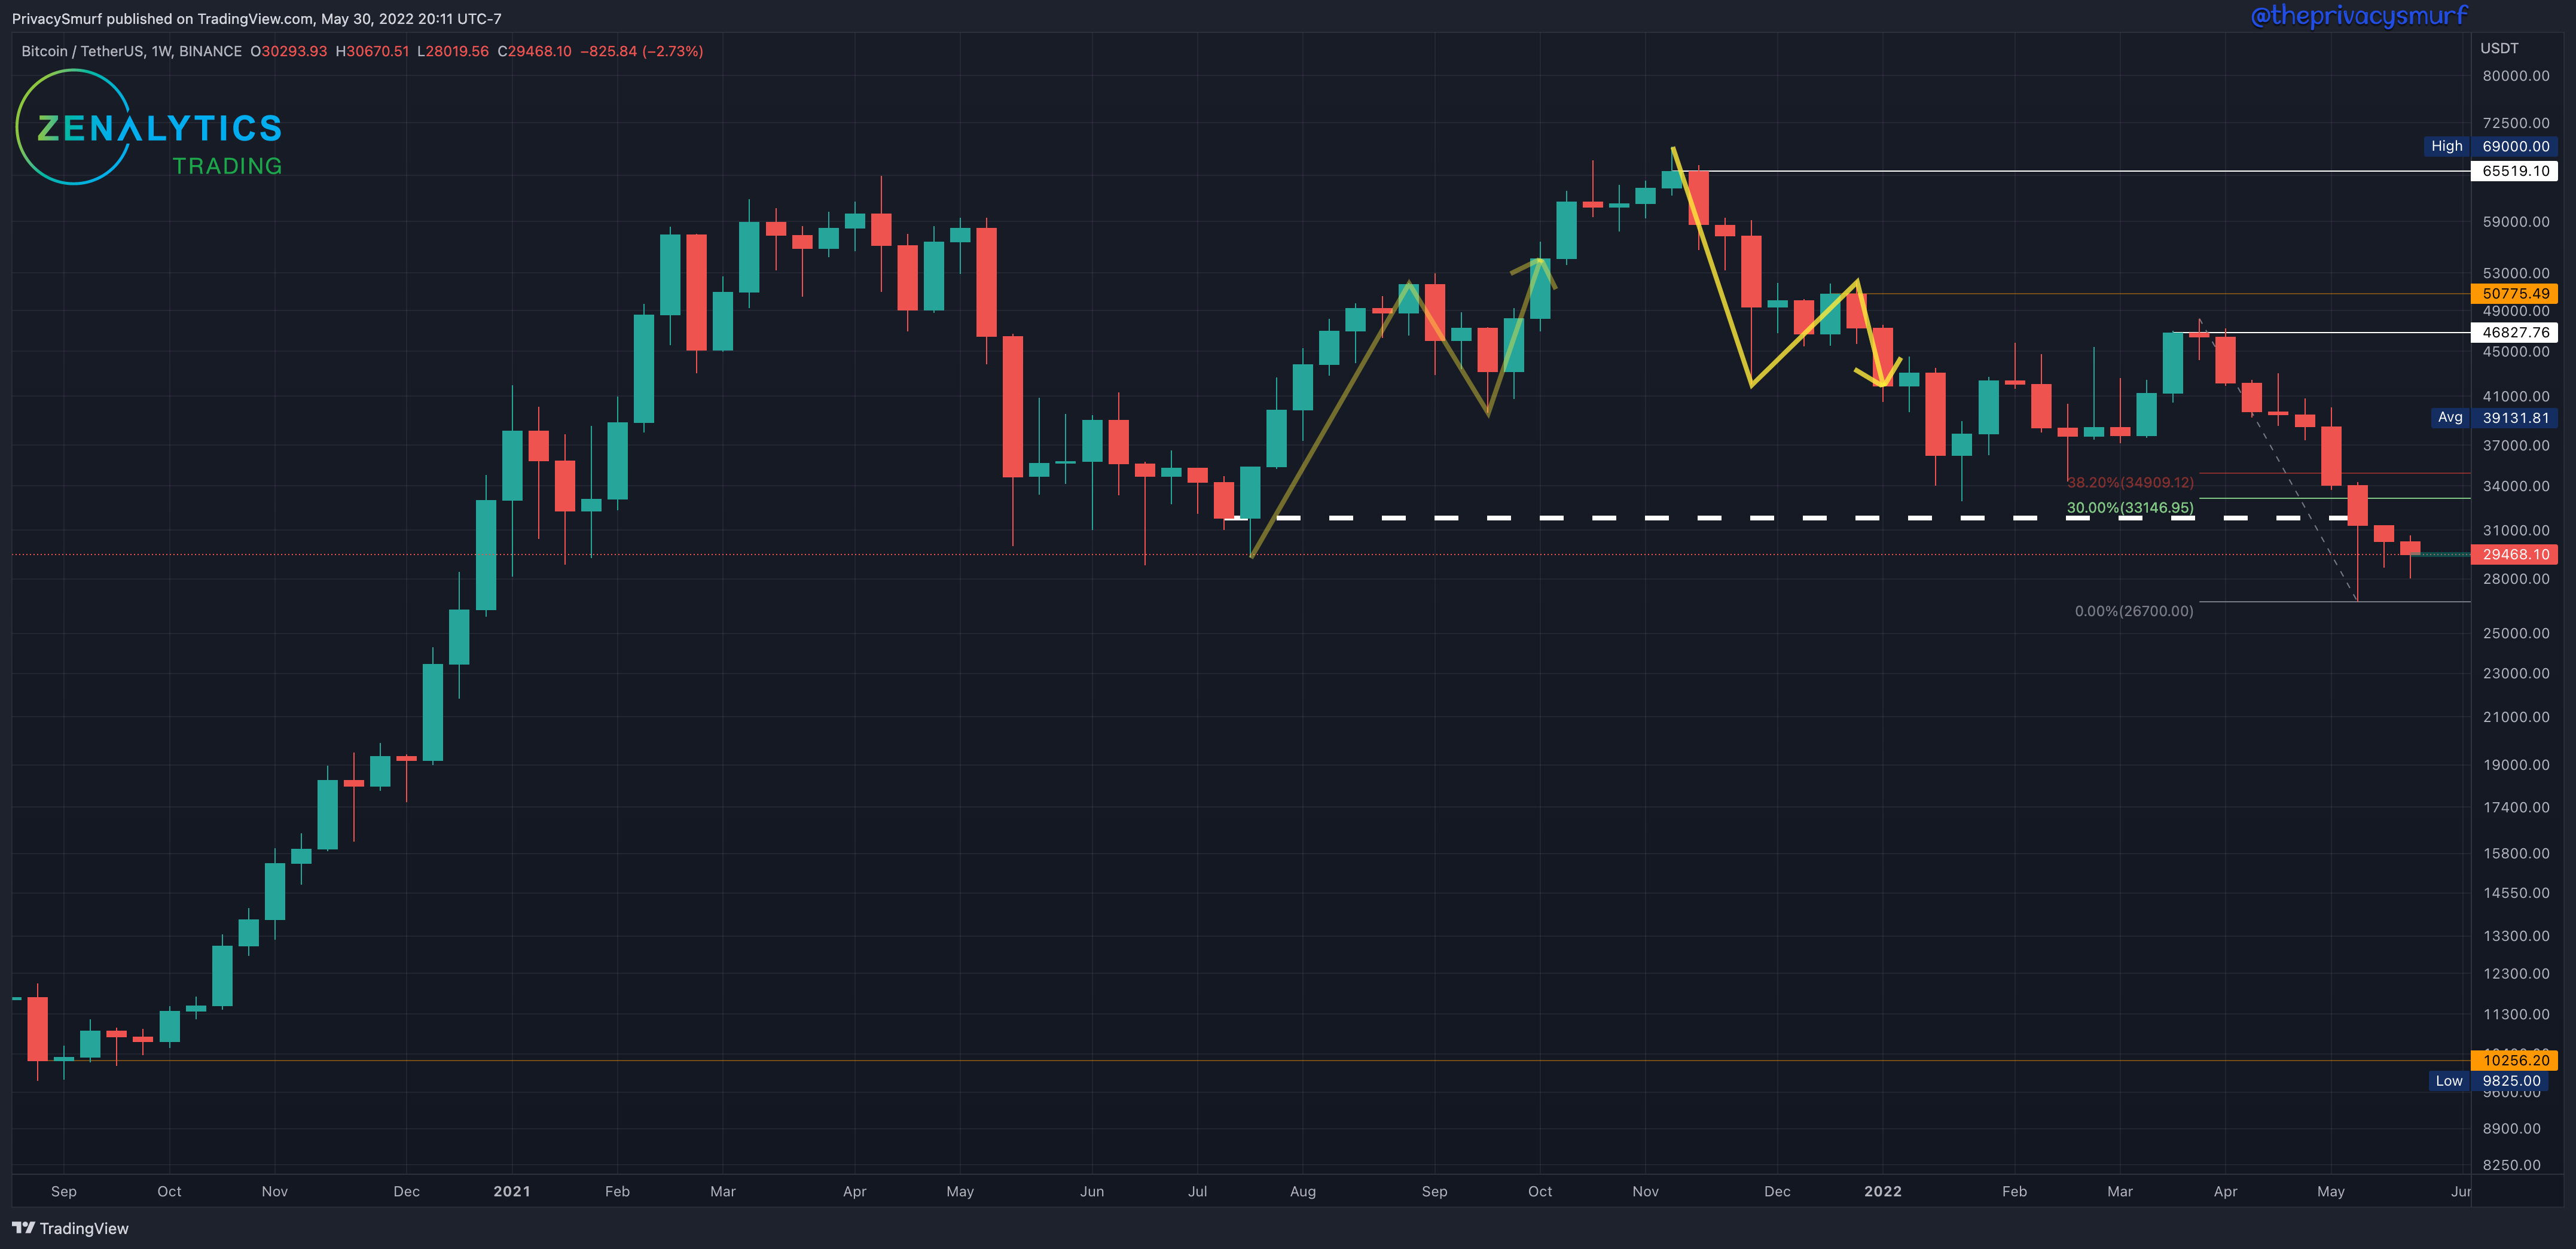
For the 9th consecutive week, BTC closed red. The last market structure support (dashed white line) at $31.8k showed the only real sign of support until around $18.4k when the 2020 rally hung up in late November. I’ll go into it more tomorrow but we’ll be using 2 fib levels to objectively define “meaningful retracements” to identify structure and trend on the weekly chart. Being in a bearish trend I’ve anchored the fib retracement from the high of the mid-March pivot point and am following the price down onto the lowest low. Any price increase of 2 green candles from the lowest low that extends above the 30% retracement level will qualify as a “meaningful retracement” and not market noise. If a candle closes above the .382 fib level (38.2% retracement) I’ll be labeling it as a valid market structure support. Given the current chart, if prices increase the lowest weekly close at $29468 is unconfirmed market support. If there are 2 more weeks of bullish closes with a close above $34909 this will establish $29468 as confirmed market structure support. If prices wick at least above $33146 (30% retracement) $29468 will be defined as weak structure. I’m not going to go into what is needed to flip the trend to bullish here but I’ll explain that more in the new post/video.
From a long-term perspective, IMO there is little reason to make any moves aside from a new DCA buy if we start to break into new lows. The trend is firmly established down. I have no interest in building a large position until strength starts to show in the market. (Think something like a close over 34k, a slight decline but not lower closes than 30k then another rally that closes above 34k again. While this sounds counterintuitive to buy when prices are going up, I personally don’t have any desire to buy weakness. Buying strength can prevent me from buying into dip after dip after dip after dip before the bottom is actually in.)
BTC/USDT Daily Chart
https://www.tradingview.com/chart/jjSdFW4b/

The daily chart made some moves late Sunday/early Monday promoting me to hold off on the weekly update so I could include the price action in the daily analysis. It’s very promising to see the bottom support zone holding up after so long but we aren’t out of the woods yet. With the RSI crossing above the adaptive bottom band (white arrow) I’m expecting the potential for more upwards price continuation with resistance coming in at the 50-day EMA and the $33-$34k price range. If the RSI is rejected from the midline I would expect to see prices come back down to test the 30k level that was broken for support. Hopefully, this series creates the high, and higher low we need to springboard into a bullish trend. If the market gets hot I’d put a ceiling at $36k and our floor still at $29k.
Intraday levels will be posted tomorrow in the new Trading Range Tuesday in the paid subscriber section.
ETH/BTC Weekly Structure
https://www.tradingview.com/chart/sacHlXOv/
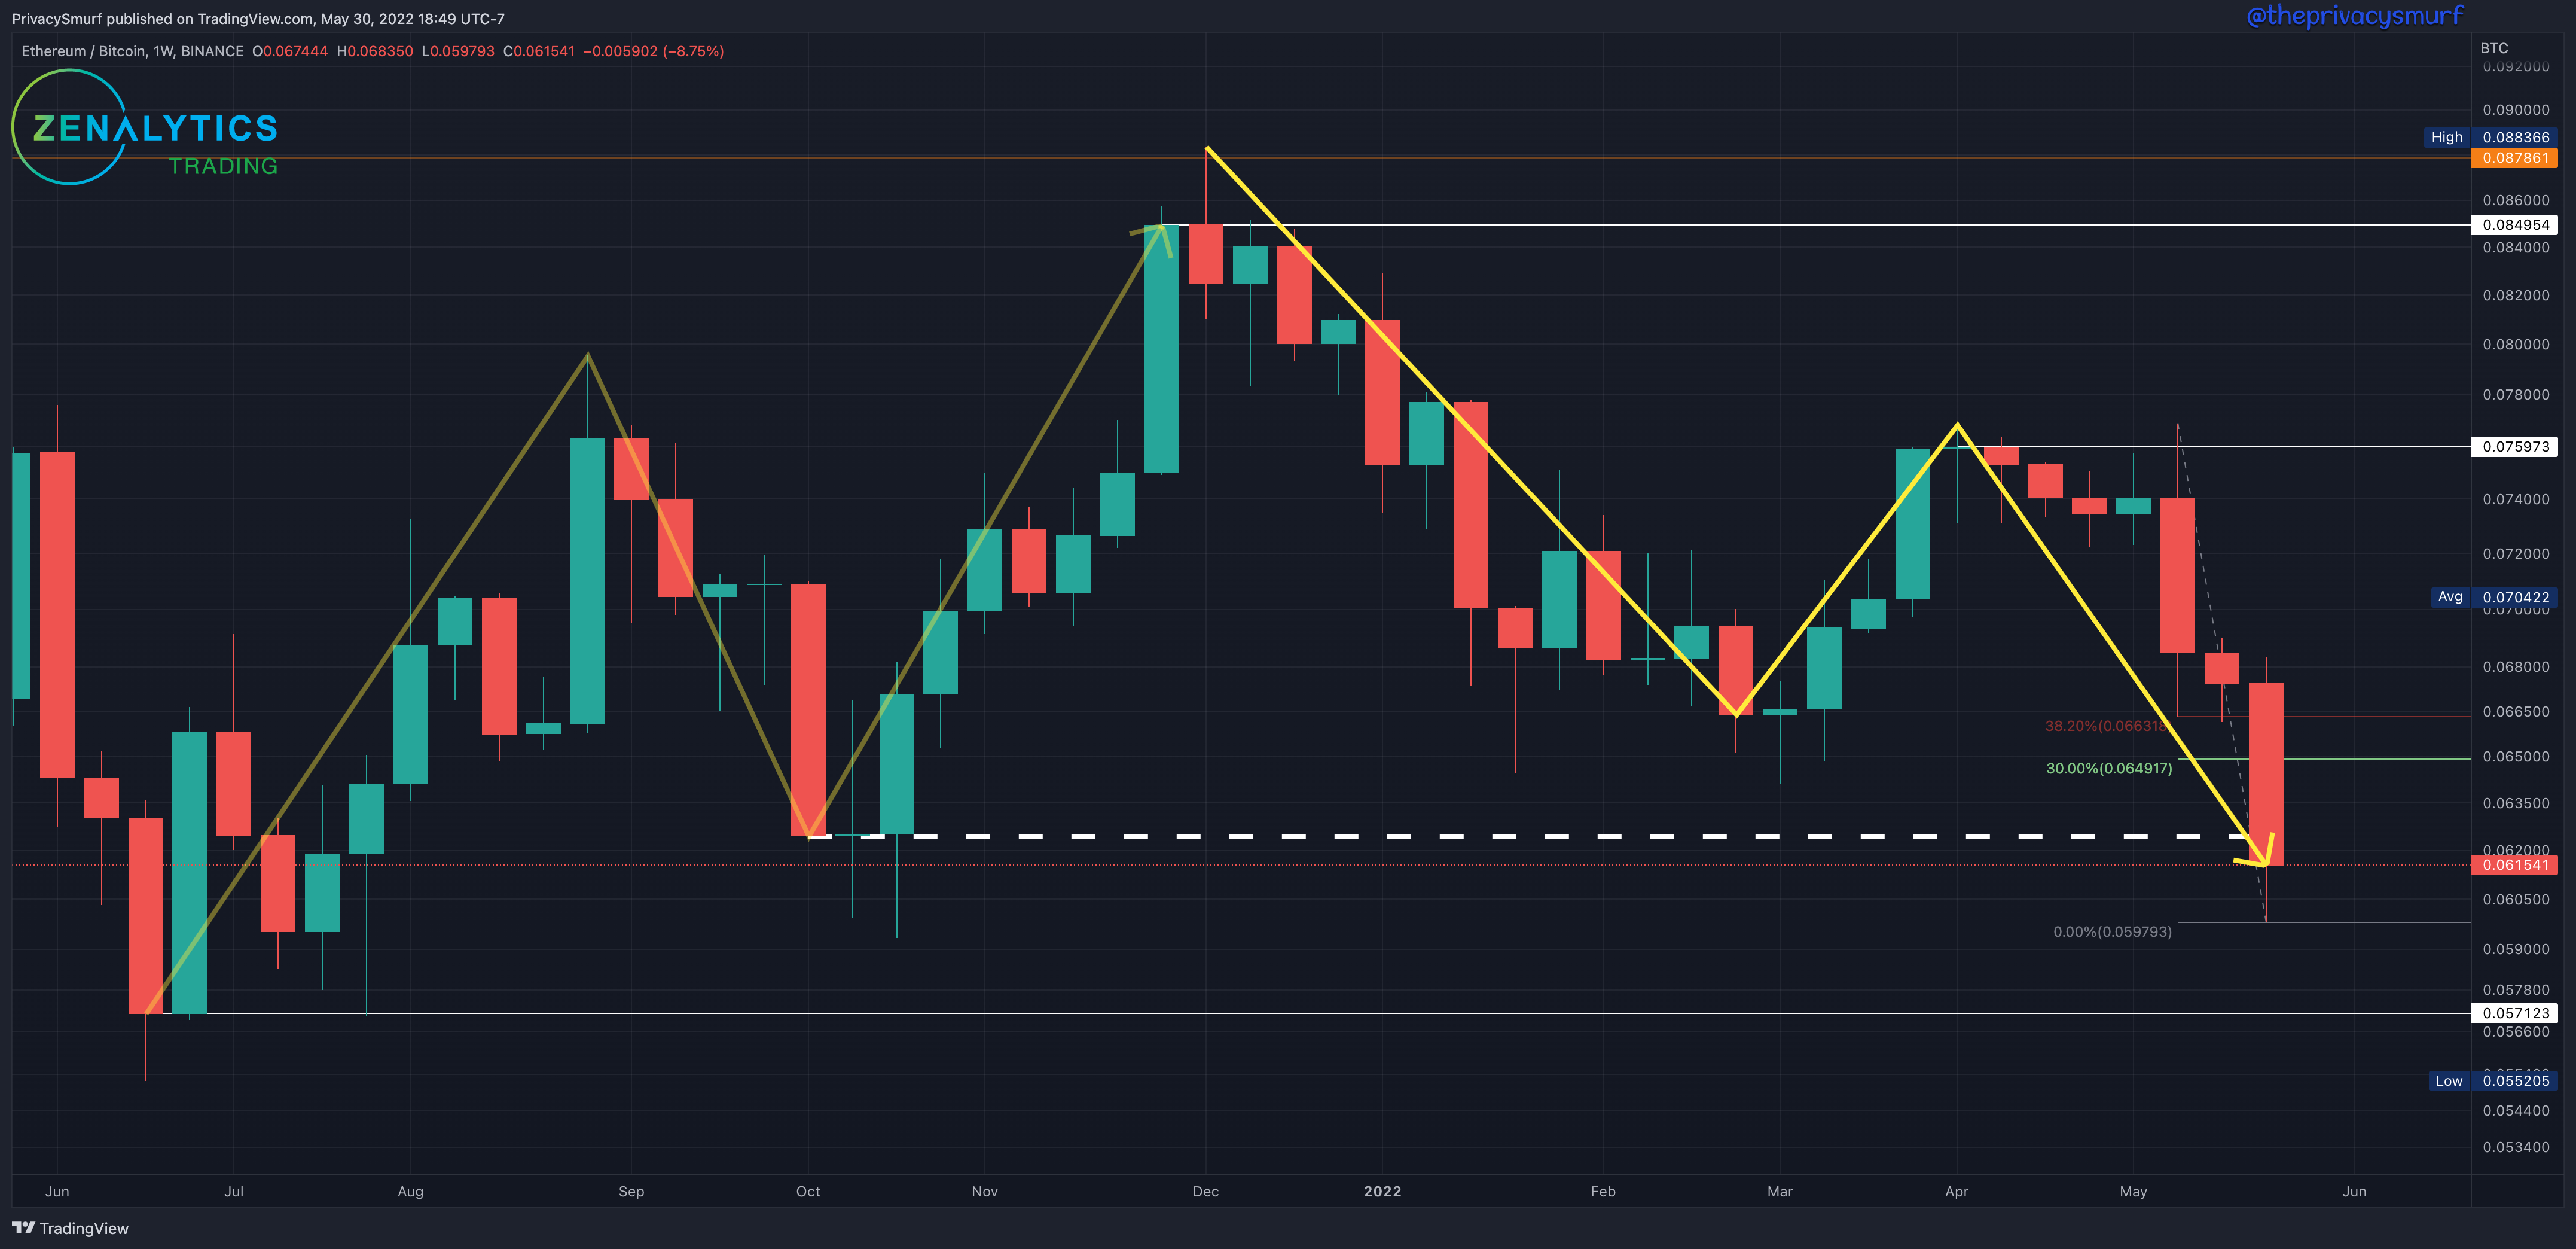
With the ETH/BTC chart closing below the 0.0625 level the chart is also bearish by my market structure standards. From a long-term perspective, the two levels of 0.0625 and 0.057 are two points I have to make a small DCA buy and add some ETH at a discount from some of my HODL BTC. These are not meant to time the market in any way they are simply structural levels of support (positions of value for buyers) and will be sold back into BTC at a later date for a profit.
Following the procedure dictated in the BTC weekly chart currently, the weekly close of 0.0615 is unconfirmed market support. Two green candles with a close above 0.0663 will confirm 0.0615 as market structure support. Otherwise, the next lower support is at 0.057 with the next resistance at 0.0759. Similar to BTC, the trend is down and there’s no desire to add heavy into ETH for me at the moment given the structure of the market.
ETH/BTC Daily Chart
https://www.tradingview.com/chart/gTkSjkj6/
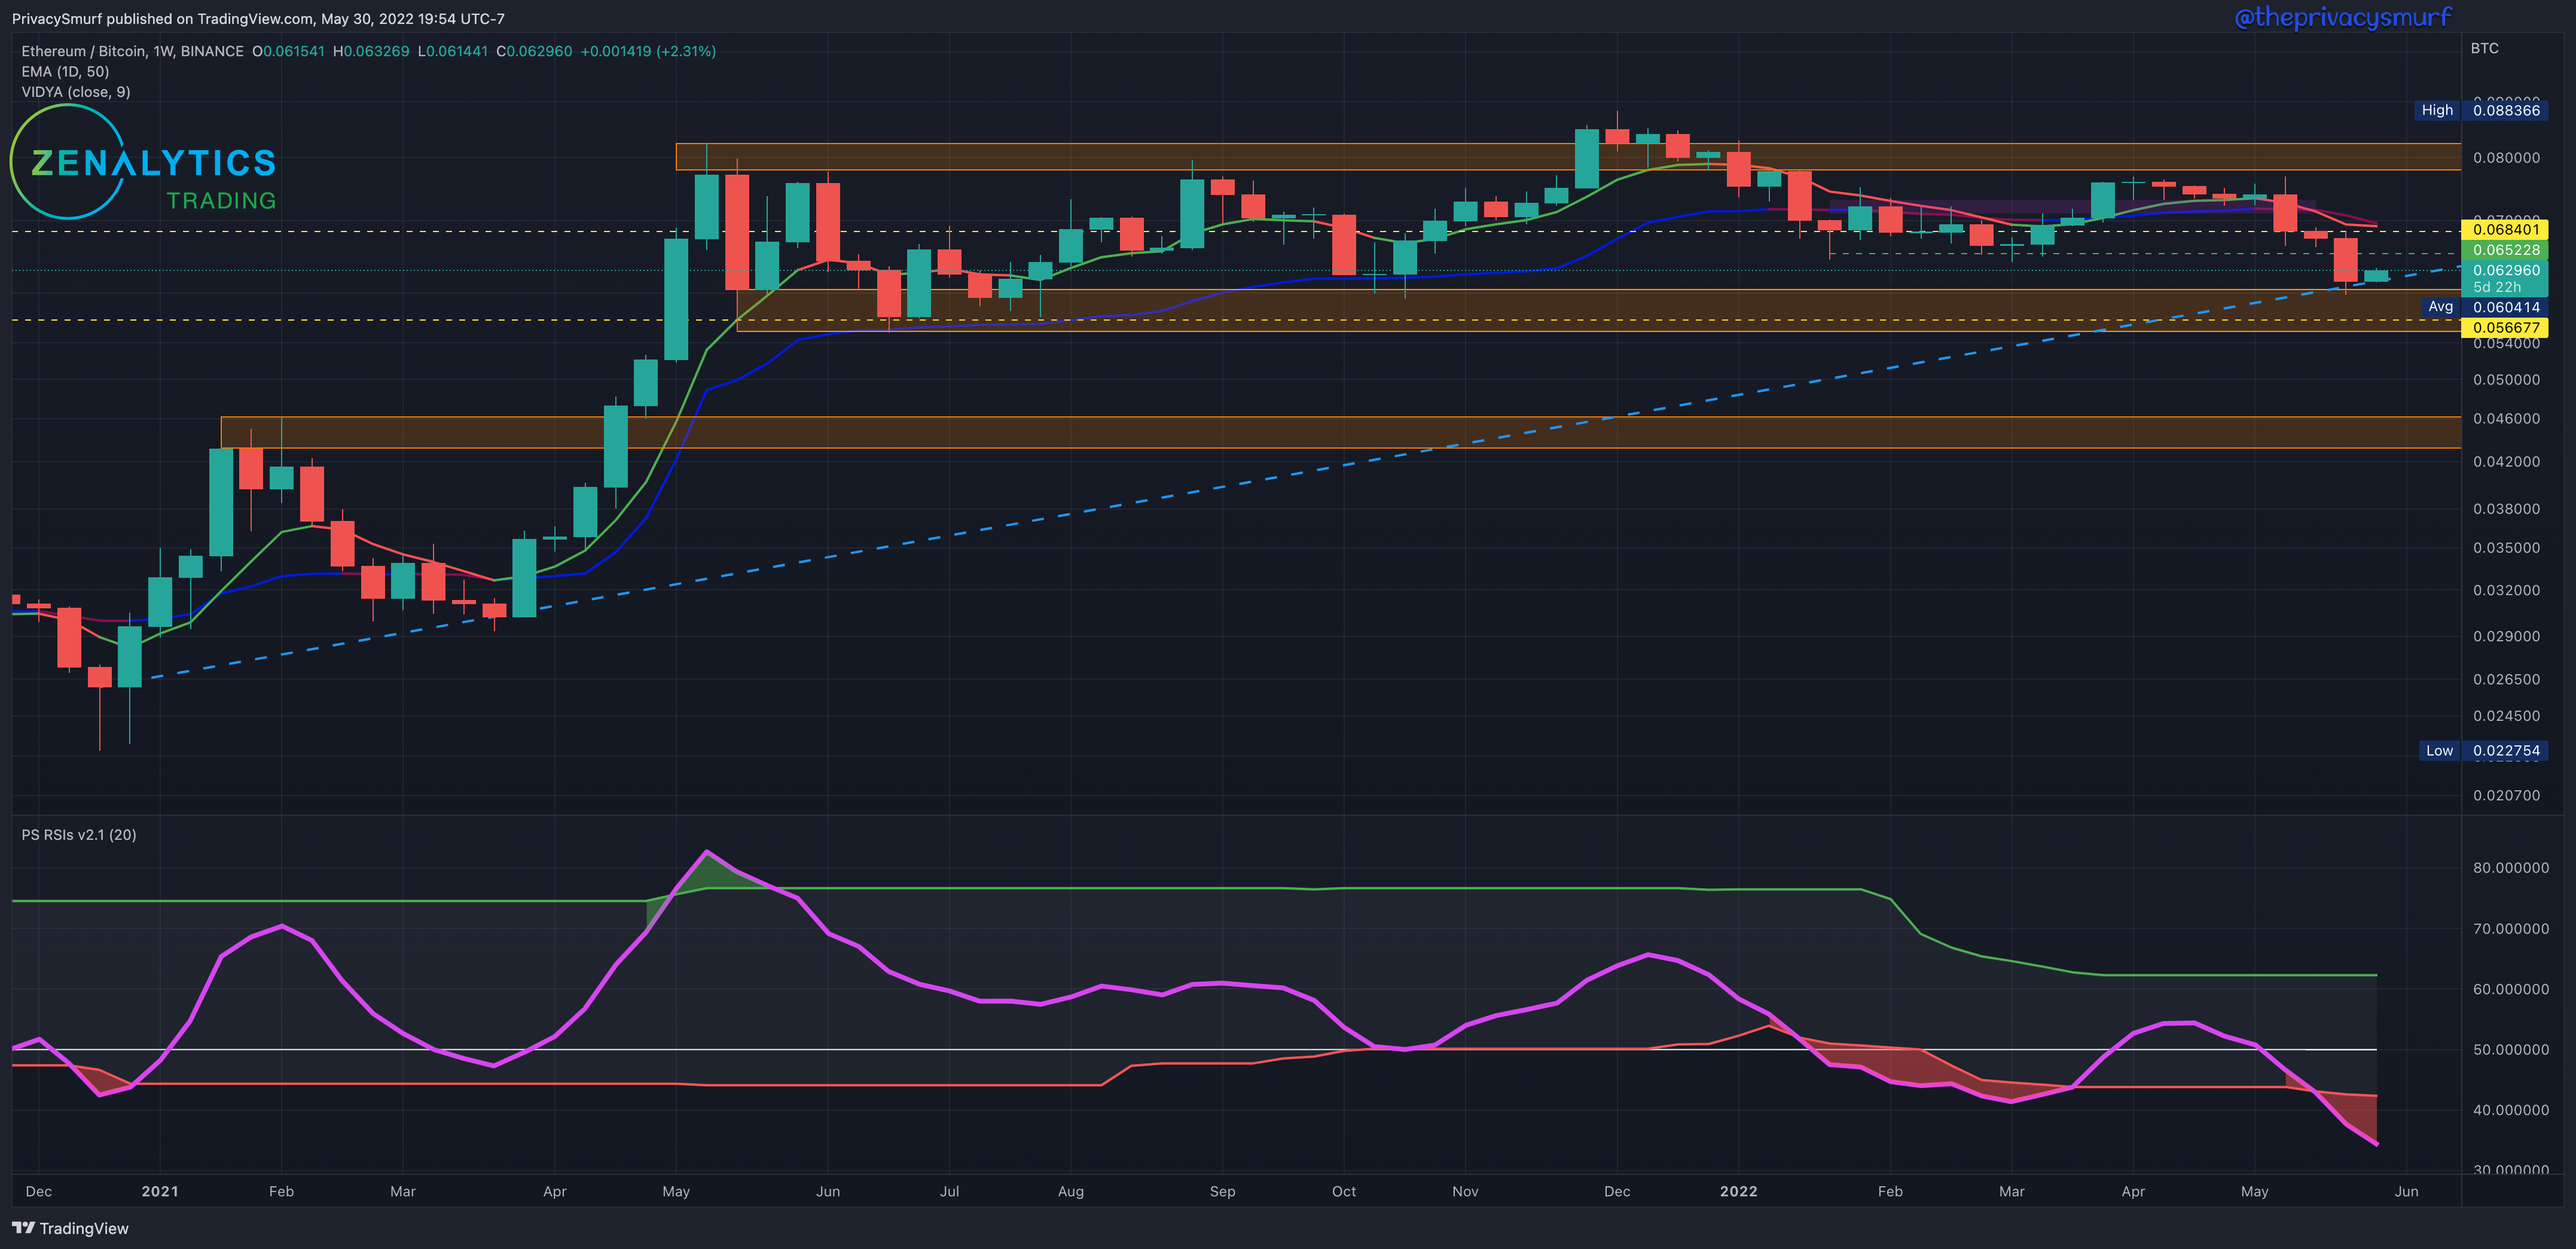
Not in the right section but zooming out a bit on the weekly chart we can see an older ascending trendline that added some extra weight to the horizontal support zone and helped catch the falling knife.
The RSI is trending in line with prices with no divergence so I don’t have any technical reasons at the moment to expect this price increase to be a reversal of the downtrend. The RSI curling back into the bands from the bottom suggests exhaustion of the accelerated downtrend and some slight relief. Resistance will likely come in at the 0.0652 and 0.0684 levels. I wouldn’t anticipate anything higher than the top level and/or the 50-Day EMA which is currently just above the higher resistance level. While the top adaptive band on the RSI is moving down towards the midline which would be a good sign of upwards volatility on a break above, the lack of divergence on the charts tempers my expectations. I’m not convinced yet that the bottom is in for the ETH/BTC chart in the short to mid-term. Ideally, we set a lower low with the RSI continuing higher to set up bullish divergence. There are still lower supports to prevent more severe bearishness with one coming in at the 0.058 level.
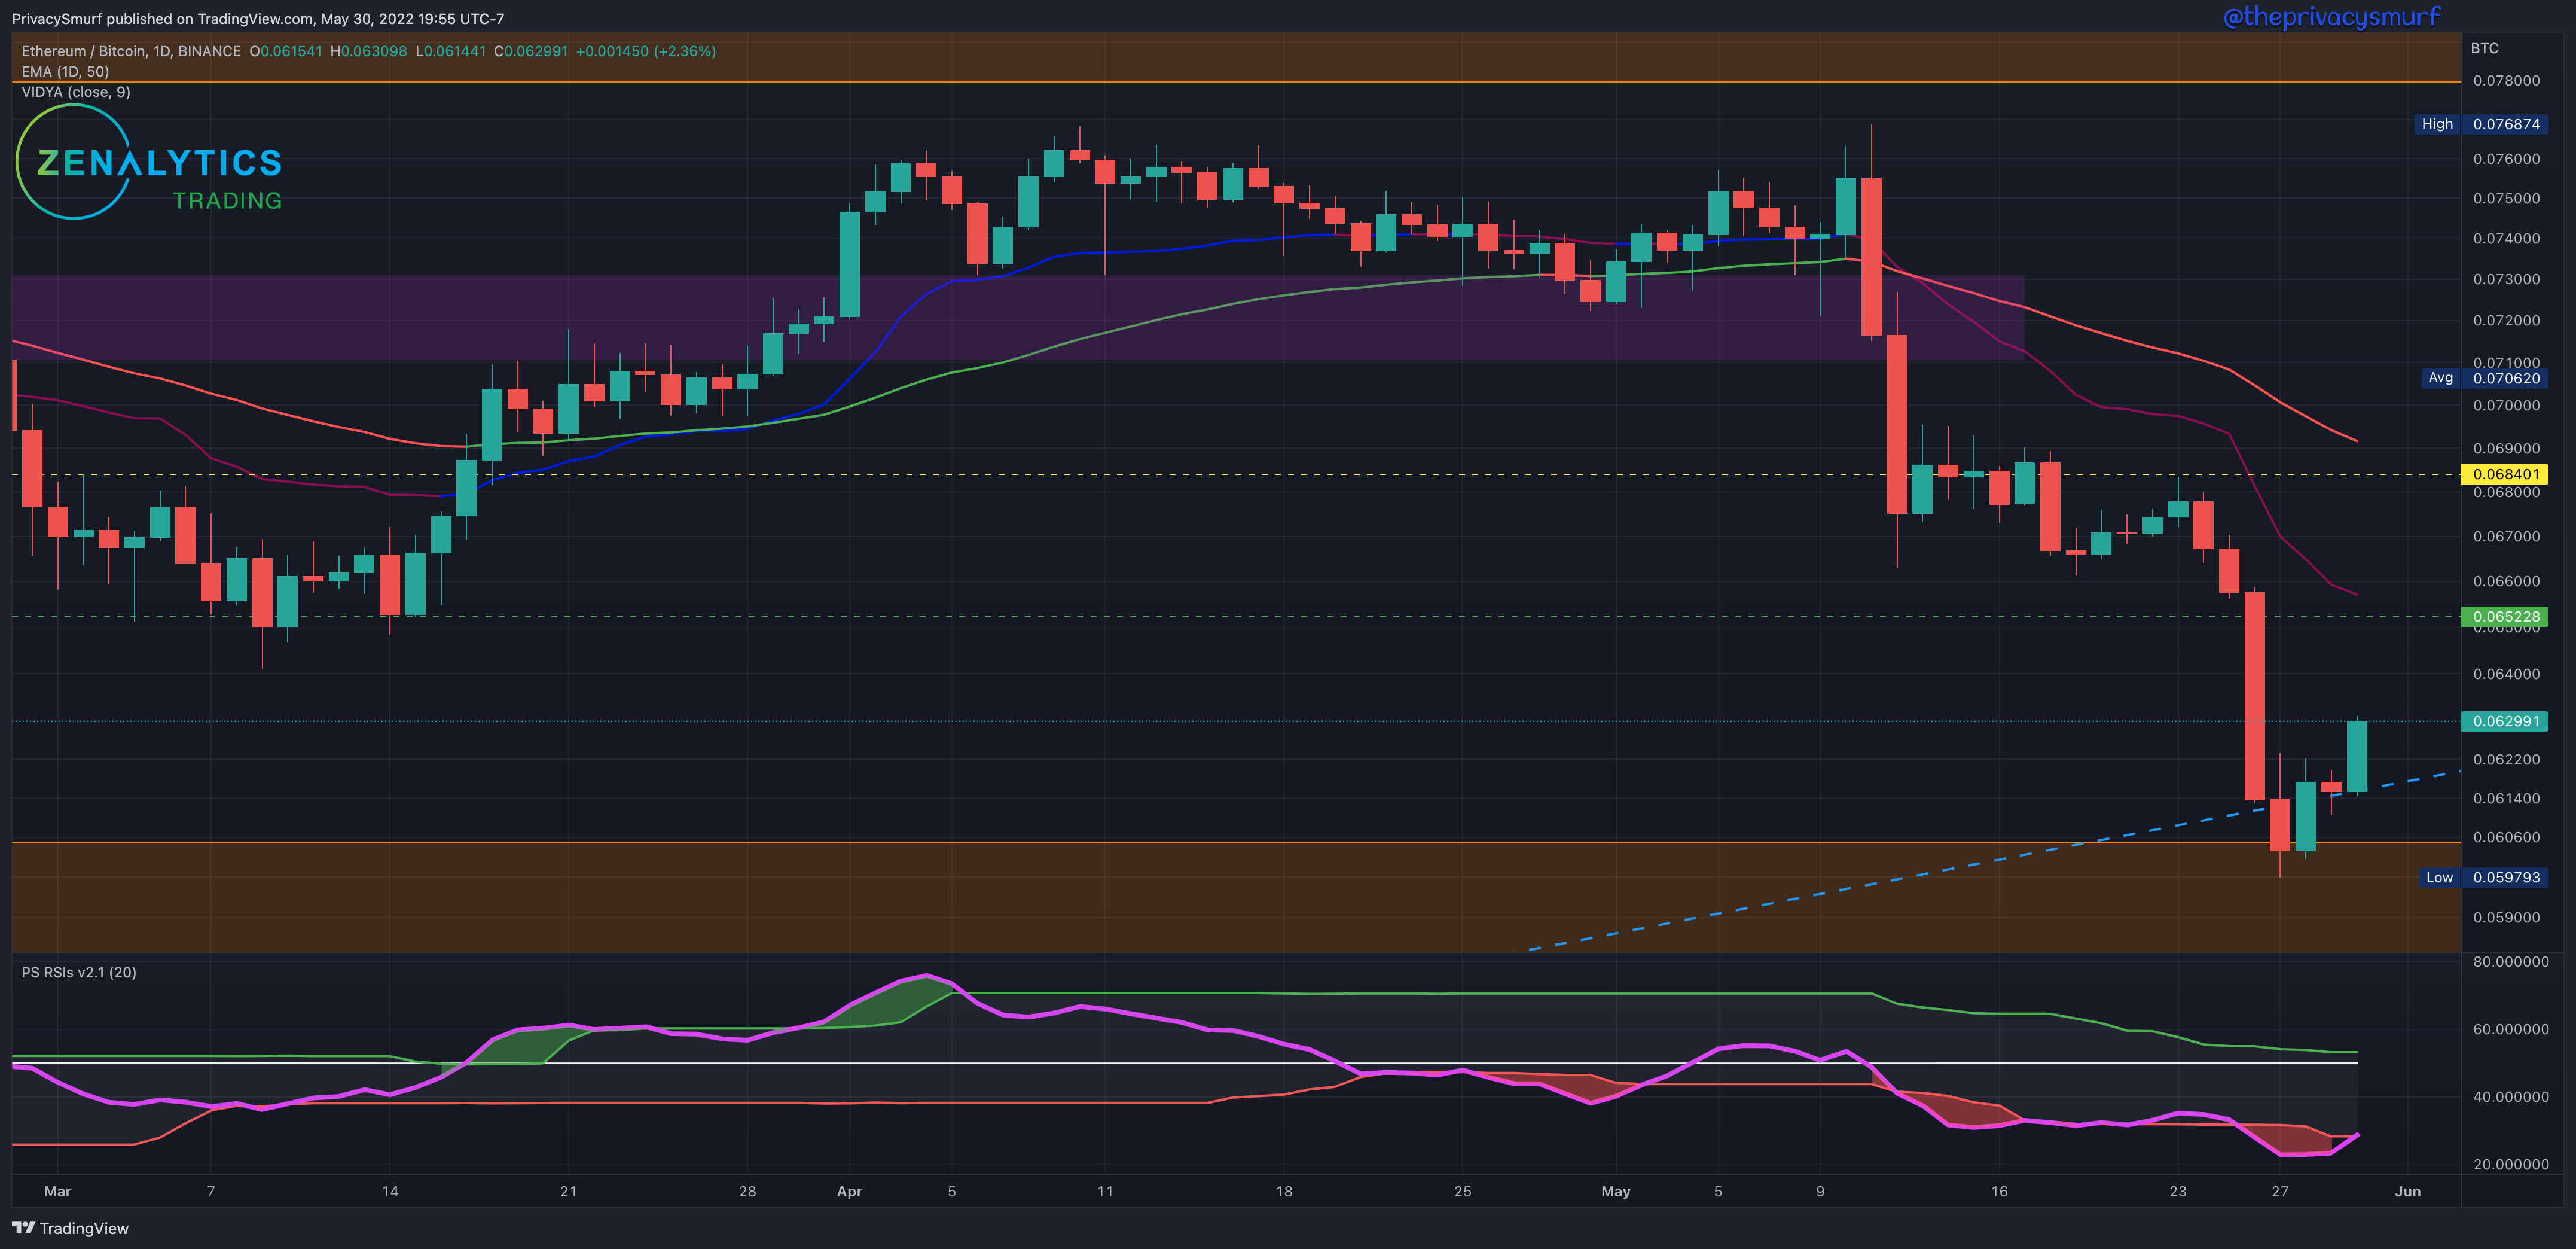
ETH/USDT Weekly Structure
https://www.tradingview.com/chart/JPTp0aXw/

The same picture here on the ETH weekly chart, a firm downtrend and a recent break of market structure support. The next market structure support comes in at $1419. Following the procedure dictated in the BTC weekly chart currently, the weekly close of $1813 is unconfirmed market support. Two green candles with a close above $2420 will confirm $1813 as market structure support. The next market structure resistance is at $3521. Similar to BTC, the trend is down and there’s no desire to add heavy into ETH for me at the moment given the structure of the market, however, a DCA purchase at $1419 and $1232 being former supports offer two locations of value to add to long term holds without regards to market timing.
ETH/USDT Daily Chart
https://www.tradingview.com/chart/xbB6lkZu/
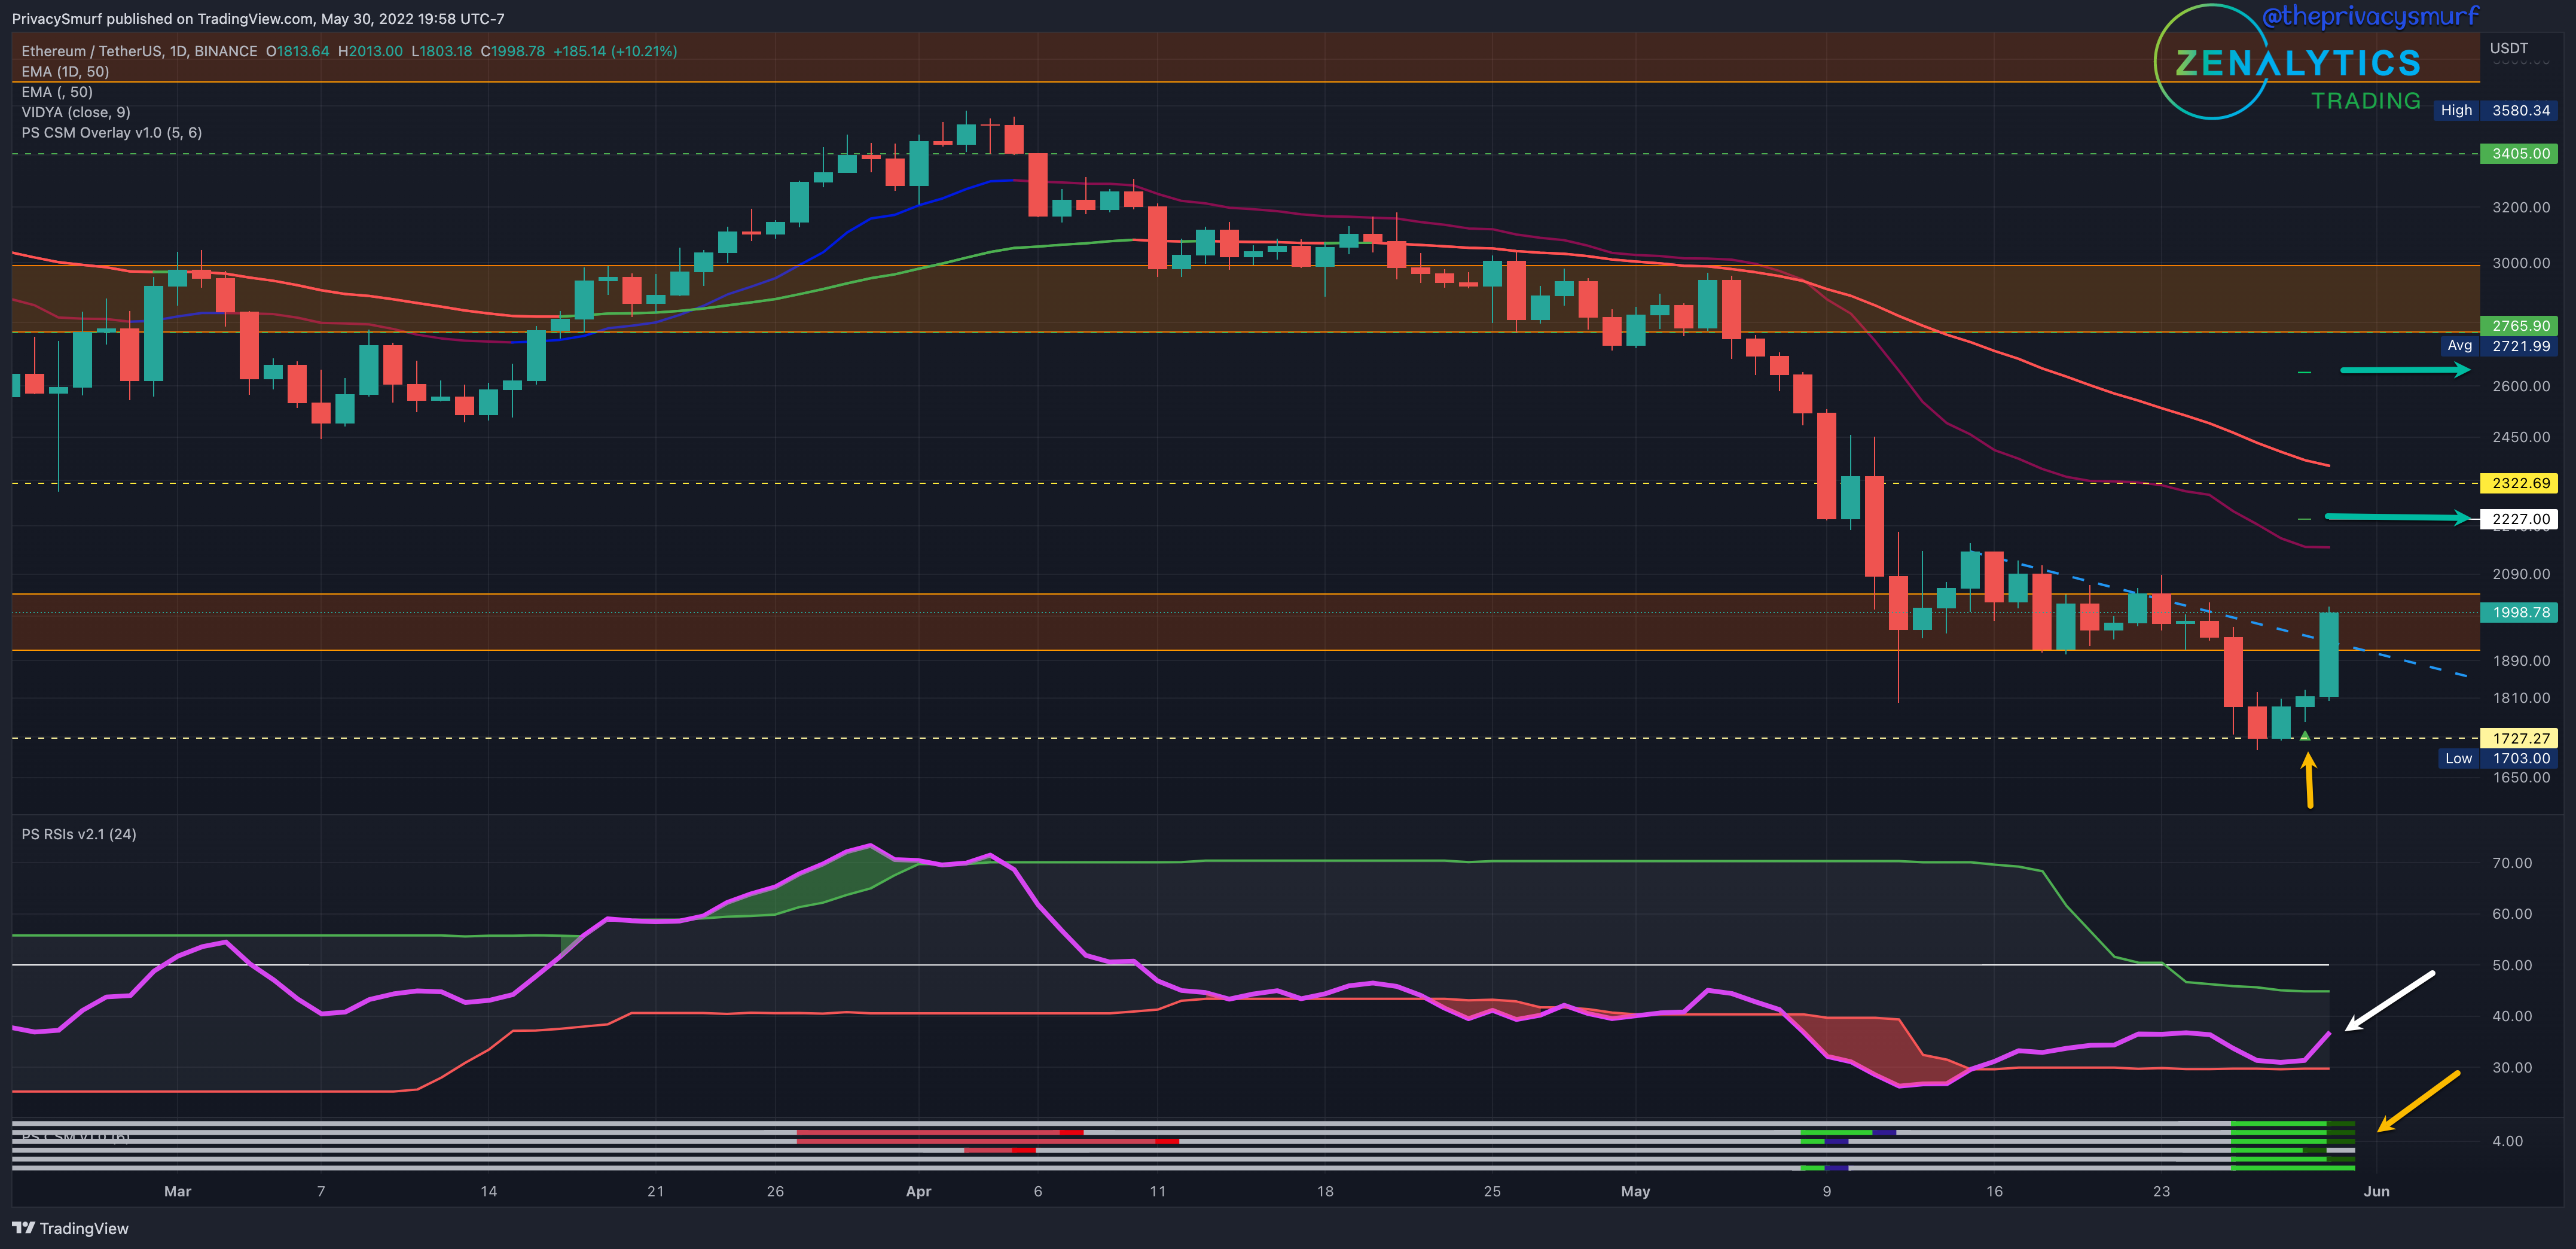
While the RSI on ETH is much lower (white arrow) than BTC is registering it is in bullish divergence where BTC is not. My custom indicator at the bottom of the chart, the Correction Strength Meter, shows light green lines signifying bullish setups on multiple price action oscillators. The dark green marks at the end signal the entry conditions for a bullish correction trade that occurred Sunday at market close with targets plotted at $2227 and just over $2600. This is a risky setup as the RSI is still very bearish even though the adaptive top band is below the midline which is ideal for a bullish trade setup. It is slightly benefited by the confluence of the breakout from the descending triangle but I would either wait for a positive retest of the ascending trendline for support, a break of horizontal resistance around $2050, or for the RSI to close above the top band and/or midline to take a bullish trade. In that event it’s likely the 1st target would be unappealing due to the risk to reward ratio so I’d be aiming for the second target or the high resistance at $2765 as long as I had a ratio over 1.5
Intraday levels will be posted tomorrow in the new Trading Range Tuesday in the paid subscriber section.
I’ll also add in ranges of some active altcoin as well to the new trading range series. Hope everyone is doing well.
@theprivacysmurf
Thank you PS! Cheers