

Sunday Synopsis #42: Movin' Right Along
Sunday Synopsis #42: Movin' Right Along
doog-a-doon doog-a-doon

Moving is such a time-consuming, stressful event but also really nice to see/have things footloose and fancy clutter-free and organized in the new spaces. I don’t think I’ve ever had my home this organized before. I hope I can maintain this for a while.
BTC/USDT Weekly Structure
https://www.tradingview.com/chart/4v8qizyI/
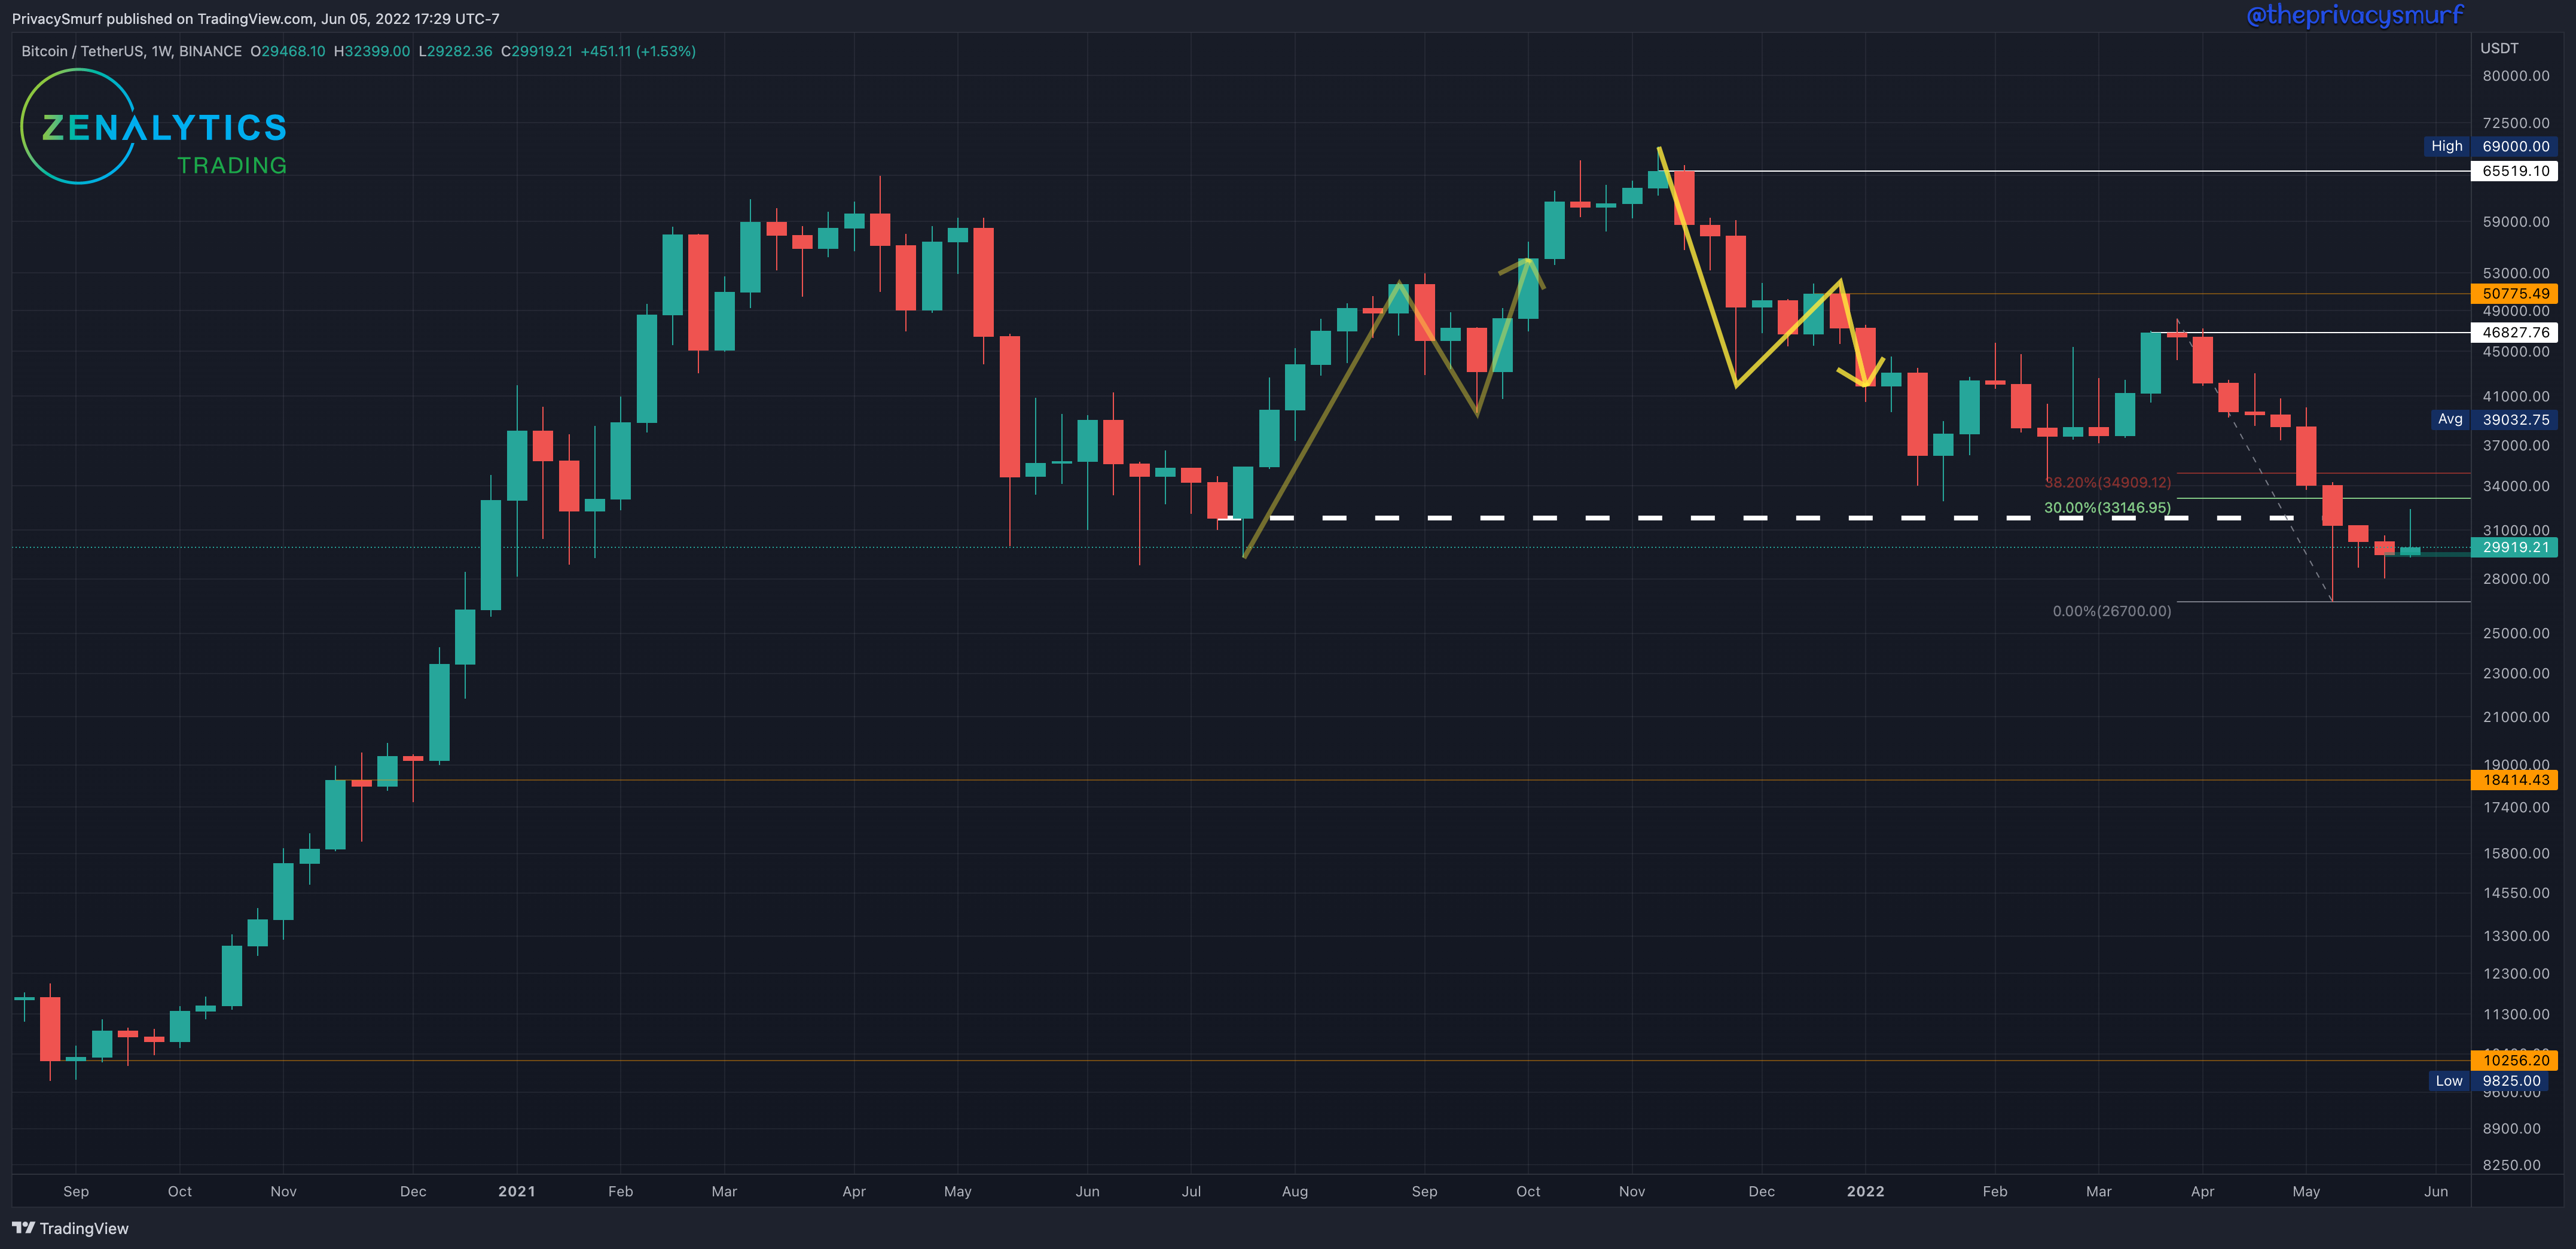
A very minor 1.5% bullish break in the downtrend this past week. Since this week closed higher the low close last week at $29468 is still the unconfirmed market support. A weekly high above $33146 (30% retracement) will qualify as a “meaningful retracement” in the downtrend and not market noise. Another bullish candle with a weekly close above $34909 (.382 fib level) will confirm $29468 as market structure support. The candle closed as an inverted hammer candle. These can appear at the end of downtrends suggesting the potential for bullish reversal price continuation. The daily chart may have some insight into the likelihood.
From a long-term perspective, IMO there is little reason to make any moves aside from a new DCA buy if we start to break into new lows. The trend is still firmly established as down. I have no interest in building a large position until strength starts to show in the market. (Think something like a close over 34k, then a slight decline but not lower closes than 30k then another rally that closes above 34k again. While this sounds counterintuitive to buy when prices are going up, I personally don’t have any desire to buy weakness. Buying strength can prevent me from buying into dip after dip after dip after dip before the bottom is actually in.)
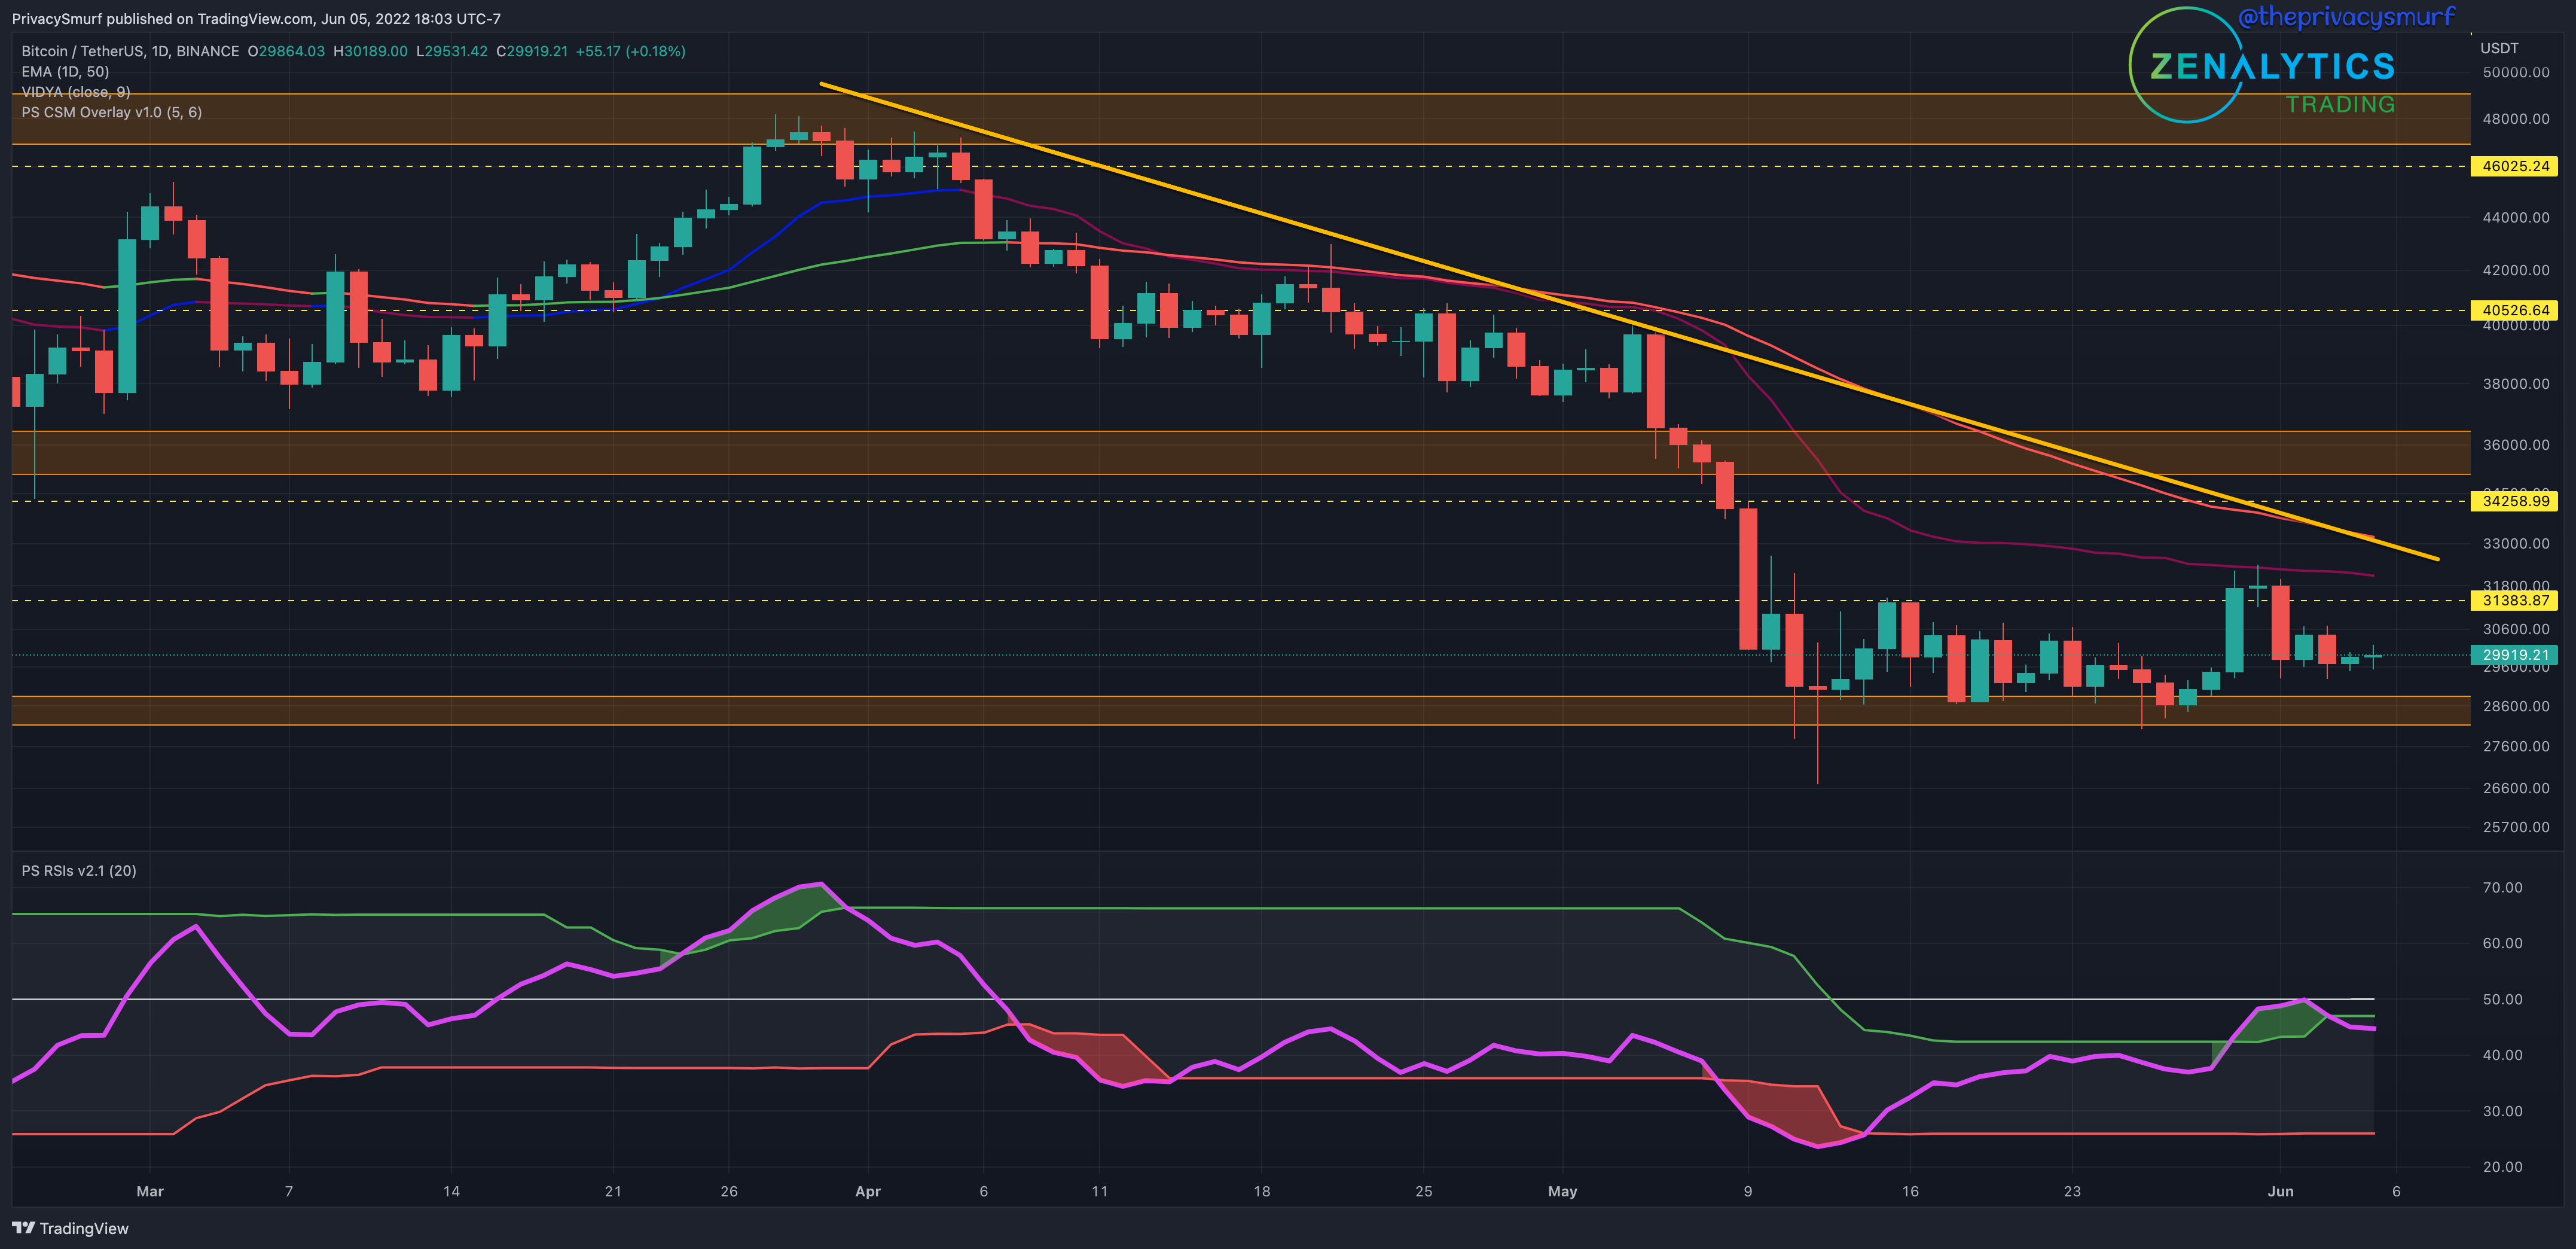
BTC/USDT Daily Chart
https://www.tradingview.com/chart/jjSdFW4b/
From last week:
If the RSI is rejected from the midline I would expect to see prices come back down to test the 30k level that was broken for support. Hopefully, this series creates the high, and higher low we need to springboard into a bullish trend.
This scenario played out quickly muting the rally and then consolidating around the $29 to $30k level. This consolidation is taking place higher than recent lows so a break above the 32k level will fit the mold of a new daily bullish trend (low, high, higher low, higher high). This would be likely if the RSI breaks back above the top band and the midline. a long-held descending trendline is mirroring the placement of the 50-Day EMA at around $33k so I’d expect resistance to come in there. There are multiple old supports turned resistance to break above in the short term so I’m not expecting prices to run away bullish with the ceiling likely around $36k. The floor is still at $29k.
Intraday levels will be posted in the new Trading Range Tuesday in the paid subscriber section.
ETH/BTC Weekly Structure
https://www.tradingview.com/chart/sacHlXOv/
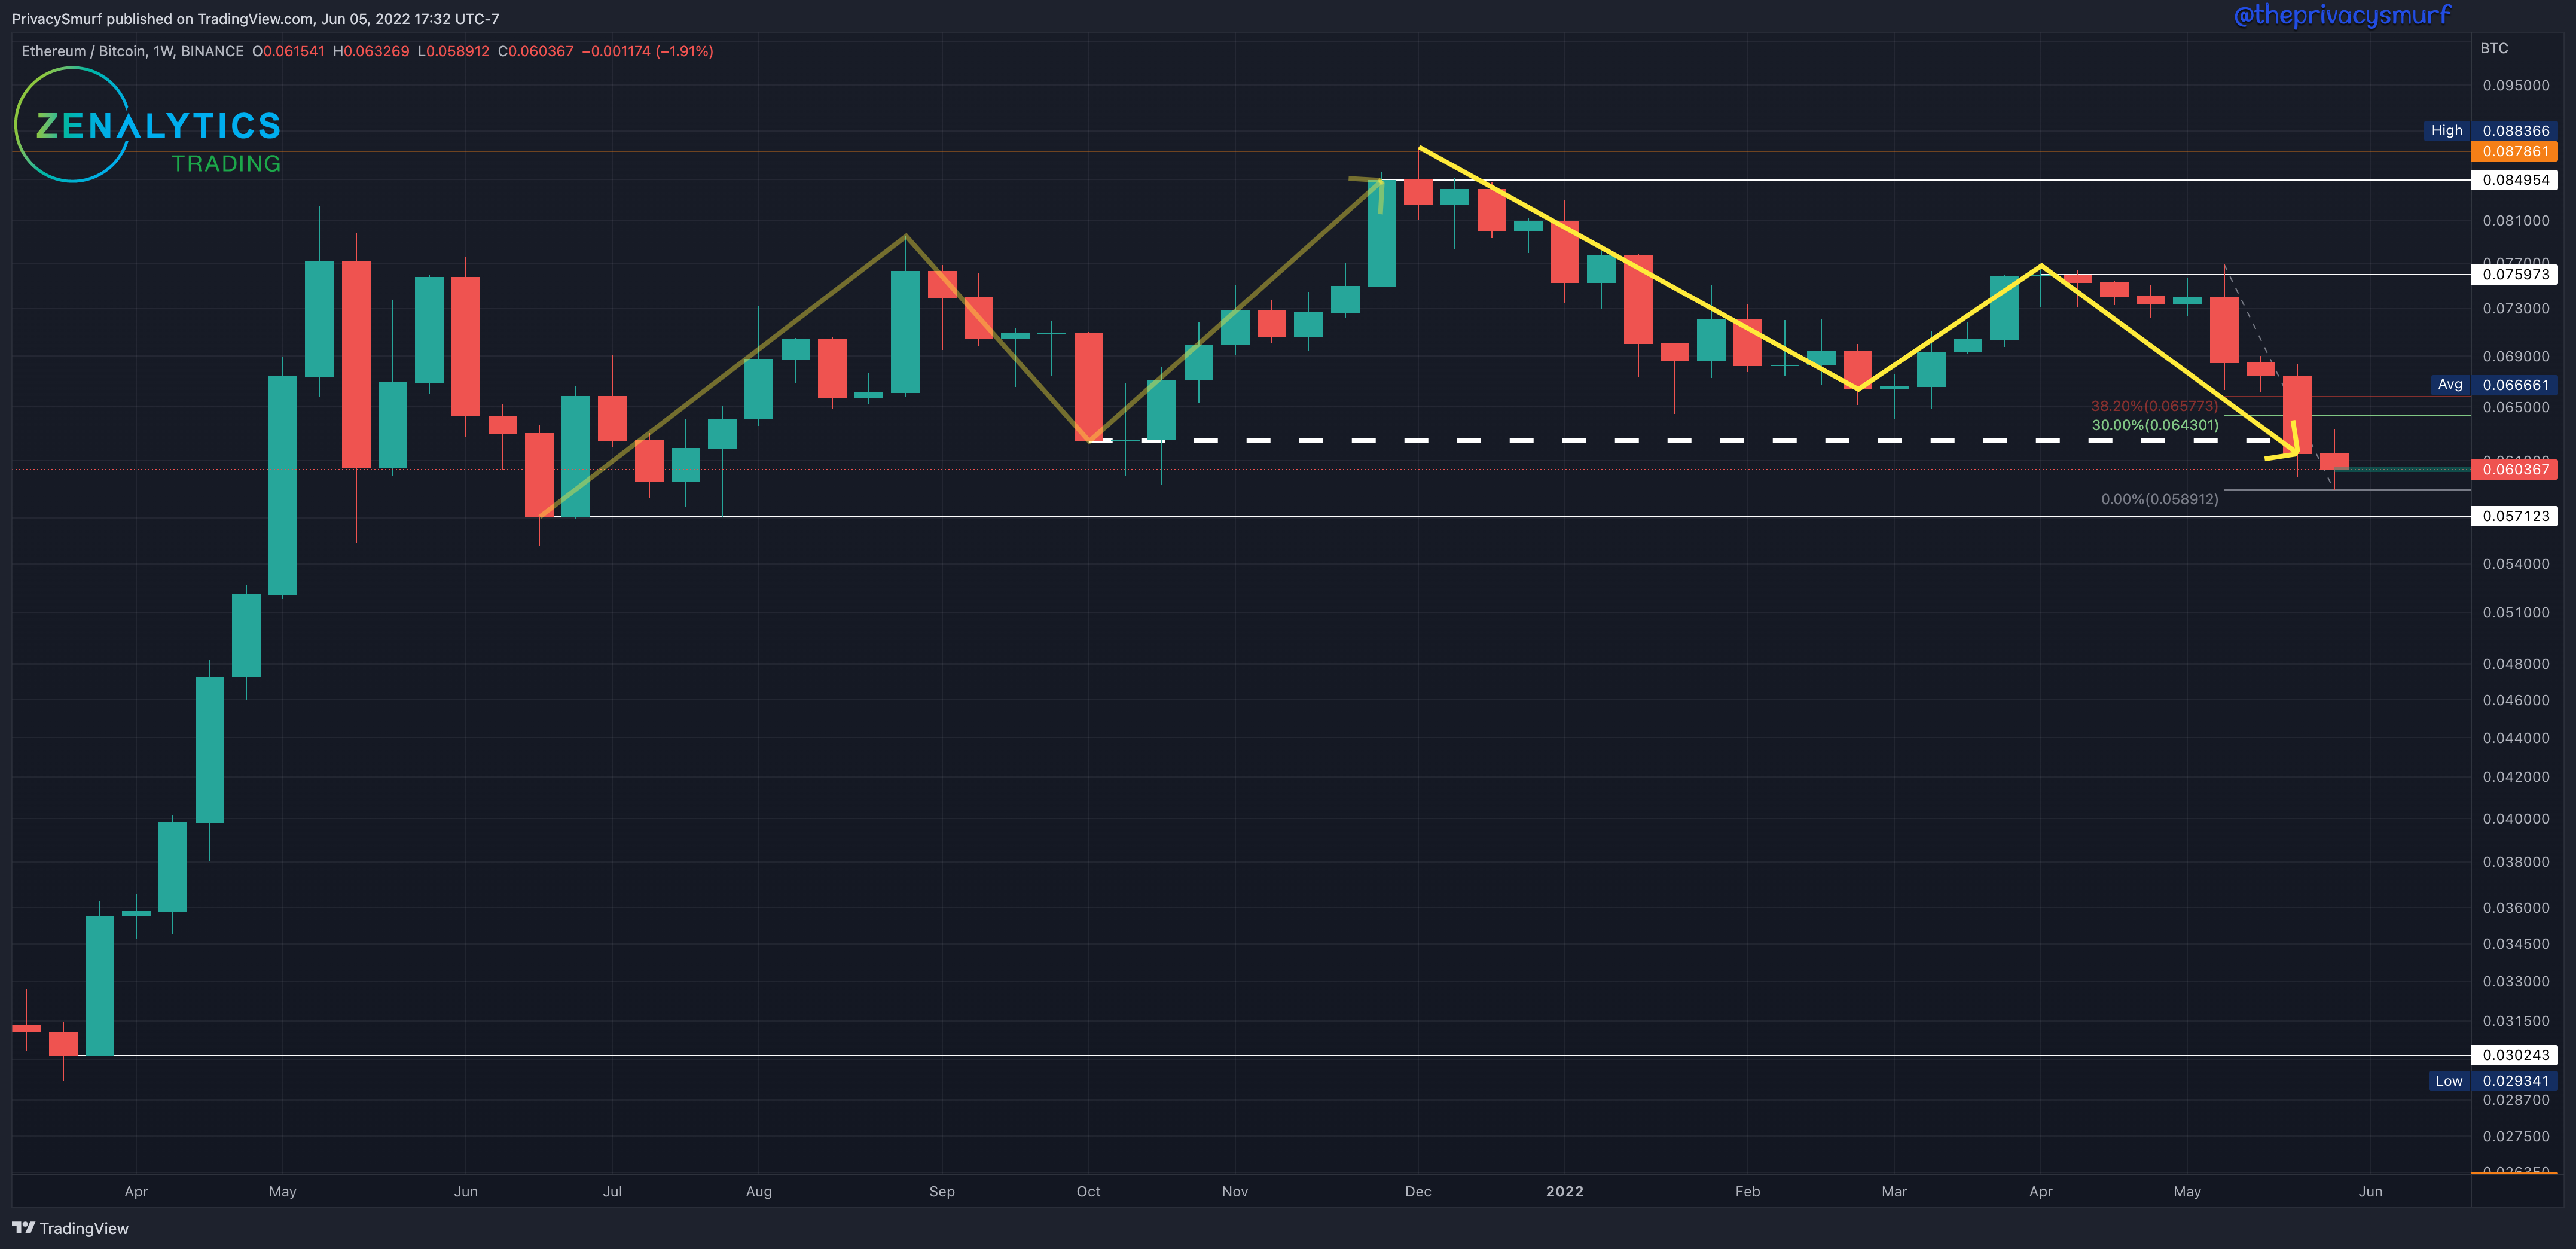
With the ETH/BTC chart closing below last week’s 0.0615 level continues bearishness. Being a lower close this week 0.0603 is the new unconfirmed market support. This past week also saw a new lower low so the fib retracement range is extended to reflect the new low. A high above 0.0643 registers as a “meaning retracement” and not market noise with the new adjustments. Two candles with a close above 0.0657 will confirm 0.0603 as market structure support. The next lower confirmed market structure support is at 0.057 (where I have a DCA buy order to purchase with some HODL BTC, not meant to time the market) with the next resistance at 0.0759. From a long-term perspective, similar to BTC, the trend is down with no signs of stopping on this chart and there’s no desire to add heavy into ETH for me at the moment given the structure of the market.
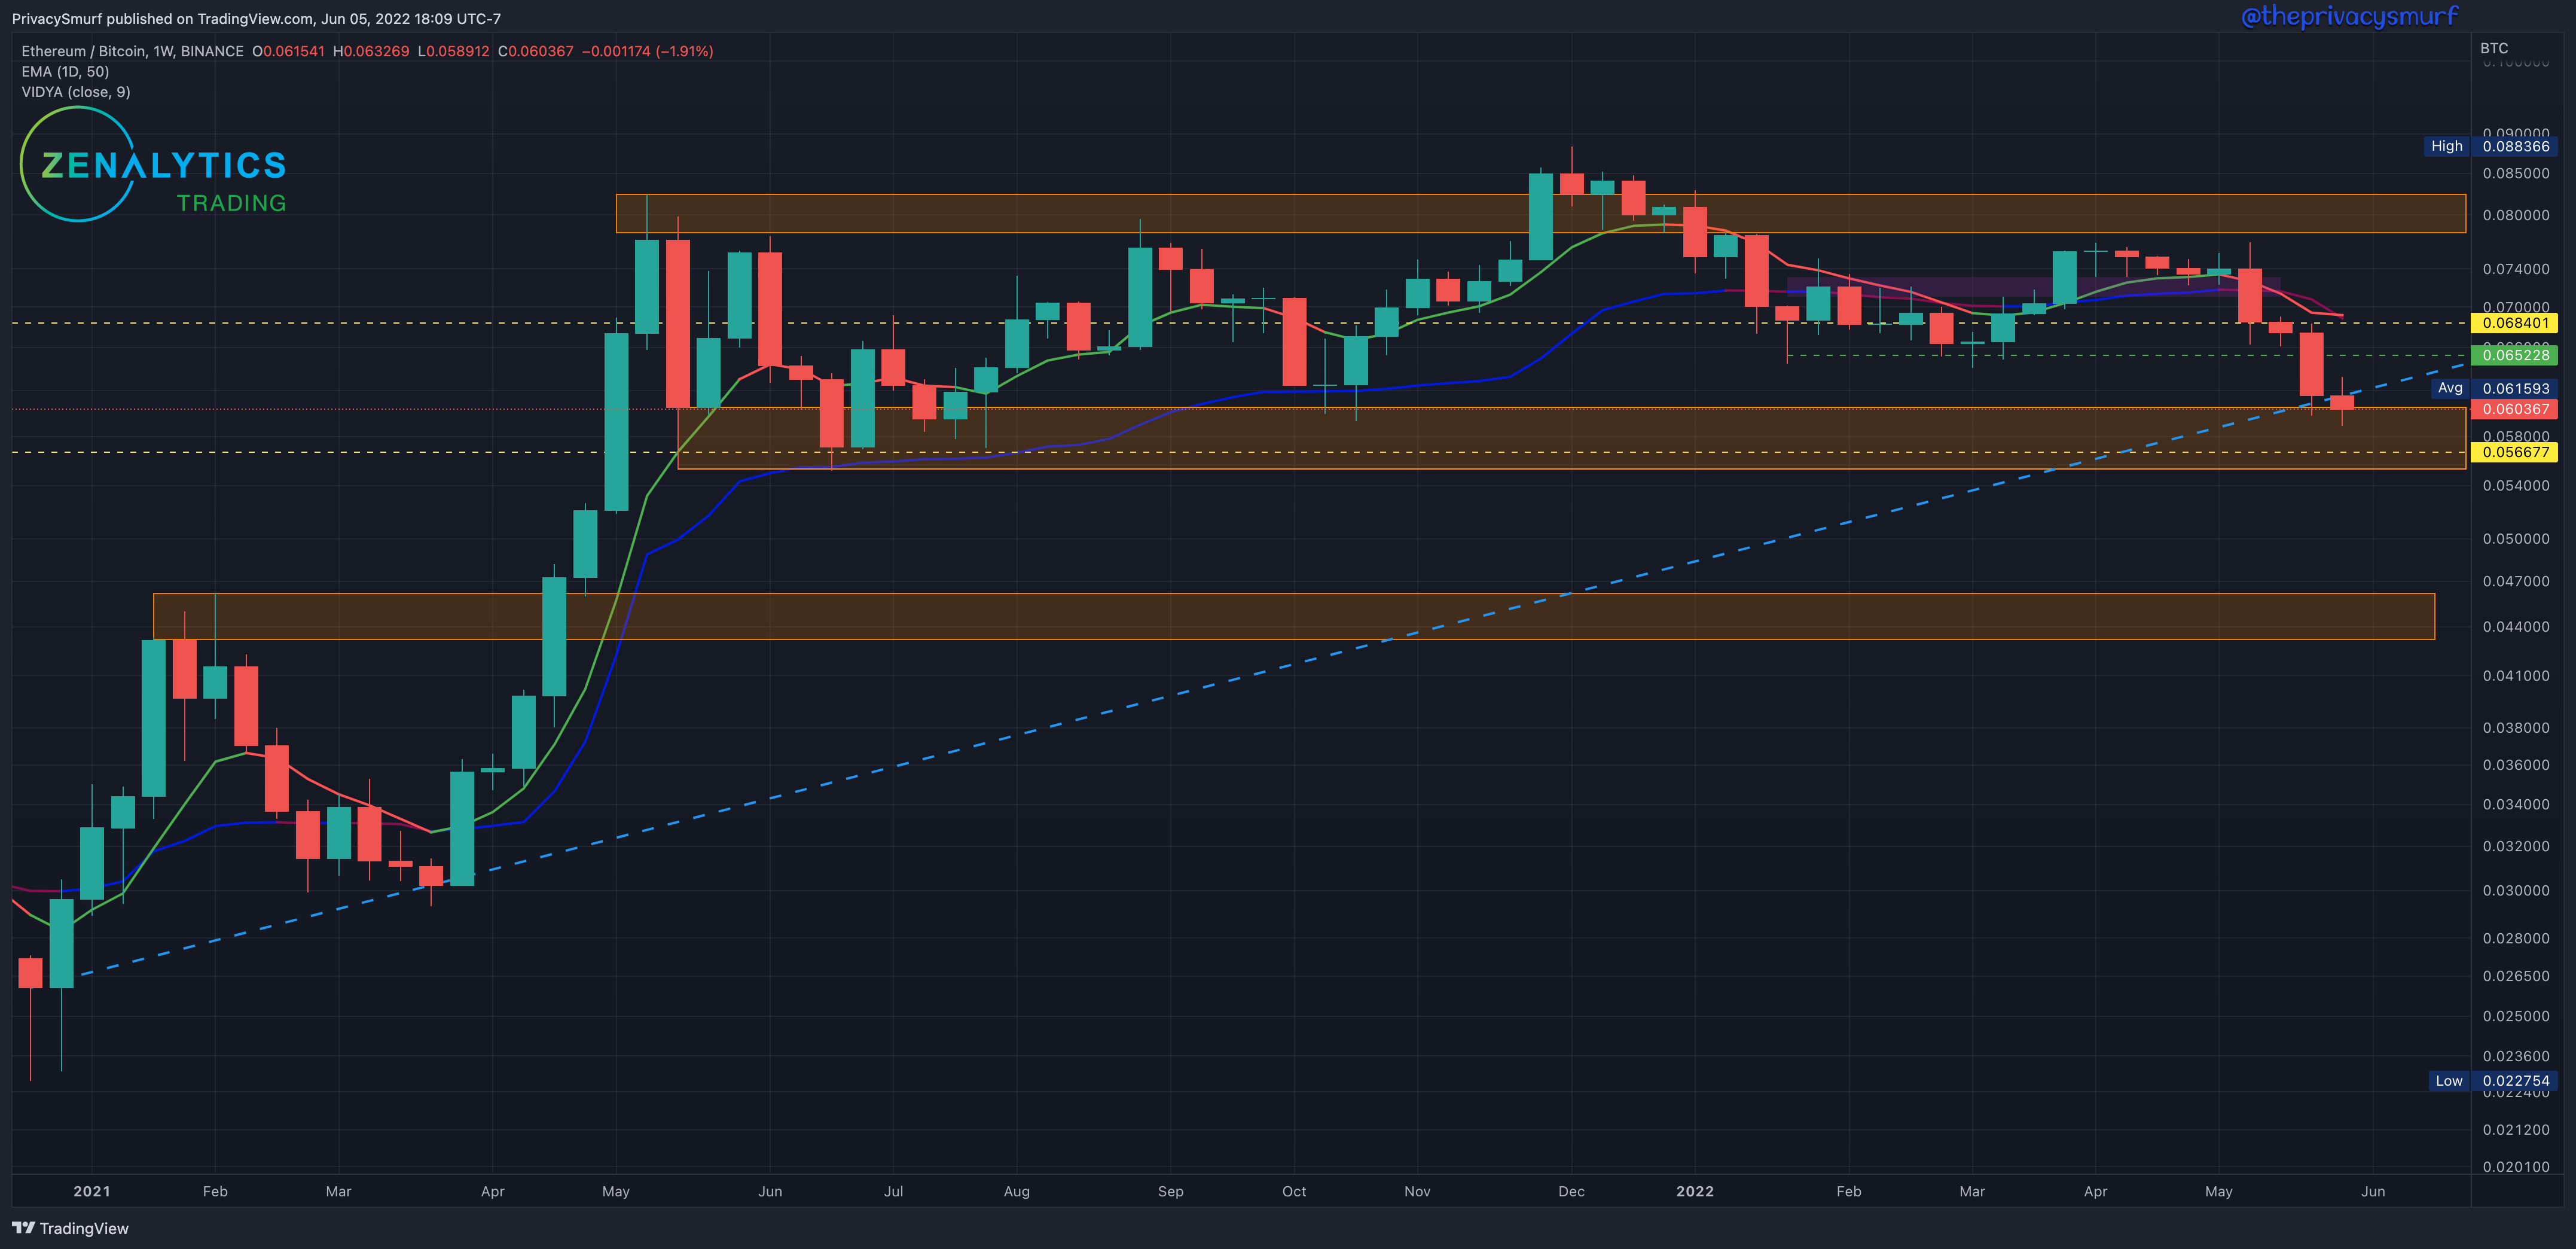
ETH/BTC Daily Chart
https://www.tradingview.com/chart/gTkSjkj6/
From last week:
… zooming out a bit on the weekly chart we can see an older ascending trendline that added some extra weight to the horizontal support zone…
The trendline didn’t hold for the weekly close but the support zone is still in play. From a discretionary (subjective) perspective I wouldn’t count the trendline as broken yet but there may be some time consolidating under it.

Last week was on point:
… The RSI is trending in line with prices with no divergence so I don’t have any technical reasons at the moment to expect this price increase to be a reversal of the downtrend… I’m not convinced yet that the bottom is in for the ETH/BTC chart in the short to mid-term. Ideally, we set a lower low with the RSI continuing higher to set up bullish divergence.
The new lower low on the price chart came in with the RSI not matching with a new lower low showing the bullish divergence. My custom indicator (available for purchase), the Correction Strength Meter located at the bottom of the chart shows the bullish reversal conditions with the light green lines signifying multiple oscillators in bullish divergence. The trade signal from the CSM in the price chart overlay printed as well on Saturday with initial upside targets at 0.0625. This would coincide with a “retest” of the broken trendline and either confirm that break and continue down or show a fake breakdown and continue up to to the second target at 0.0647 and test the floor that was recently broken at 0.0652. I personally wouldn’t try to look further than the first target with the trend being down still and would either get out fully or start a trailing stop at reaching the first target. There may be some more downside or at the least consolidation before the trend is flipped bullish.
ETH/USDT Weekly Structure
https://www.tradingview.com/chart/JPTp0aXw/
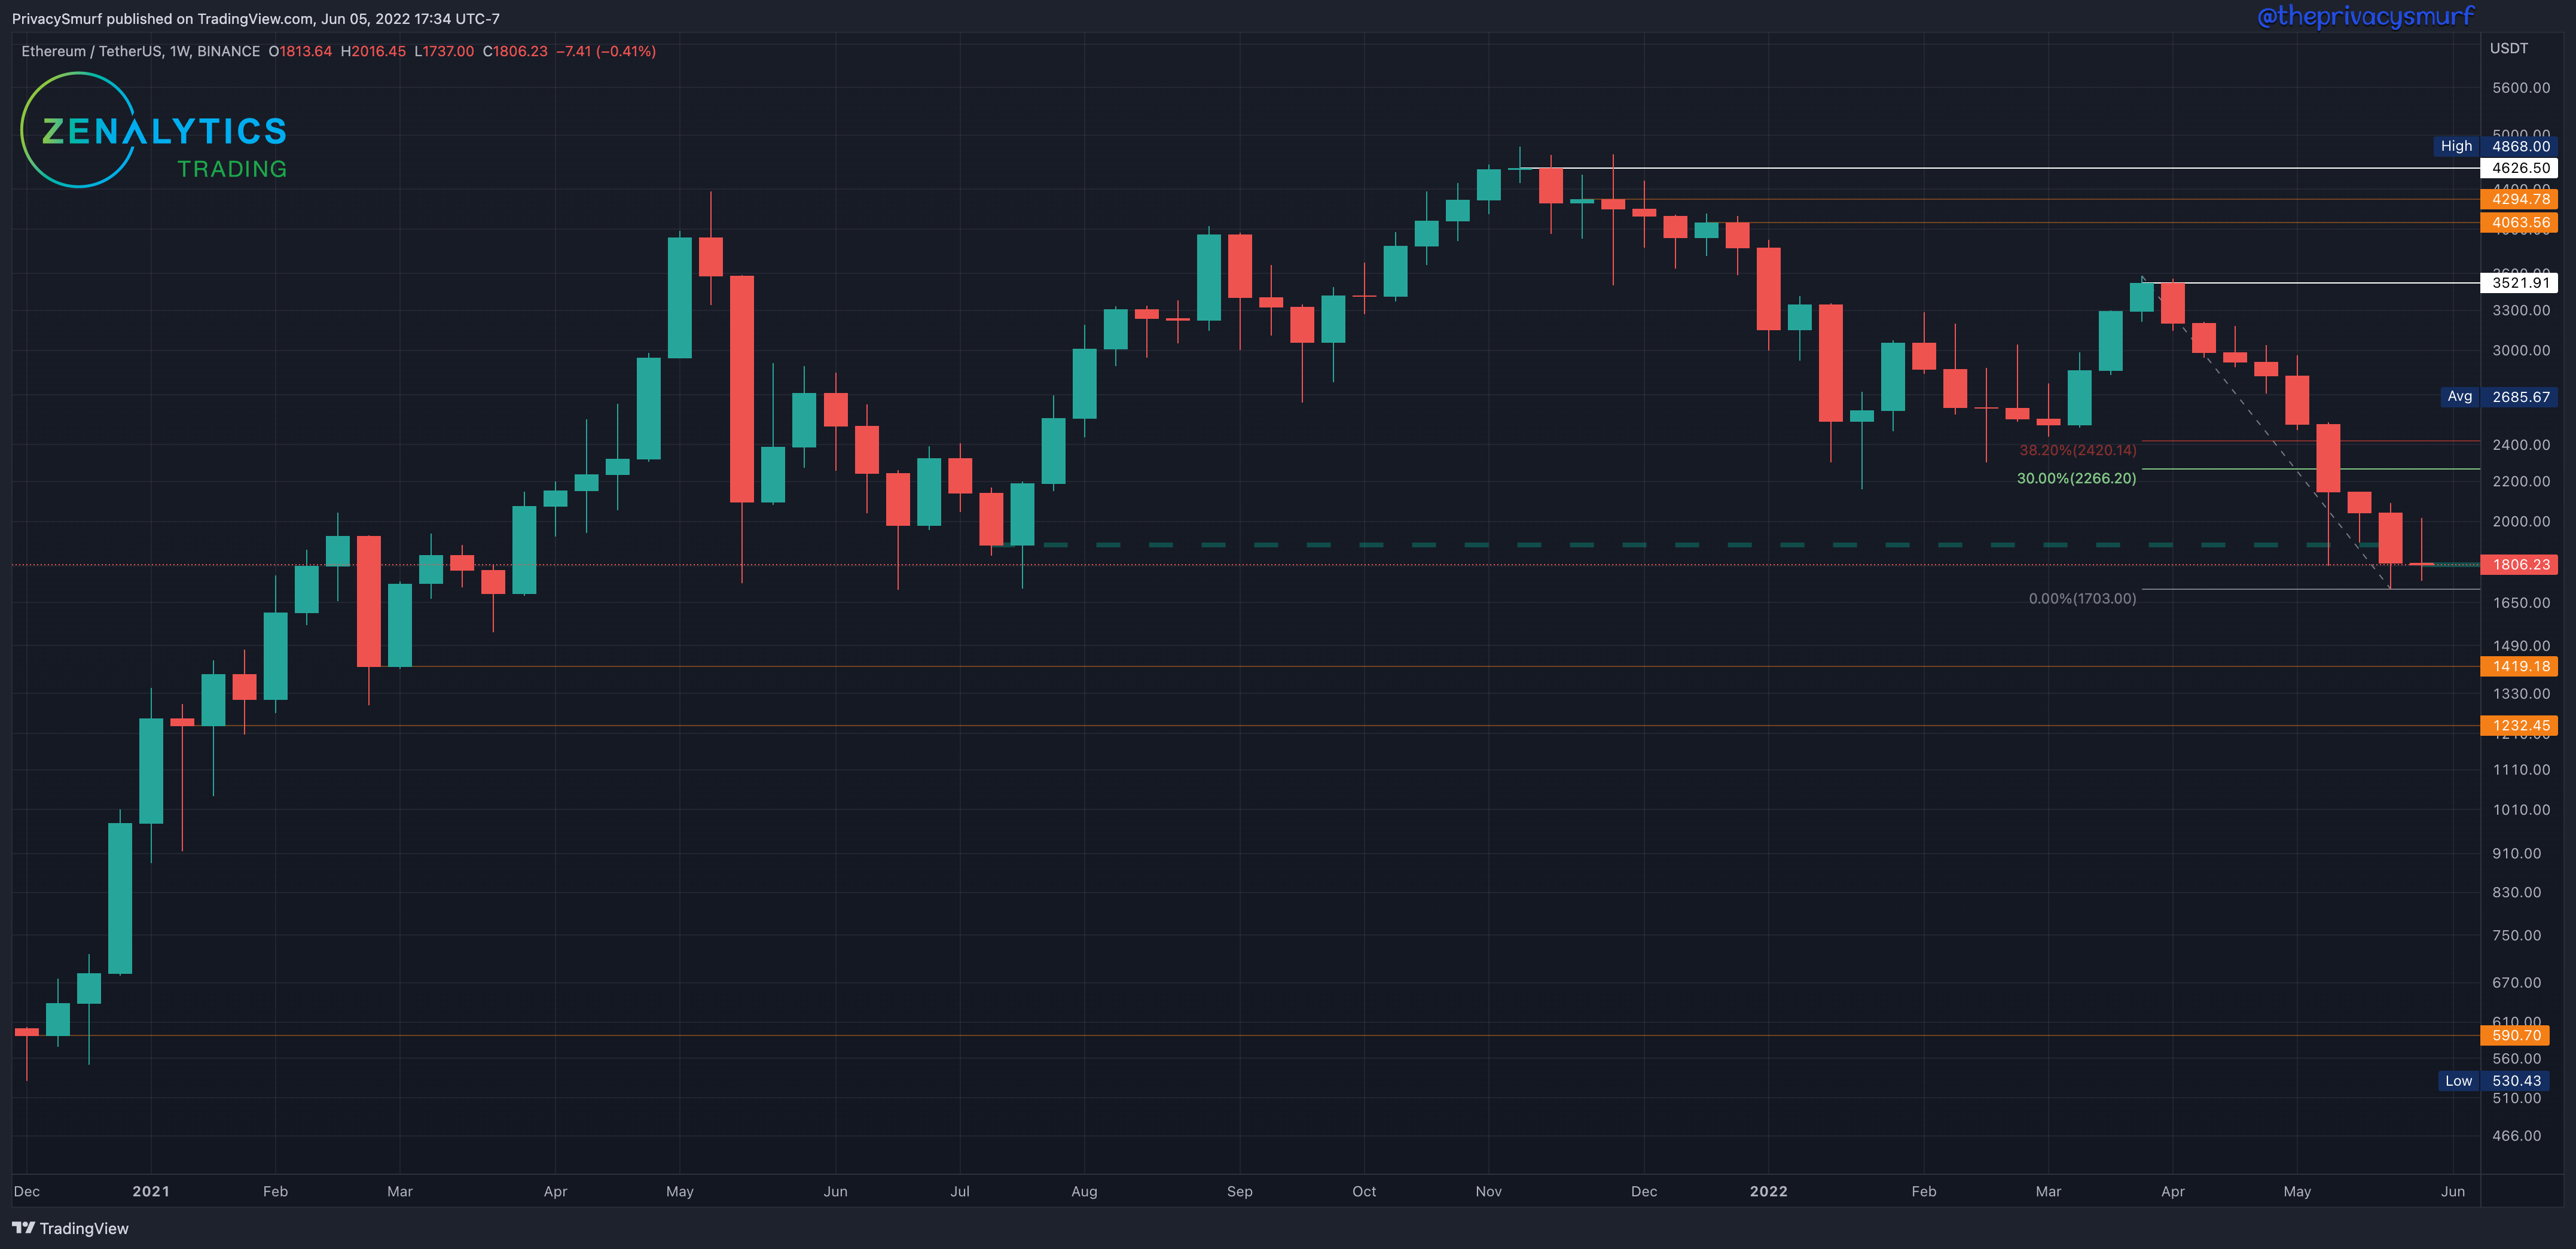
With the ETH chart closing below last week’s $1813 the trend continues bearish. Being a lower close this week $1806 is the new unconfirmed market support. This past week held lows above the last adjustment of the fib anchor so measurements are the same. A high above $2266 registers as a “meaning retracement” and not market noise. Two green candles with a close above $2420 will confirm $1806 as market structure support. The next market structure resistance is at $3521. From a long-term perspective, similar to BTC, the trend is down and there’s no desire to add heavy into ETH for me at the moment given the structure of the market, however, a DCA purchase at $1419 and $1232 being former supports offer two locations of value to add to long term holds without regards to market timing.
ETH/USDT Daily Chart
https://www.tradingview.com/chart/xbB6lkZu/
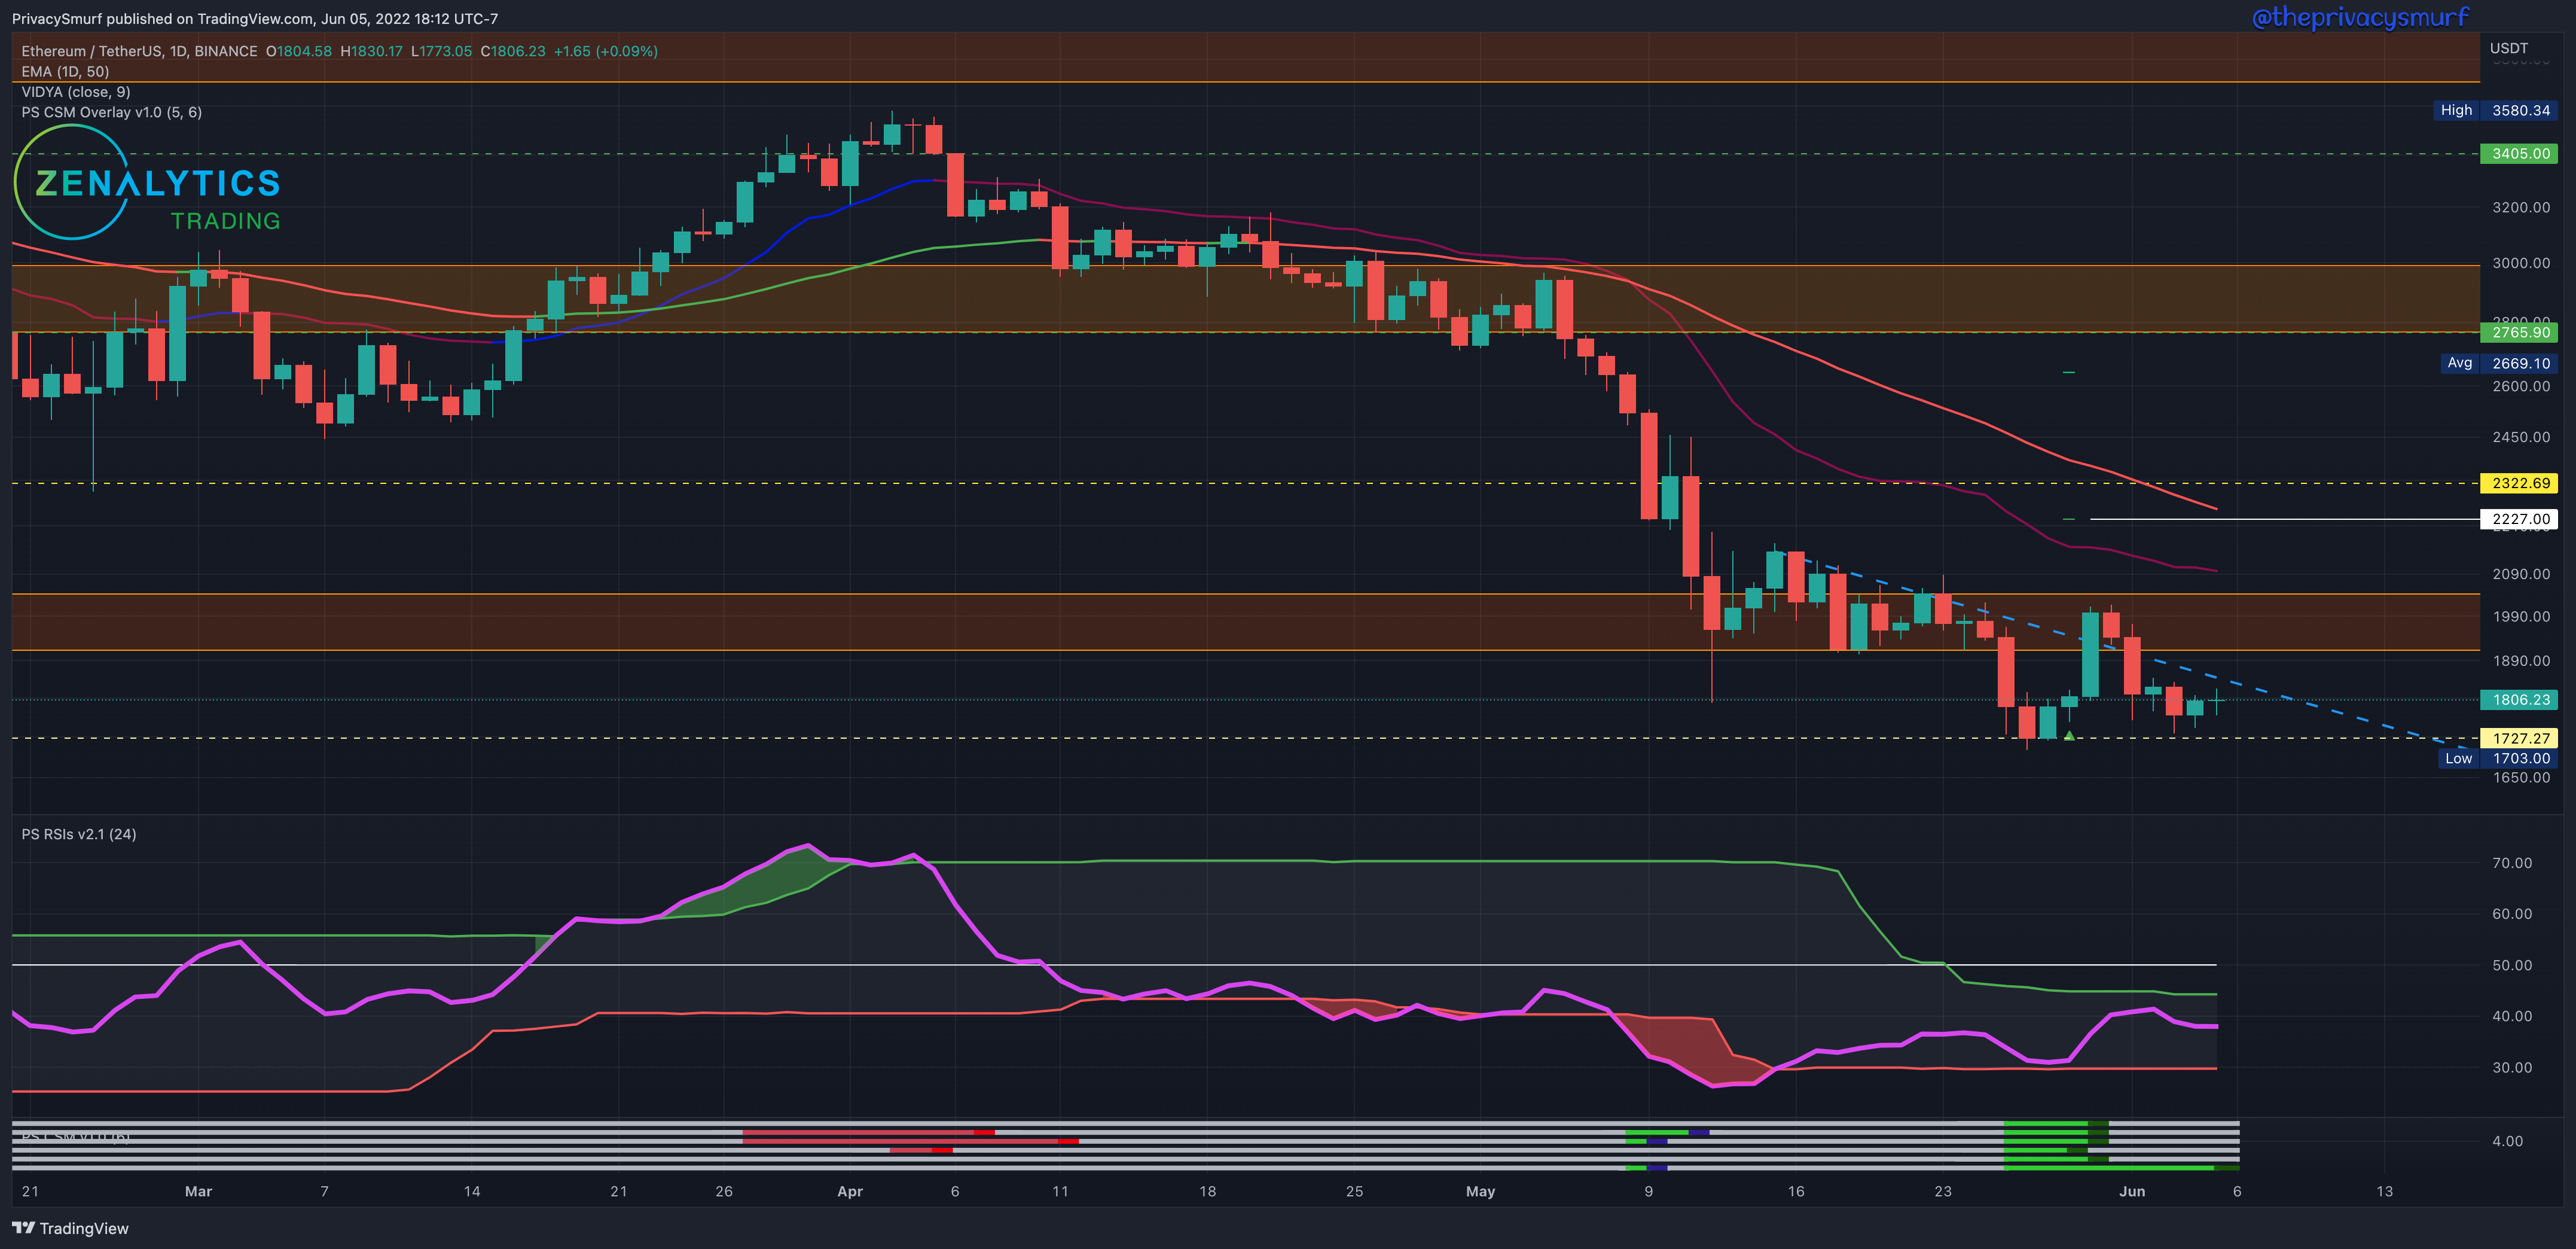
I’m going to repost all of last week’s commentary with the bolded portion being the focus.
While the RSI on ETH is much lower (white arrow) than BTC is registering it is in bullish divergence where BTC is not. My custom indicator at the bottom of the chart, the Correction Strength Meter, shows light green lines signifying bullish setups on multiple price action oscillators. The dark green marks at the end signal the entry conditions for a bullish correction trade that occurred Sunday at market close with targets plotted at $2227 and just over $2600. This is a risky setup as the RSI is still very bearish even though the adaptive top band is below the midline which is ideal for a bullish trade setup. It is slightly benefited by the confluence of the breakout from the descending triangle but I would either wait for a positive retest of the ascending trendline for support, a break of horizontal resistance around $2050, or for the RSI to close above the top band and/or midline to take a bullish trade. In that event it’s likely the 1st target would be unappealing due to the risk to reward ratio so I’d be aiming for the second target or the high resistance at $2765 as long as I had a ratio over 1.5.
None of those conditions I listed played out keeping me from entering a risky trade that didn’t hit its targets. If the trade was opened there’s still time for it to be hit but in the meantime, other opportunities with higher odds of success would likely appear. The bolded conditions still apply for a potential entry to a long trade. We are entering a point of confluence of the descending trendline and horizontal support. The odds of a bullish are slightly higher than bearish IMO with the RSI generally trending up with higher lows and higher highs and the bullish divergences and the placement of the adaptive top band below the midline. The trendline break may be a risky one but could be a profitable entry to the testing of the 50-Day EMA which is sitting about where the CSM target is ($2227)
Intraday levels will be posted tomorrow in the new Trading Range Tuesday in the paid subscriber section.
Thanks again for your patience. Being that I just passed my year mark this weekend for the newsletter I’ll make all the weekly posts free for everyone as a sort of celebration. Crazy to think it’s been that long already. Thanks for getting through these last few months of slowdown. I’ll make it worth it. I have been steadily building out my trading resources for the paid folks in a really cool app (notion) that I’ll be pushing out to a website. I think it will be very valuable and something I constantly update.
@theprivacysmurf