

Sunday Synopsis #43: Sweet Nothing
Sunday Synopsis #43: Sweet Nothing
I'm tired of hope with nothing to hold. I'm living on such sweet nothing.

With BTC in free fall it’s hard sometimes to ignore the price and keep the longer-term vision but even ‘so I'll put my faith in something unknown. I'm living on such sweet nothing.’
Bearish divergence targets from November and December on both the weekly and monthly charts are all but in the bag. That’s a great thing as the reversion to the mean is occurring. This has to happen before higher prices. We are only halfway down from the projections, but the second targets are not as solid statistically as the first targets.
My commentary from the last two Fear and Greed Friday posts is still where I think realistically we’ll see some bottoming if things get worse.

If you missed the Thursday post where I go over how I’ve adjusted the presentation of market structure read/watch that back here.
BTC/USDT Weekly Structure
https://www.tradingview.com/chart/4v8qizyI/
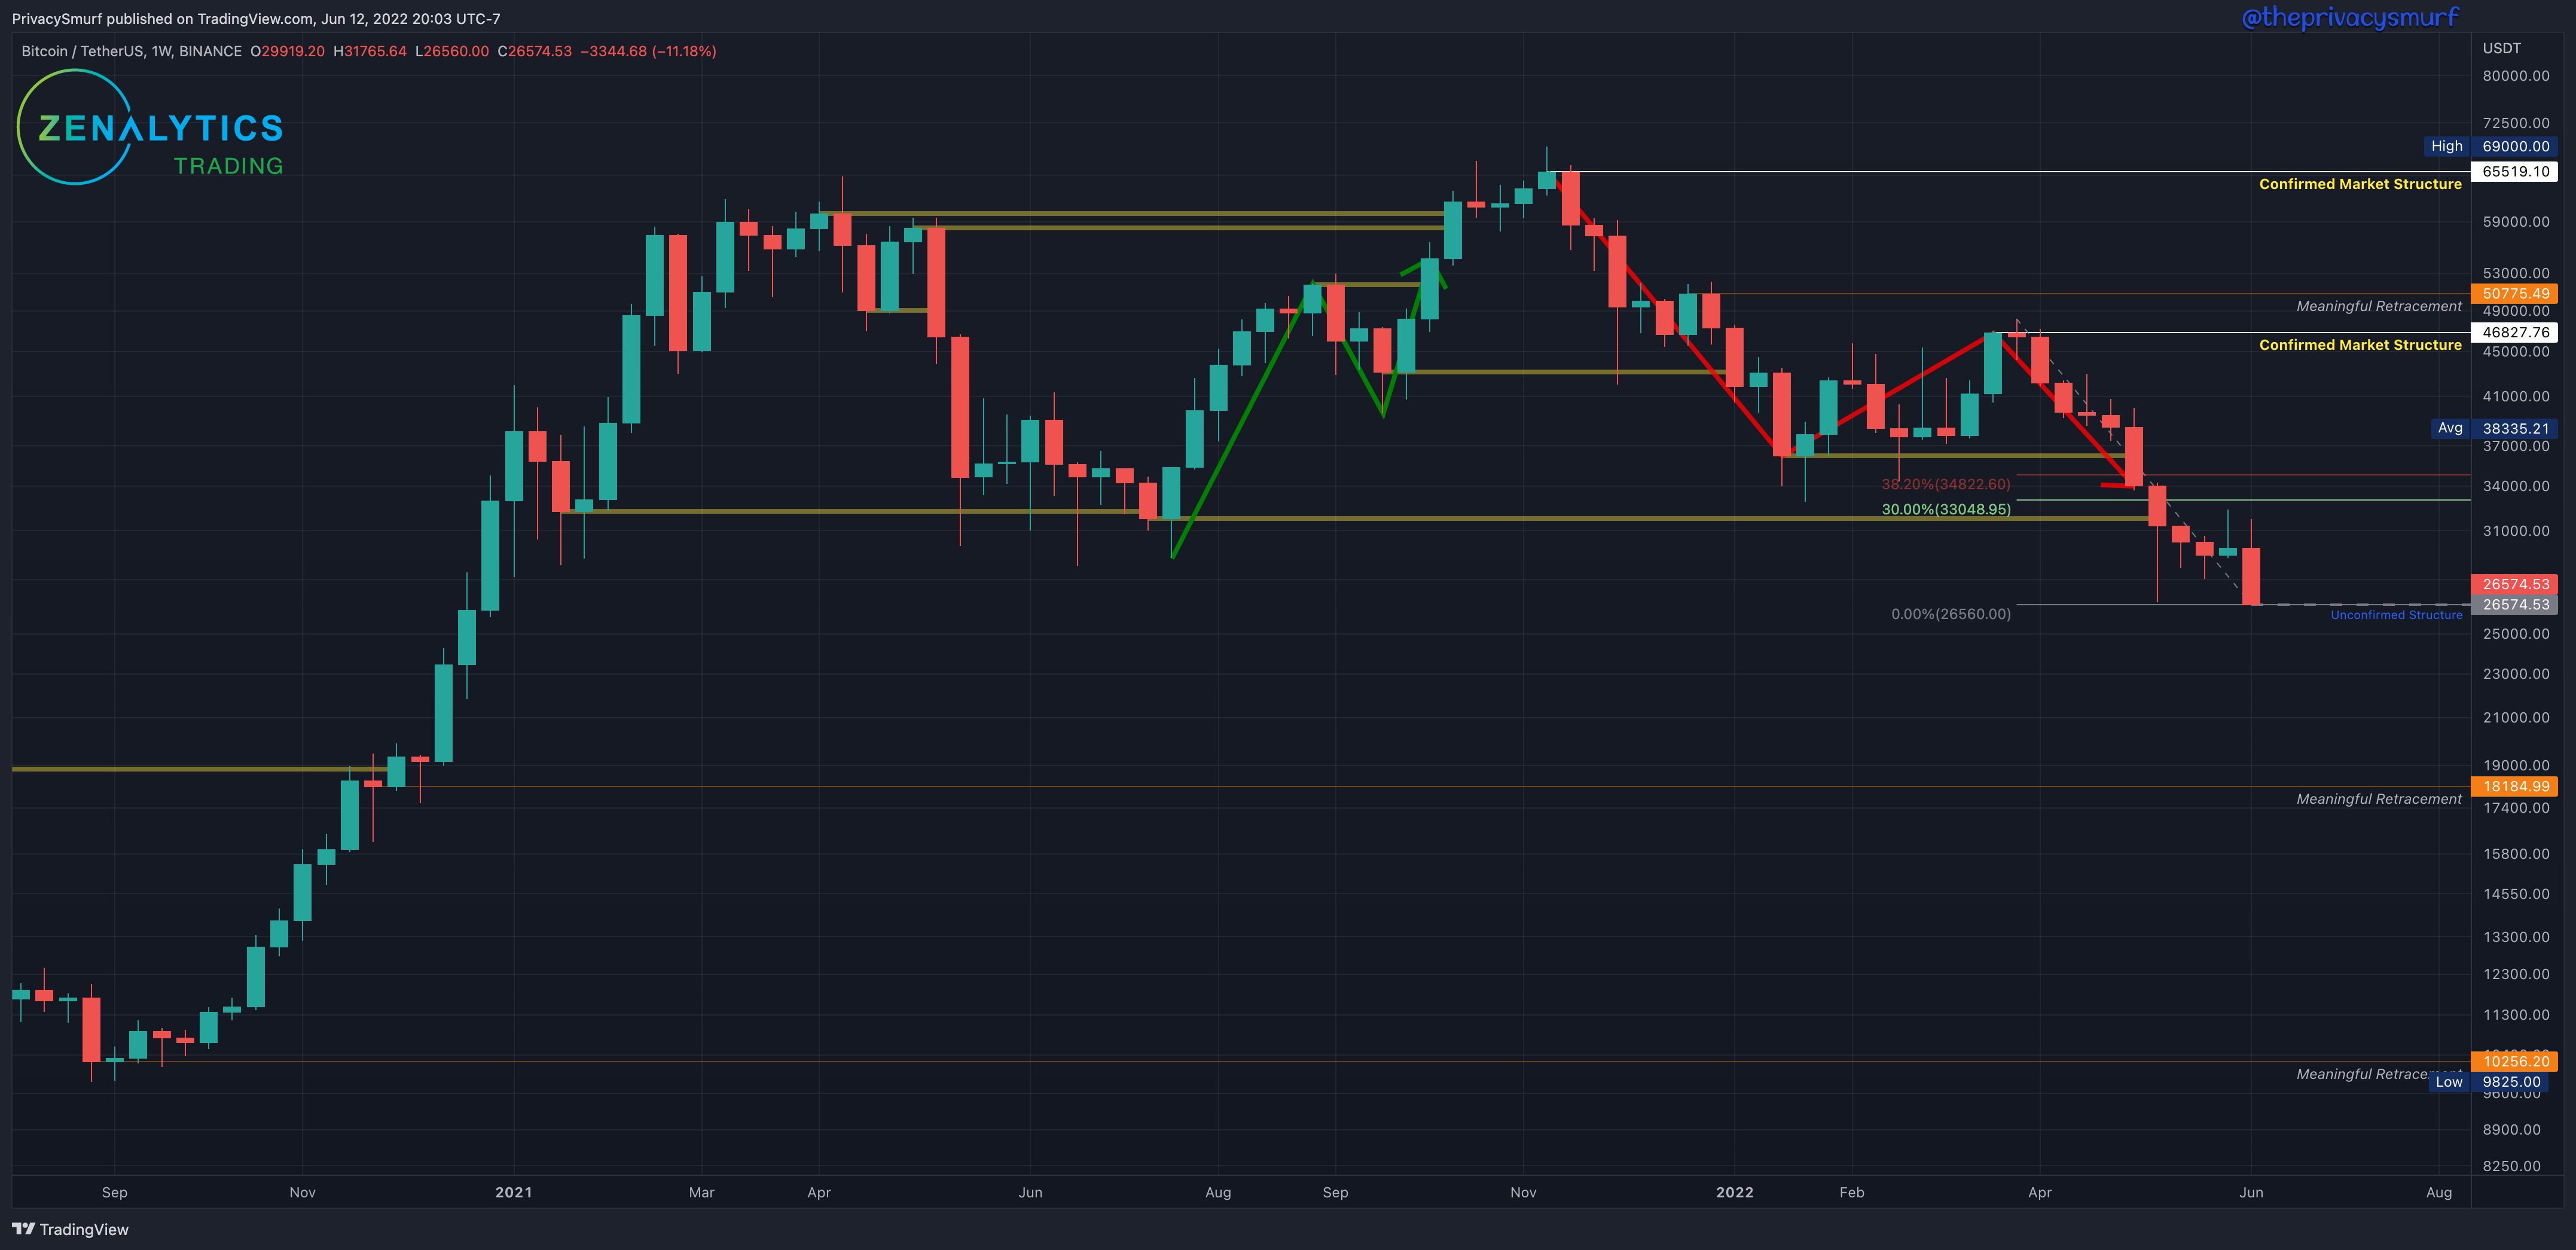
This week BTC continued the bearish price action setting a new lower close. The fib retracement from the highest high of the last ‘Confirmed Market Structure’ resistance is extended to the new low at $26560. This week’s close is the new ‘Unconfirmed Structure’. If prices increase from here with at least two green candles and a close above $34822 this will confirm the structure as support. Otherwise, the weekly market structure trend is still bearish. From a long-term perspective, there are no moves to be made at the moment. The next market structure is at $18184 with the possibility to act as support. I have a long-term DCA buy order there (it is in no way an attempt to time the market or call a bottom but is a location of value).
BTC/USDT Daily Chart
https://www.tradingview.com/chart/jjSdFW4b/
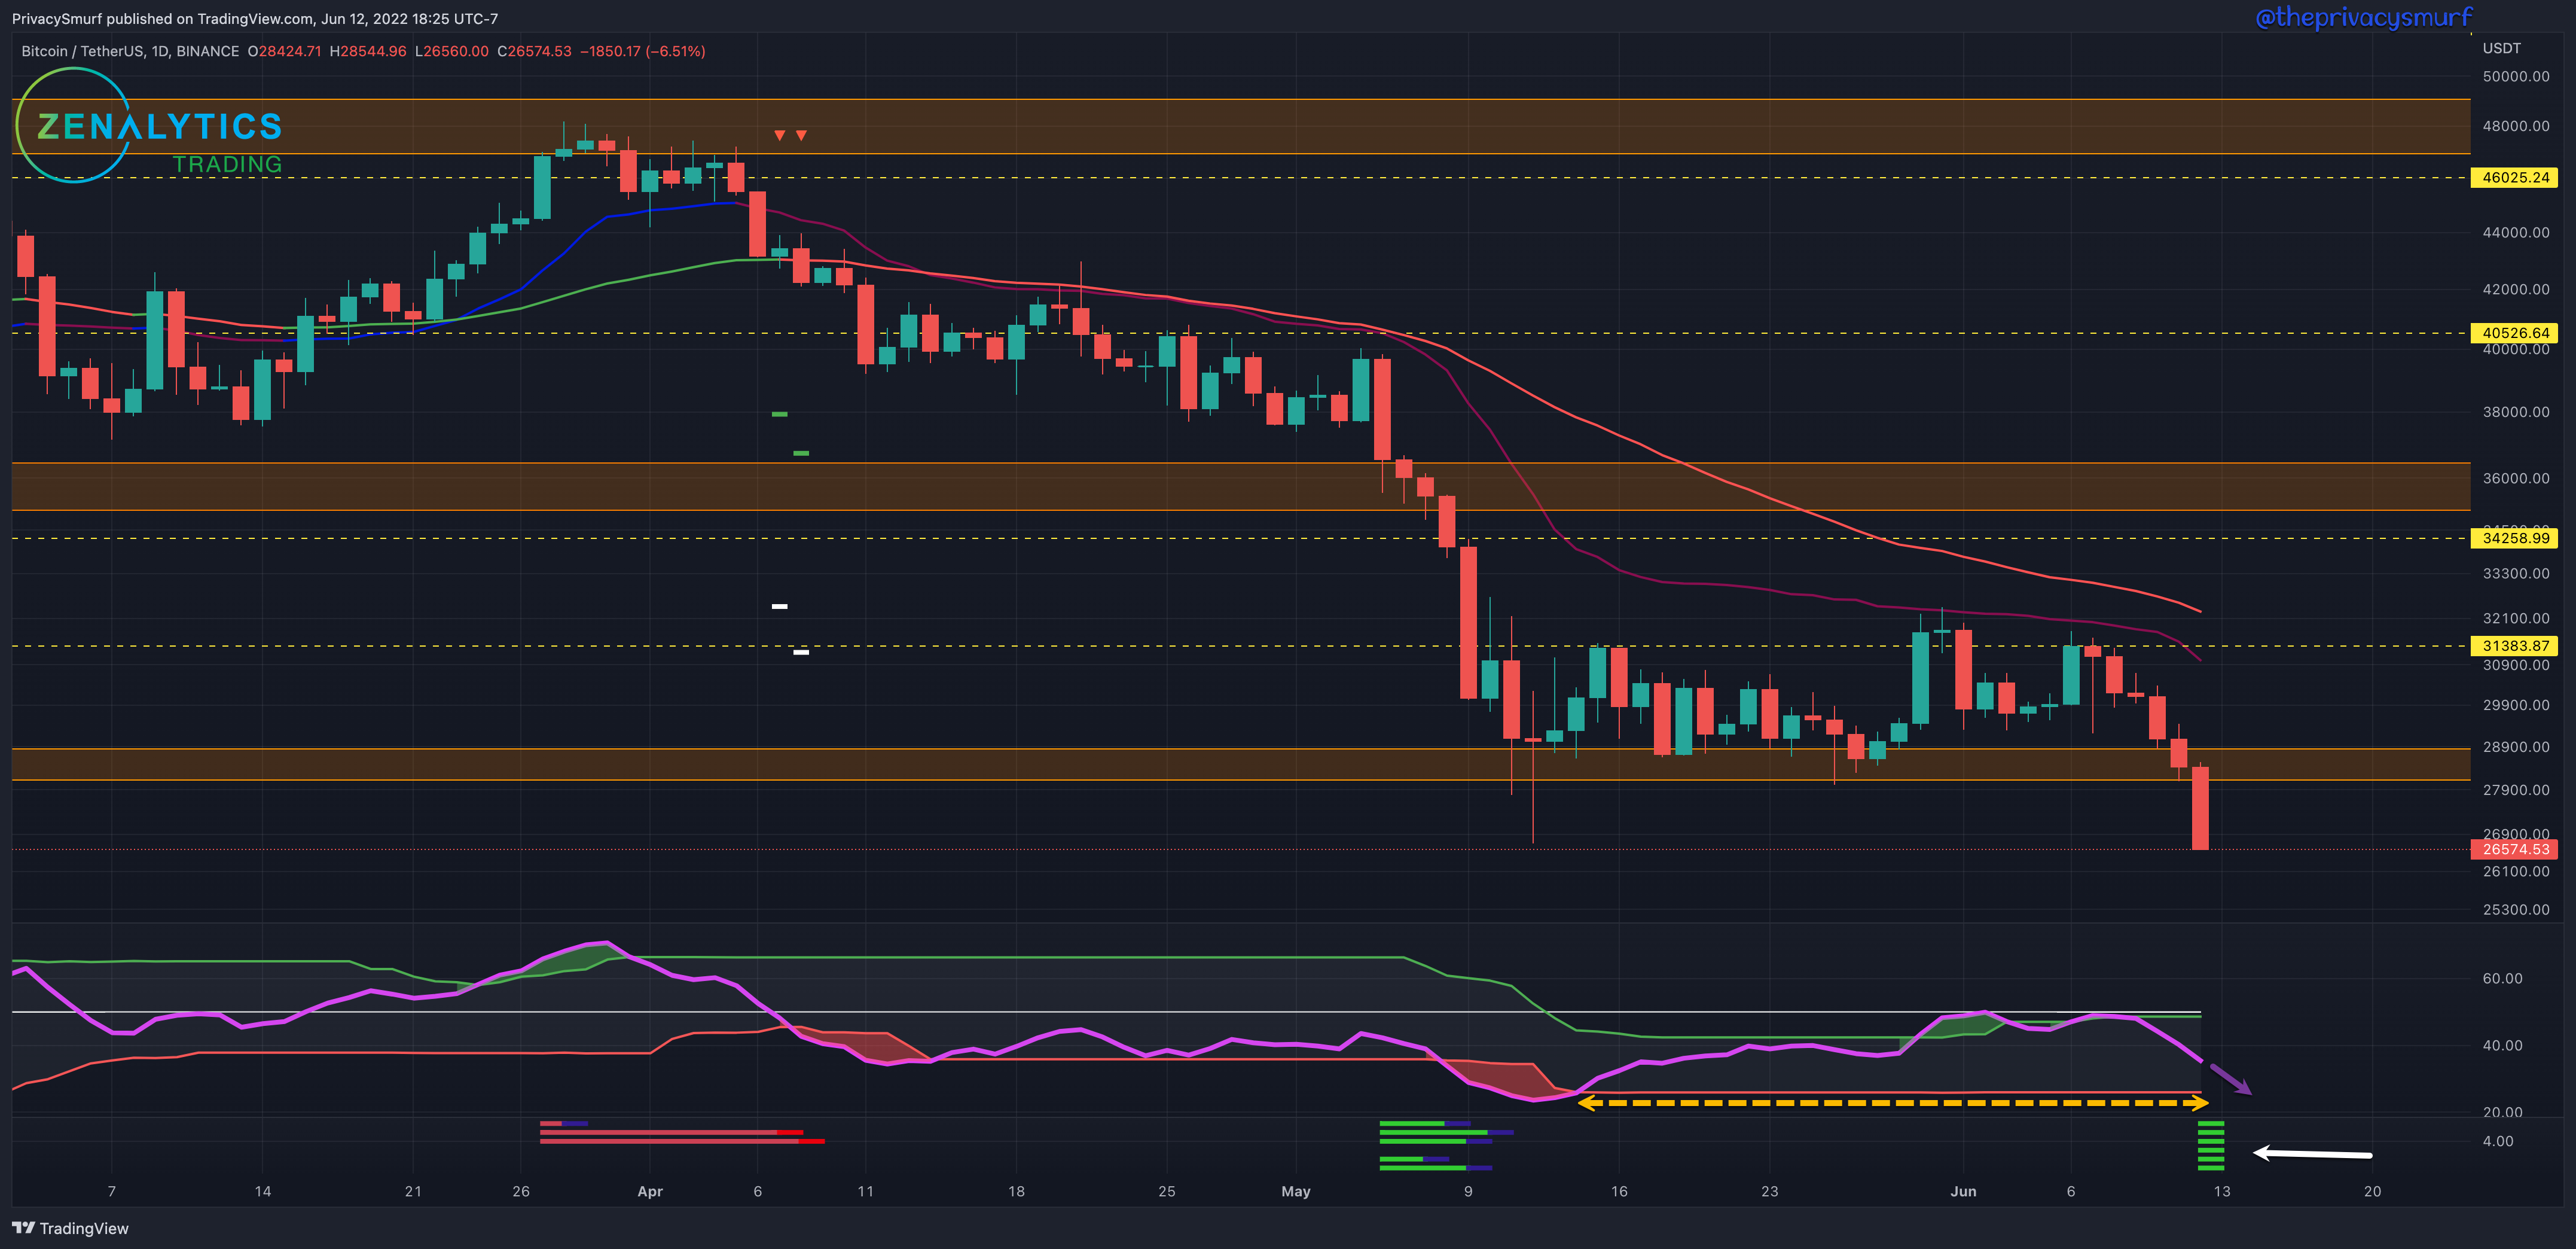
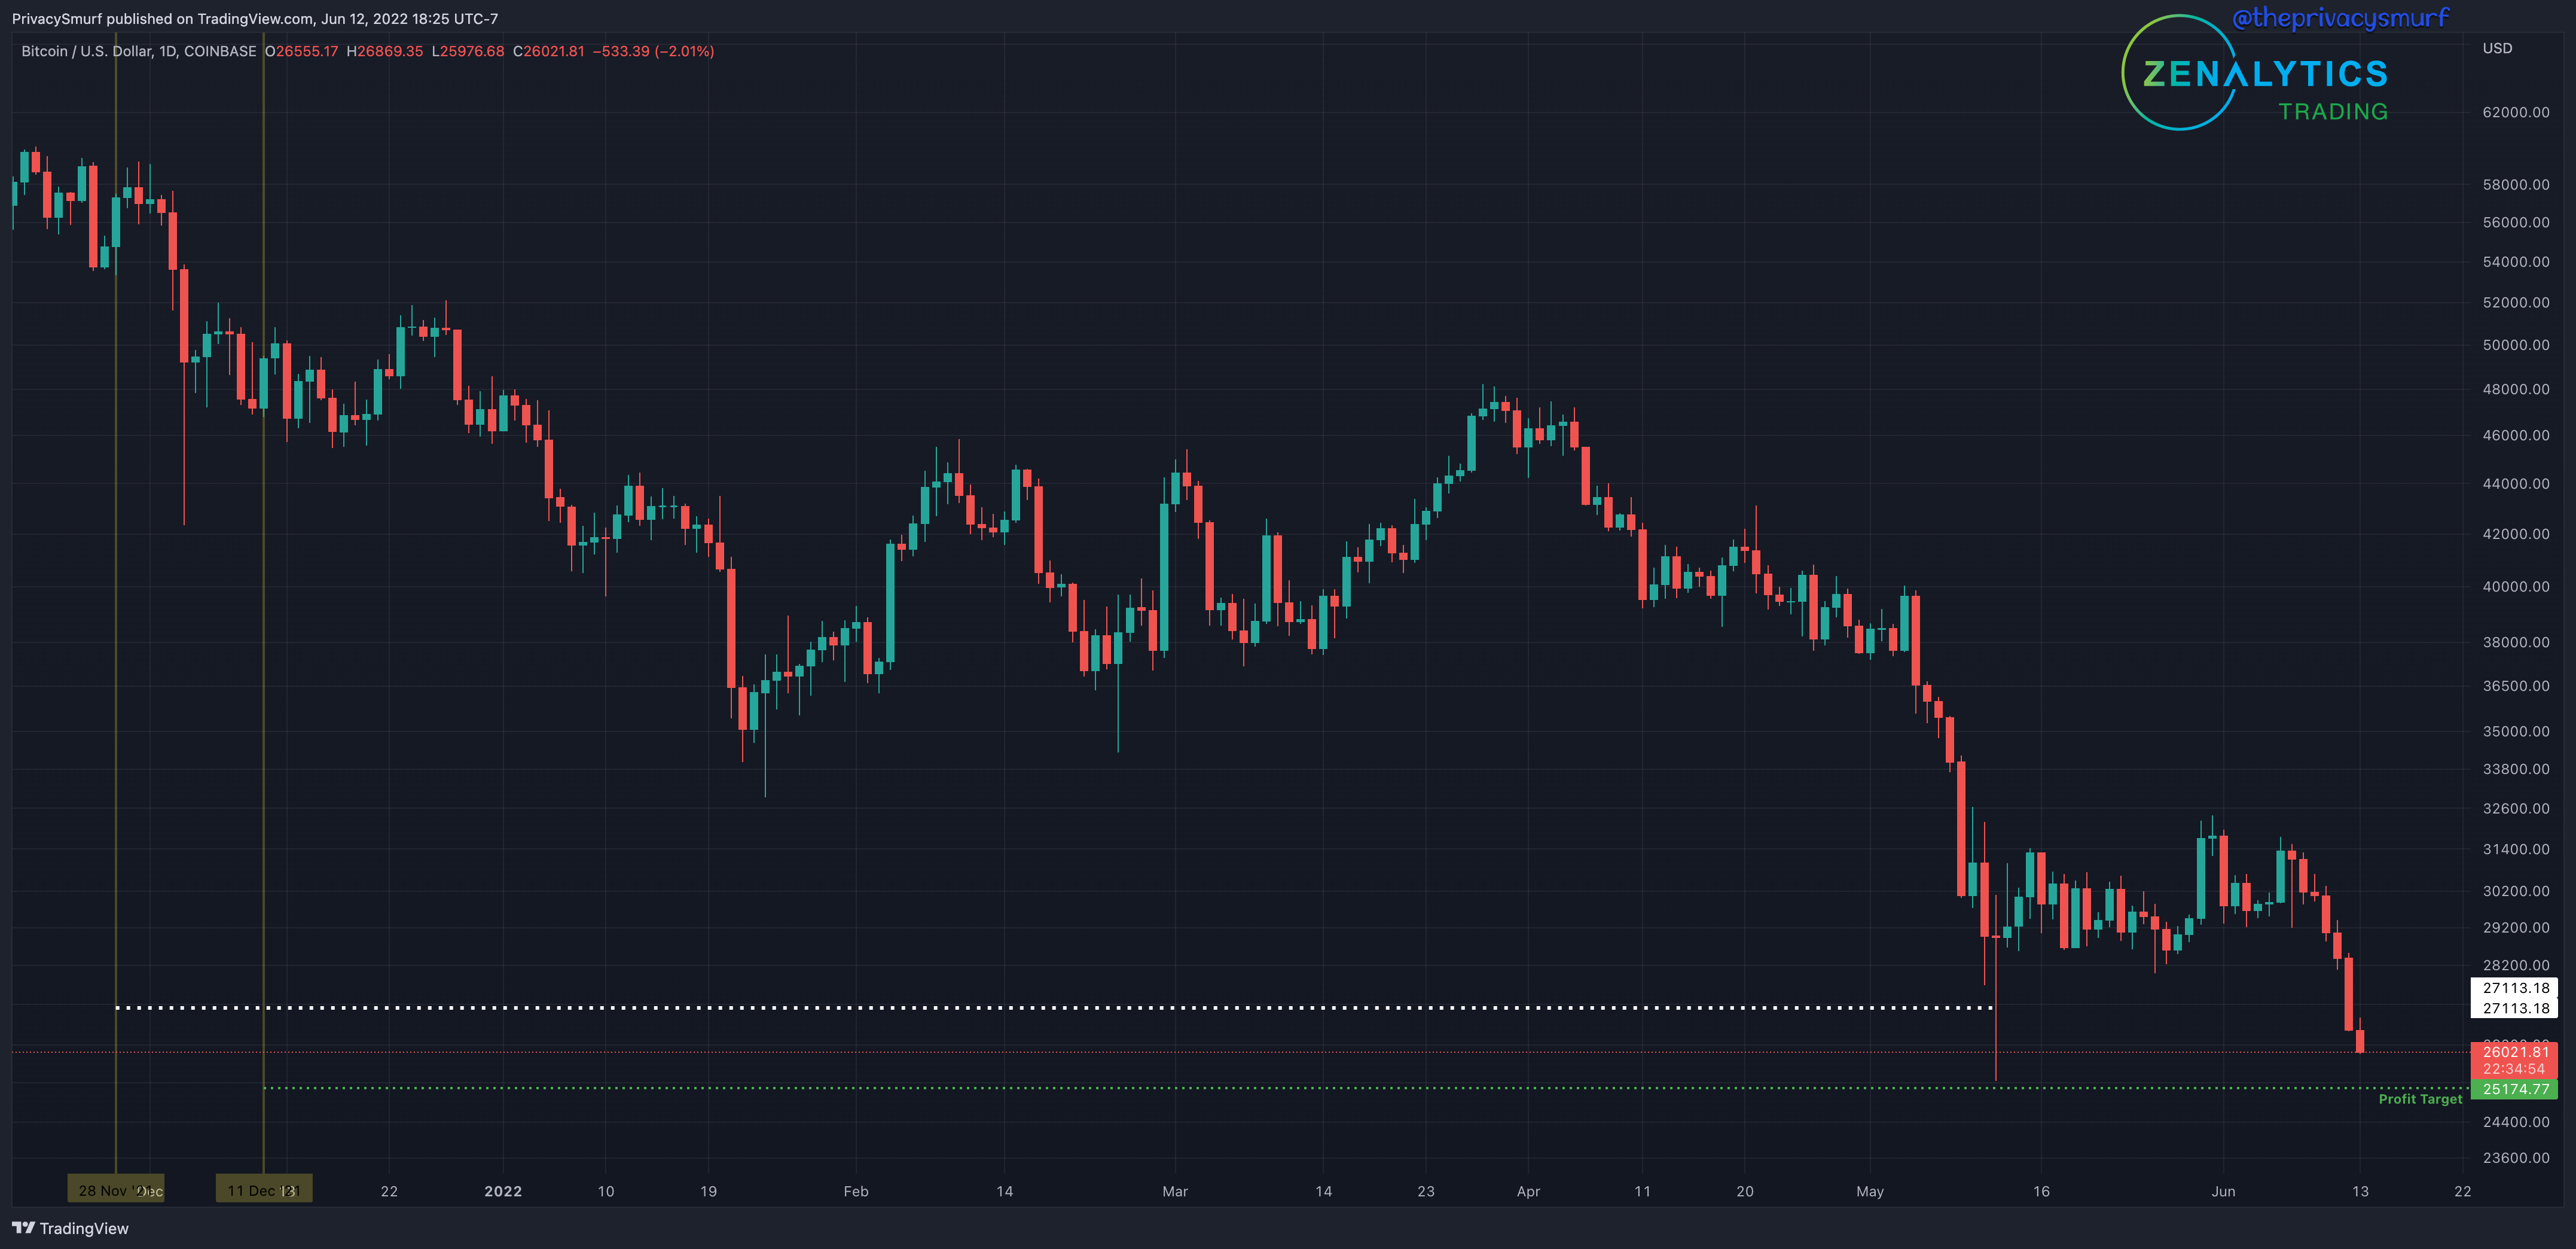
The daily chart also doesn't have a lot of great things going on. It has closed under the support zone and the last lower low. These actions suggest bearish price continuation. The only bright spot at the moment is the bullish divergence on the RSI and shown on my indicator, Correction Strength Meter at the bottom (white arrow). Price is making a new low while the RSI is not at a new low. This can often lead to a reversal however if the RSI makes a new low that will invalidate the divergence and is a sign of price continuation and lower prices in this case. It is something to keep an eye on in the near term.
I am hesitant to expect ranges at the moment as we are likely to see lots of volatility, but zooming out the next daily support zone would be around $24k. Wednesday I’ll likely be able to make a better estimation. Topside action I am not expecting anything over $32k.
ETH/BTC Weekly Structure
https://www.tradingview.com/chart/sacHlXOv/
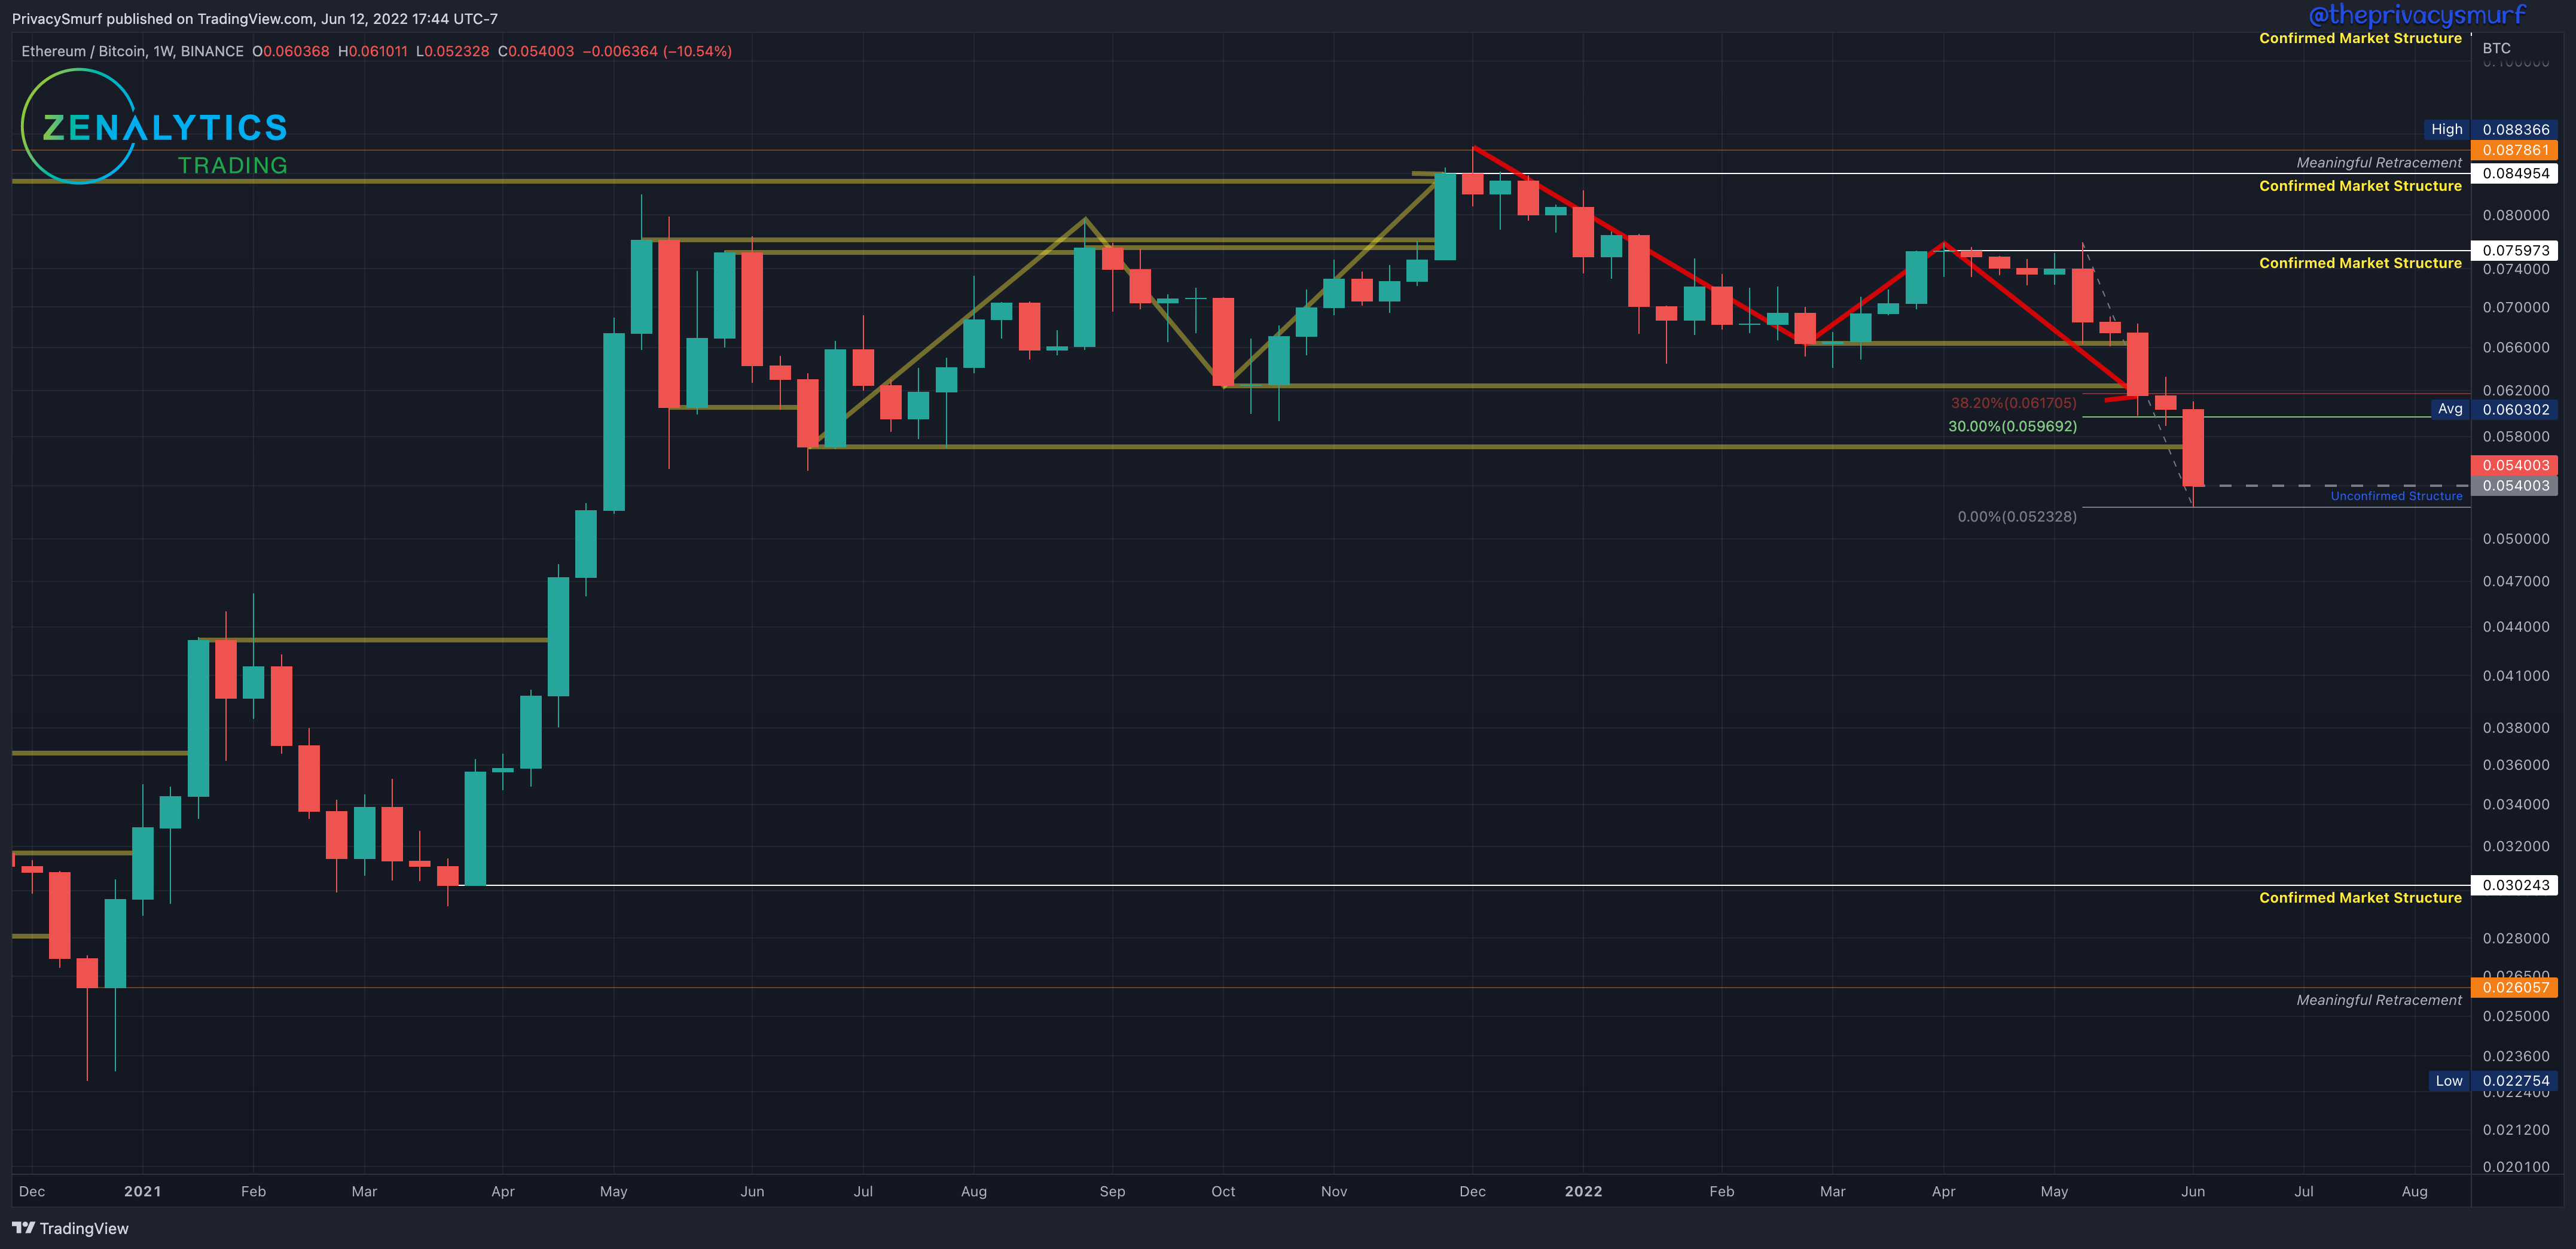
This week we see ETH/BTC closing below market structure support. The fib retracement from the highest high of the last ‘Confirmed Market Structure’ resistance is extended to the new low at 0.052328. this week’s close is the new ‘Unconfirmed Structure’. If prices increase from here with at least two green candles and a close above 0.061705 this will confirm the structure as support. Otherwise, the weekly market structure trend is still bearish. From a long-term perspective, there are no moves to be made at the moment. The next market structure is at 0.030243 with the possibility to act as support. I expect that if we continue to lose value in the ETH/BTC relationship the last broken support at just under 0.044 will act as support. I have a long-term DCA buy there (it is in no way an attempt to time the market or call a bottom but is a location of value).
ETH/BTC Daily Structure
https://www.tradingview.com/chart/gTkSjkj6/

The daily chart also doesn't have a lot of great things going on. It has closed under the support zone. These actions suggest bearish price continuation. The only bright spot at the moment is the bullish divergence on the RSI and shown on my indicator, Correction Strength Meter at the bottom (white arrow). Price is making a new low while the RSI is not at a new low. This can often lead to a reversal however if the RSI makes a new low that will invalidate the divergence and is a sign of price continuation and lower prices in this case. It is something to keep an eye on in the near term. One of the six oscillators has already been invalidated.

I am hesitant to expect ranges at the moment as we are likely to see lots of volatility, but zooming out the next daily support zone would be around 0.046. Topside action I am not expecting anything over 0.06.
ETH/USDT Weekly Structure
https://www.tradingview.com/chart/JPTp0aXw/
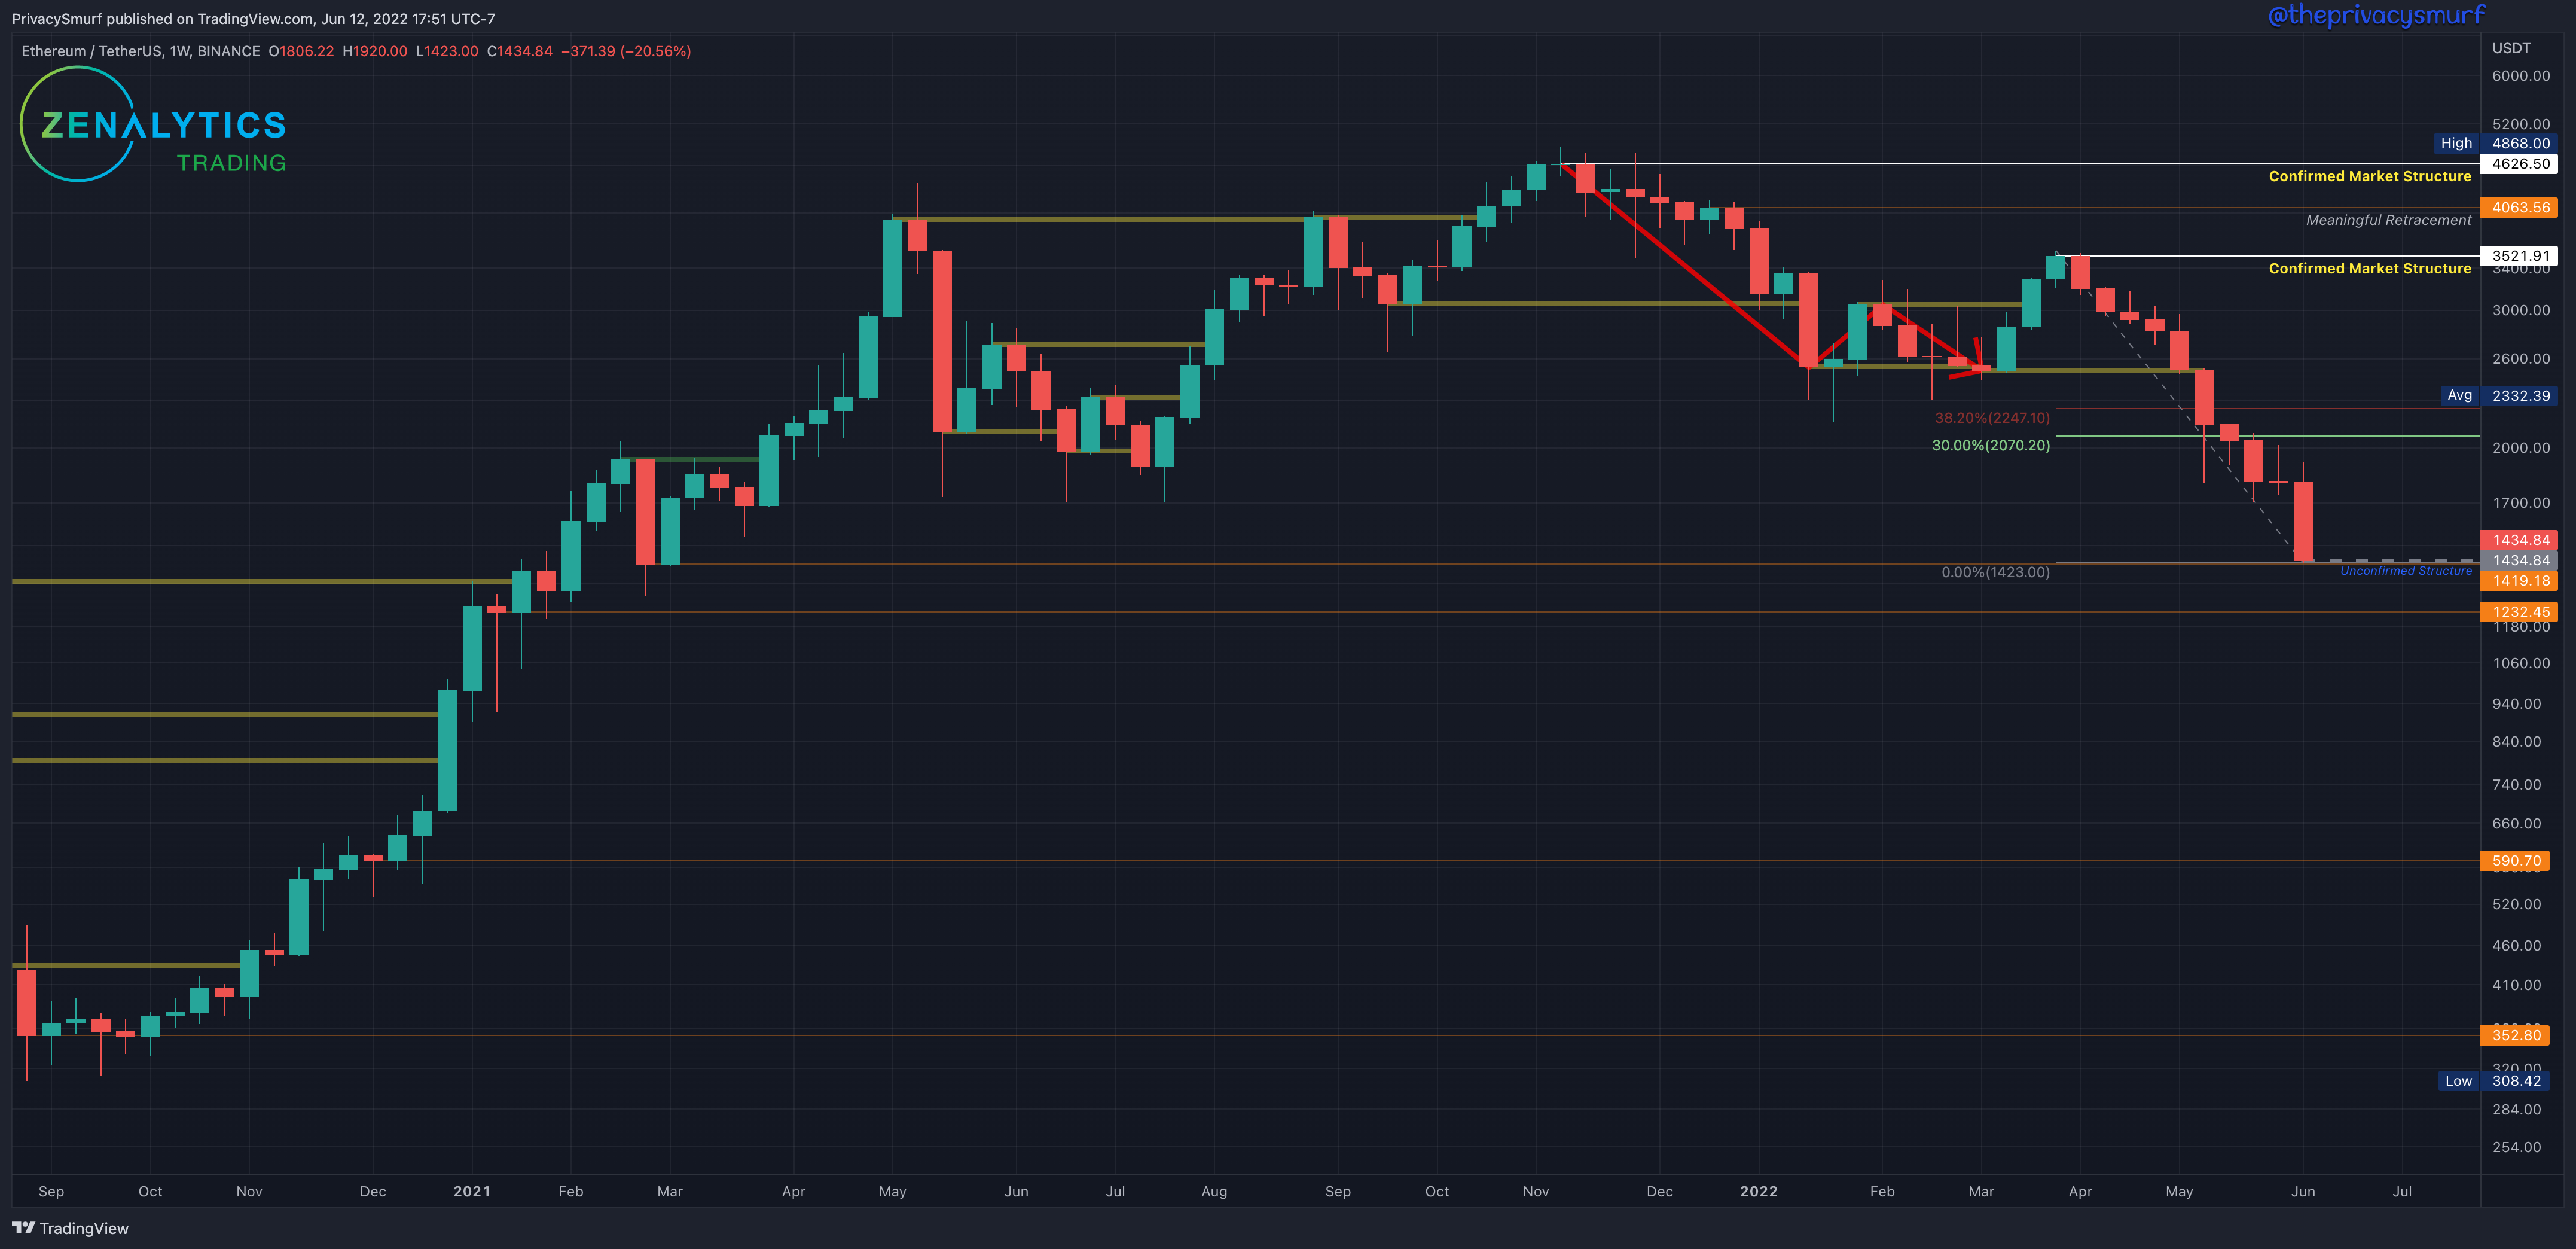
Similar to BTC, this week ETH continued the bearish price action setting a new lower close. The fib retracement from the highest high of the last ‘Confirmed Market Structure’ resistance is extended to the new low at $1423. This week’s close is the new ‘Unconfirmed Structure’. If prices increase from here with at least two green candles and a close above $2247 this will confirm the structure as support. Otherwise, the weekly market structure trend is still bearish. From a long-term perspective, there are no moves to be made at the moment. The next market structure is at $1232 with the possibility to act as support. I have a long-term DCA buy order there (it is in no way an attempt to time the market or call a bottom but is a location of value).
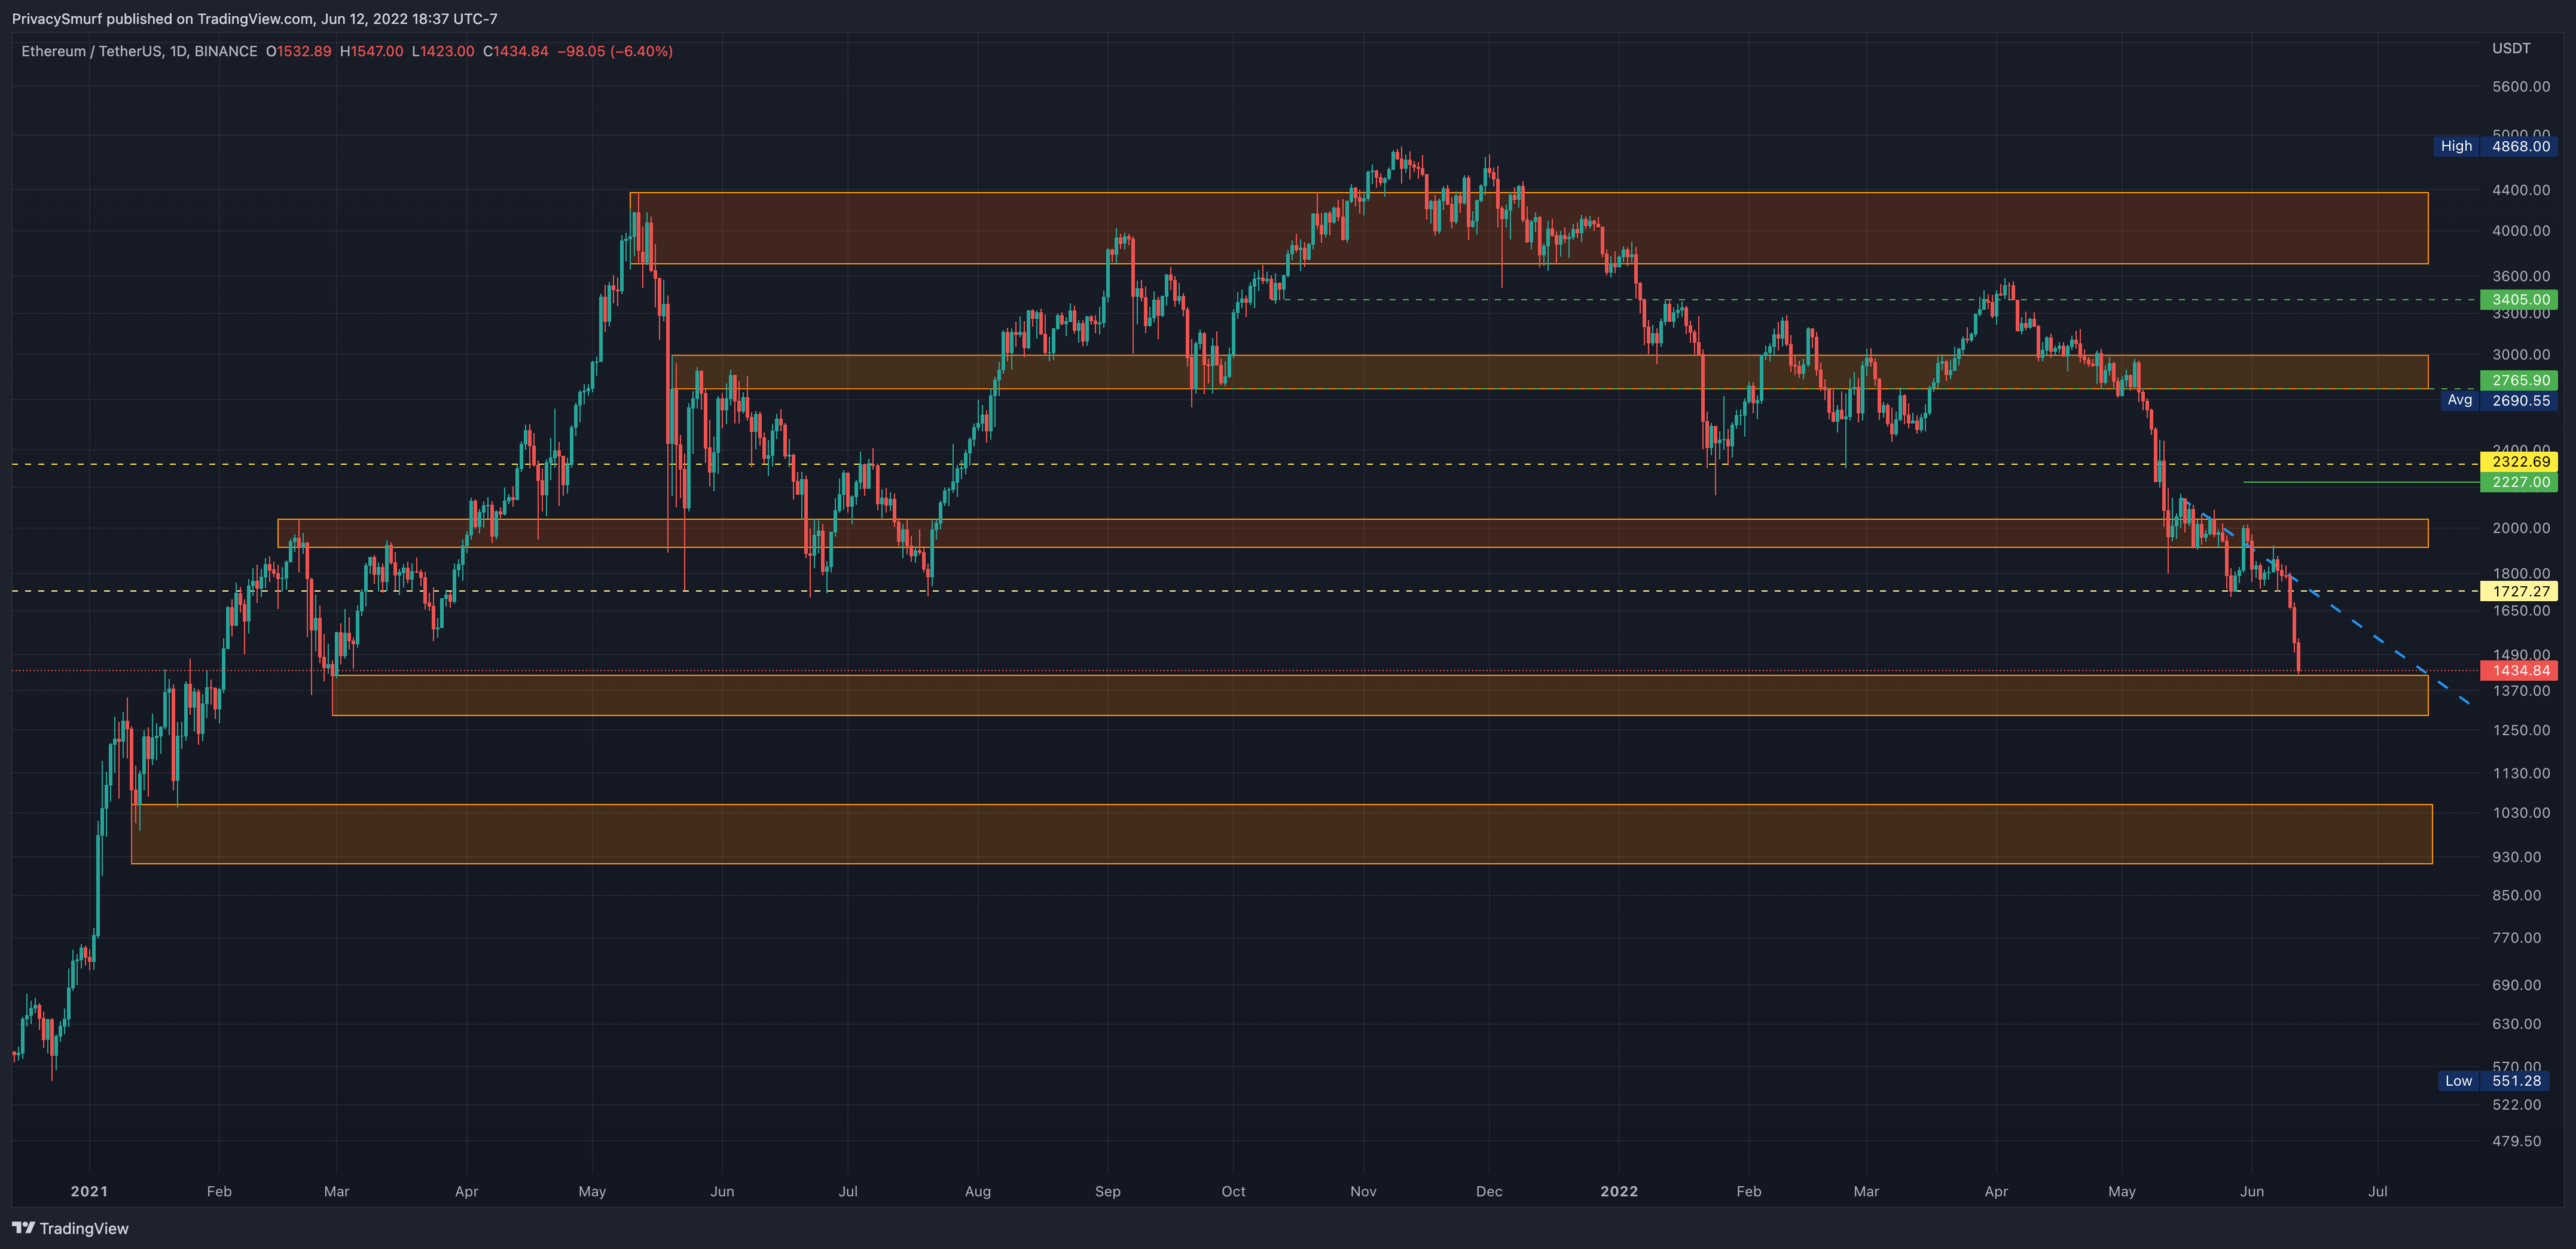
ETH/USDT Daily Structure
https://www.tradingview.com/chart/xbB6lkZu/
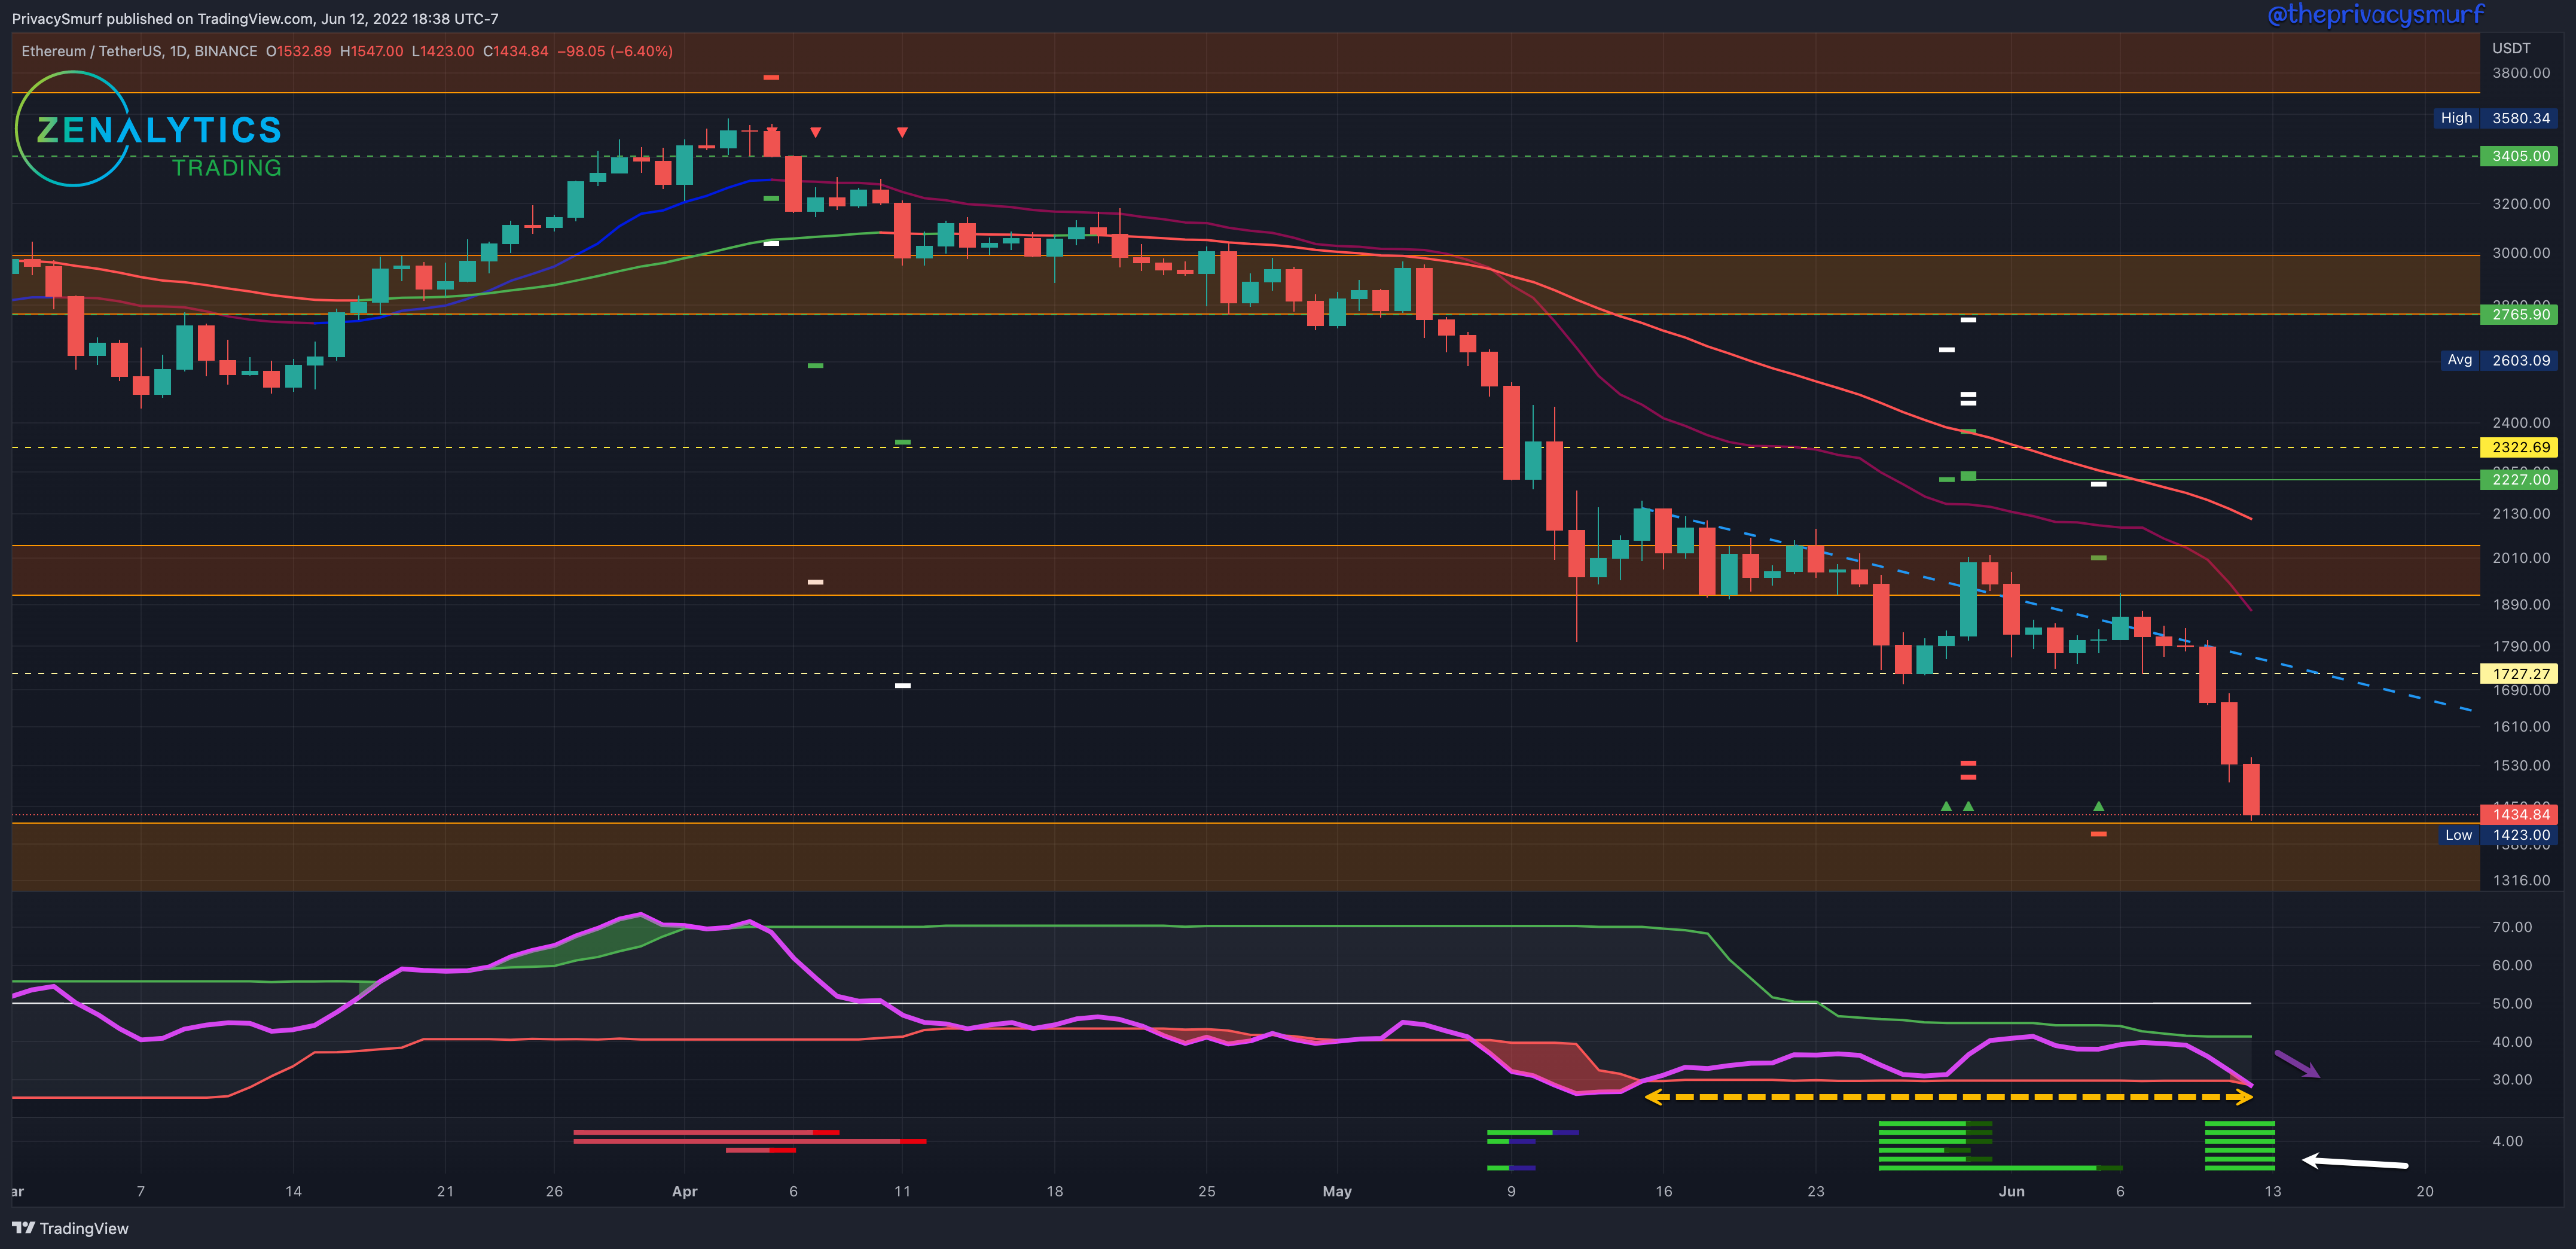
The daily chart also doesn't have a lot of great things going on but it’s in slightly better shape as it is just above the support zone. At the moment there is also a bullish divergence on the RSI and shown on my indicator, the Correction Strength Meter at the bottom (white arrow). Price is making a new low while the RSI is not at a new low. This can often lead to a reversal however if the RSI makes a new low that will invalidate the divergence and is a sign of price continuation and lower prices in this case. It is something to keep an eye on in the near term.
I am hesitant to expect ranges at the moment as we are likely to see lots of volatility, but zooming out the next daily support zone would start around $1050 if the current zone doesn't provide a bounce around $1290. Wednesday I’ll likely be able to make a better estimation. Topside action I am not expecting anything over $1730.
That’s a wrap for this week. Pretty simple. Bearish, lol. Hope you aren’t getting wiped out with Celsius pulling a Luna and teasing a dump to zero. Take care out there.
@theprivacysmurf