It’s wild how after all this bearishness just a couple days of green can get me ‘feeling good as new.’
I’m getting really nervous that I’m going to replay a song here at some point soon. I really need to make a playlist to track this.
DCA: Dollar-Cost Averaging, is a means to take thoughts, emotions, and timing out of your purchases and make them mechanical and simple. Examples would be buying at a regular time-frequency (every week/month) or a predefined price level (support or even number). Long-term it is typically more cost-effective and profitable than trying to always time the markets however spreading out your capital is pivotal.
This past week BTC closed bullish. With no new lower low the fib retracement from the highest high of the last ‘Confirmed Market Structure’ resistance remains at the last lowest low at $17622. This week’s close being bullish leaves the last lowest close at $20574 as an ‘Unconfirmed Structure’. If prices increase from here with a close above $29298 this will confirm the structure as support. The weekly market structure trend is still bearish. From a long-term investing perspective, there are no moves to be made (for the HODL bags) since the ‘meaningful retracement’ at $18185 from Dec 2021 was been hit and the DCA order was filled. The next lower buy location for me is at $10256 (it is in no way an attempt to time the market or call a bottom but is a location of value). Given current technicals, I don’t expect that to be hit in the near future, but I have a DCA order there. From a long-term trading perspective, a buy order (for selling at the next cycle peak) won’t be taken by me for this timeframe until the market shifts back to bullishness.
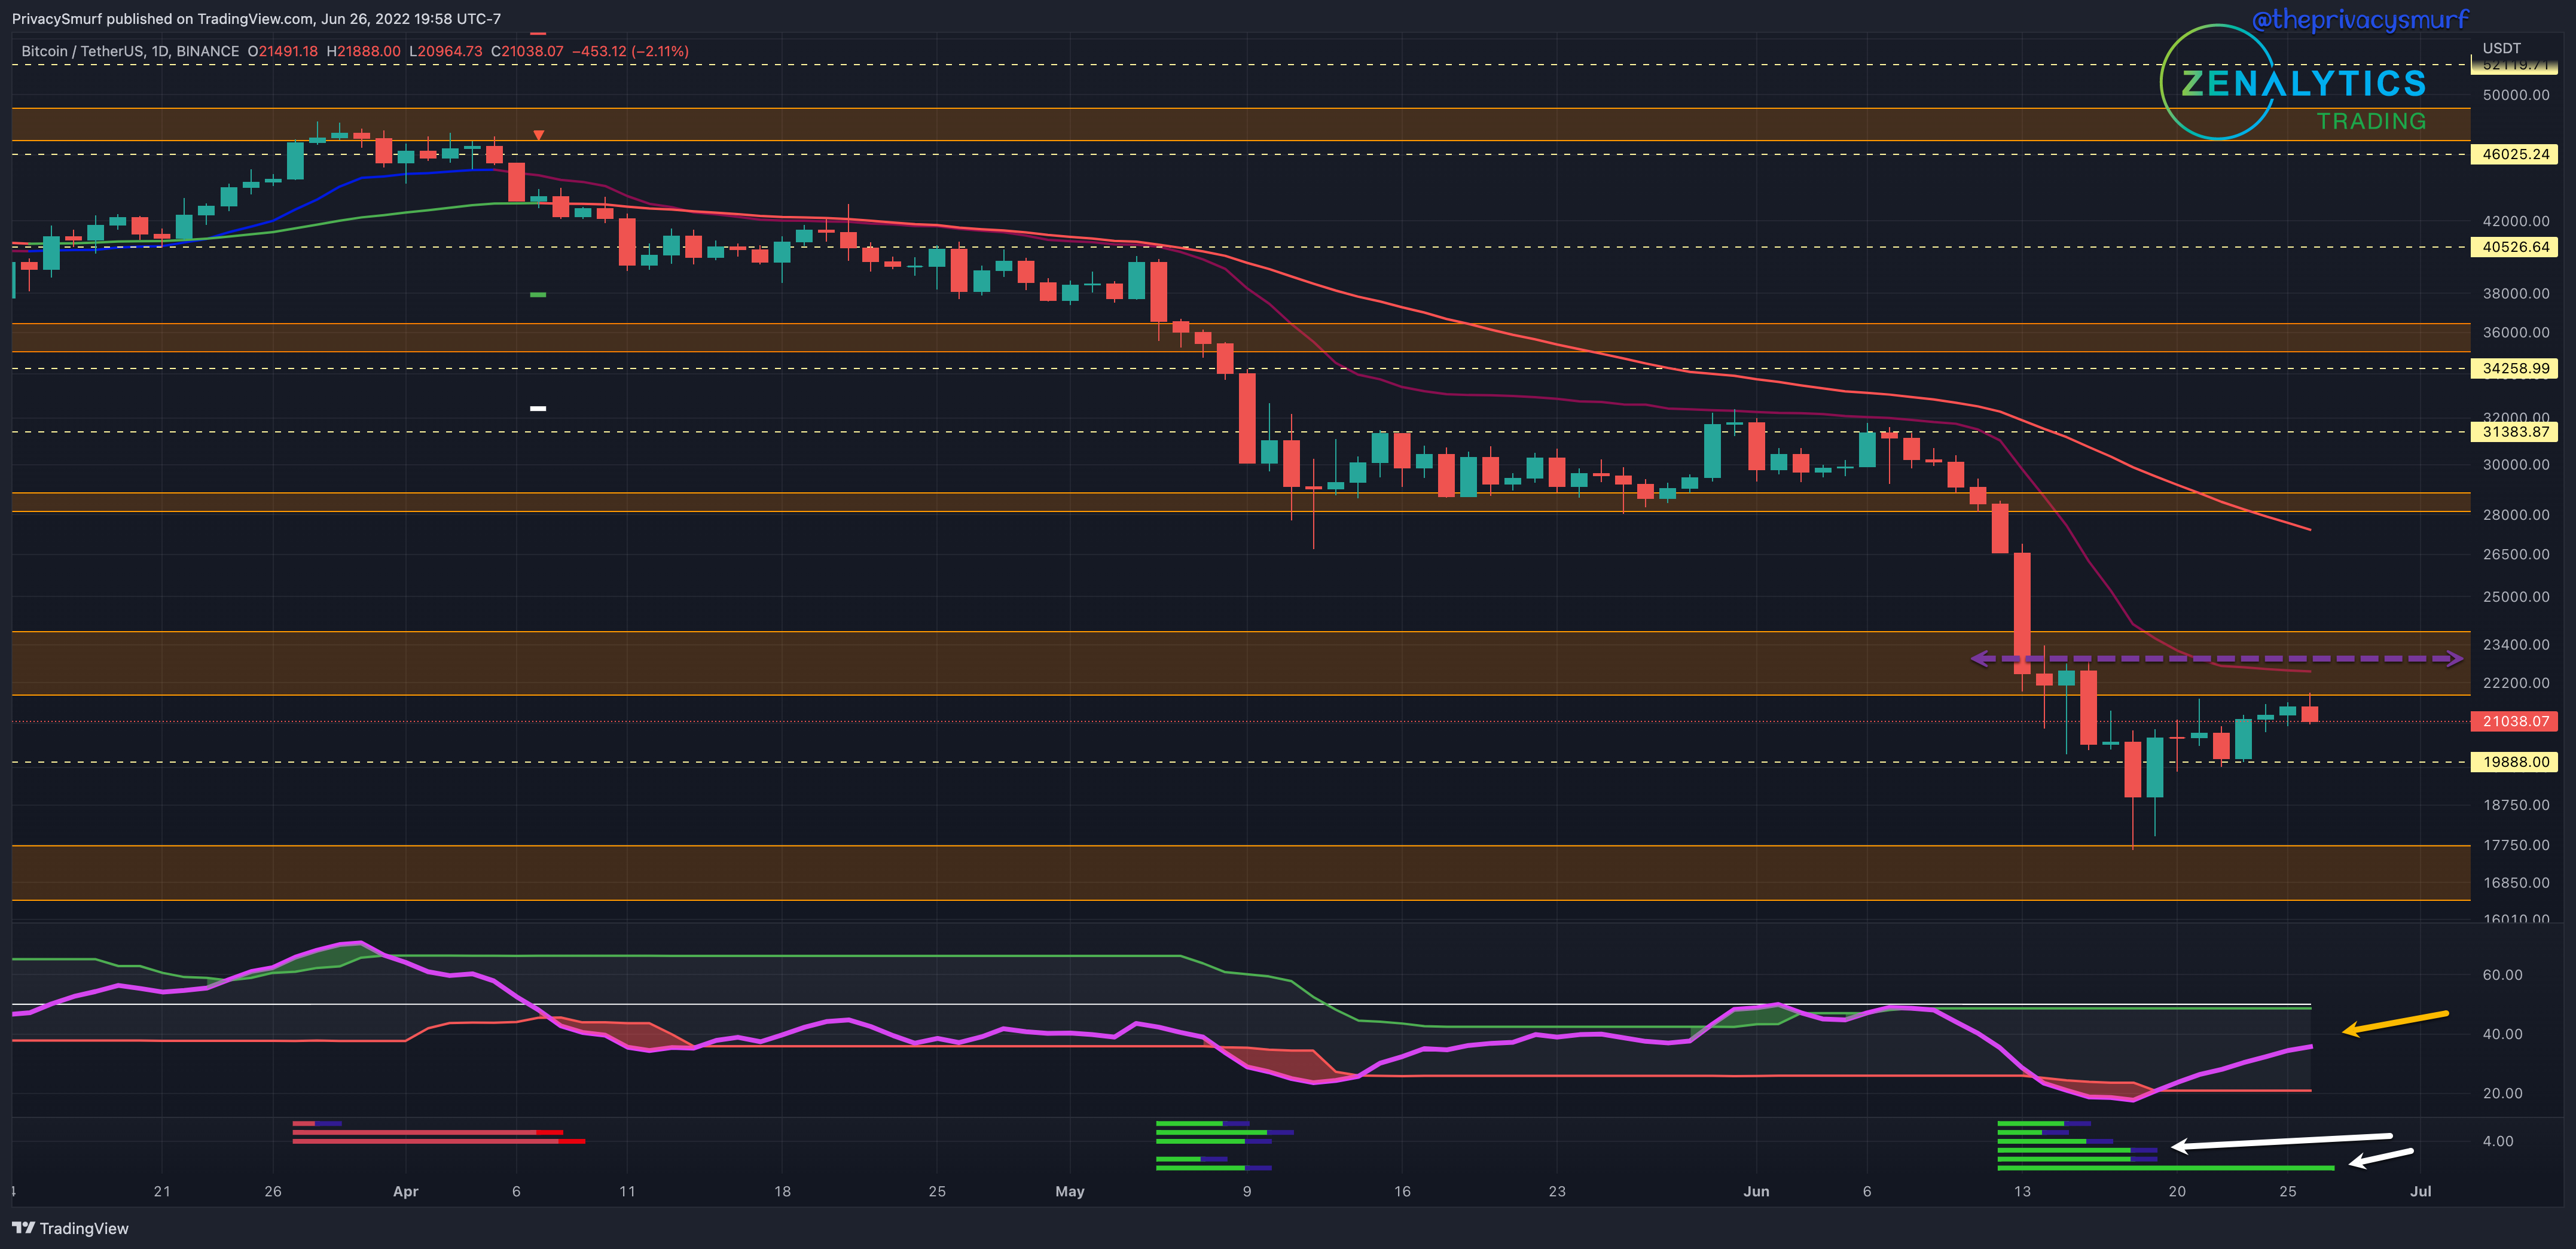
“there is a case to be made for bullishness early in the week… the RSI is curling back into the bands… typically is represented in price action as an exhaustion of the downside volatility… the Correction Strength Meter… invalidation of the bullish divergences on price action oscillators. Only one remains in bullish divergence… suggest a bearish price continuation… something to keep monitoring… there are plenty of resistances… around $23.5k.”
Many of the same conditions from last week still exist on this chart. The CSM at the bottom (white arrow) still hasn’t signaled a bullish trade condition yet. Resistances still exist which I’m anticipating some retracement from (purple arrow line segment). The RSI is trending in the right direction but is still below the midline and top band (yellow arrow). It would appear that the breaking of the band and midline may be timed around a resistance test of the top of the resistance zone at around $24k. I’m still expecting bullishness this week but not with intensity until the top band can be broken. It’s very possible that we continue to range between the lower closes and resistance accumulating until there is enough strength to move up.
This past week closed bullish with ETH gaining on BTC. With no new lower low the fib retracement from the highest high of the last ‘Confirmed Market Structure’ resistance remains at the last lowest low at 0.049081. This week’s close being bullish leaves the last lowest close at 0.054003 as an ‘Unconfirmed Structure’. If prices increase from here with a close above 0.059698 this will confirm the structure as support. The weekly market structure trend is still bearish. From a long-term investing perspective, the next market structure is at 0.030243 with the possibility to act as support. I expect that if we continue to lose value in the ETH/BTC relationship the broken structure at just under 0.044 (from 2021) will act as support. I have a long-term DCA buy there (it is in no way an attempt to time the market or call a bottom but is a location of value). Given current technicals, I don’t expect that to be hit in the near future, but I have a DCA order there. From a long-term trading perspective, a buy order (for selling at the next cycle peak) won’t be taken by me for this timeframe until the market shifts back to bullishness.
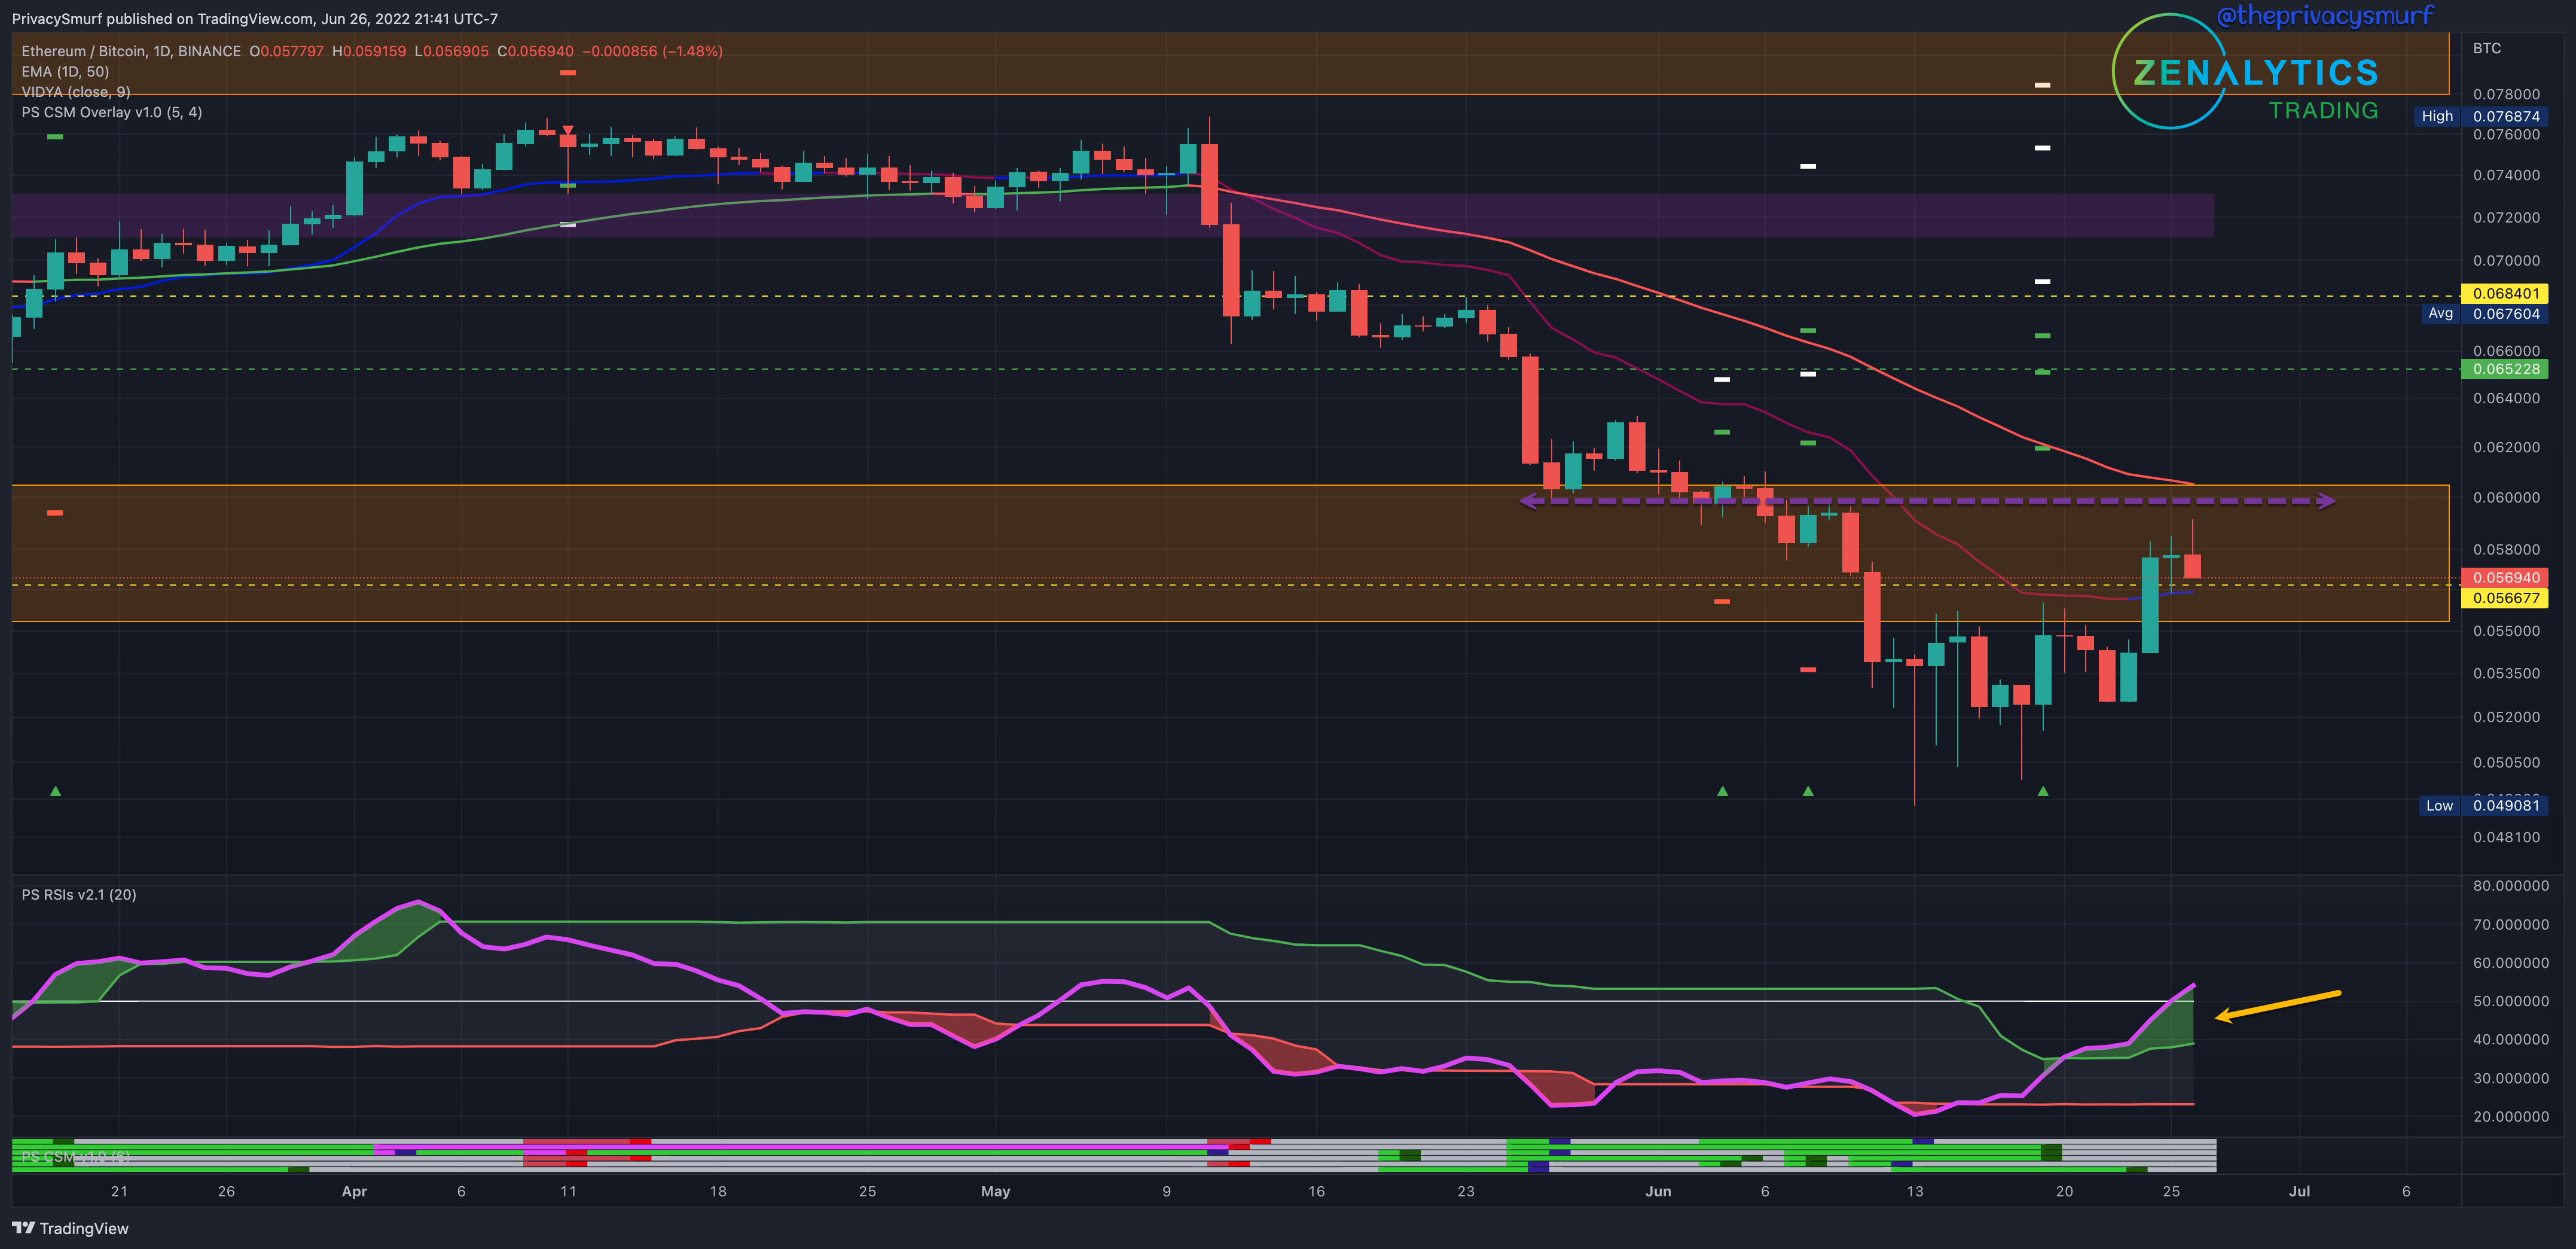
“a case to be made for bullishness this week… Sunday closed as a bullish engulfing candle and also as a new higher high close… The RSI top band break… typically is represented in upwards volatile price action. The Correction Strength Meter… showing bullish trade signals.”
Bullishness played out at the end of the week. The RSI (yellow arrow) is now breaking above the midline. I’d expect a test of that for support. Resistances still exist around 0.060. This is a key level to break as it is also where the 50-Day EMA is located. If candles can break above that level ETH has the possibility of gaining in value much greater than BTC. Short-term positions in ETH and likely altcoins would be viable and I’d be looking for stronger performing coins across the market for short-term long trades. The top side resistance I’d put up at around 0.066. If the RSI fails to hold at the midline it would likely retrace back into the bands suggesting the bullish impulsive move is dying off.
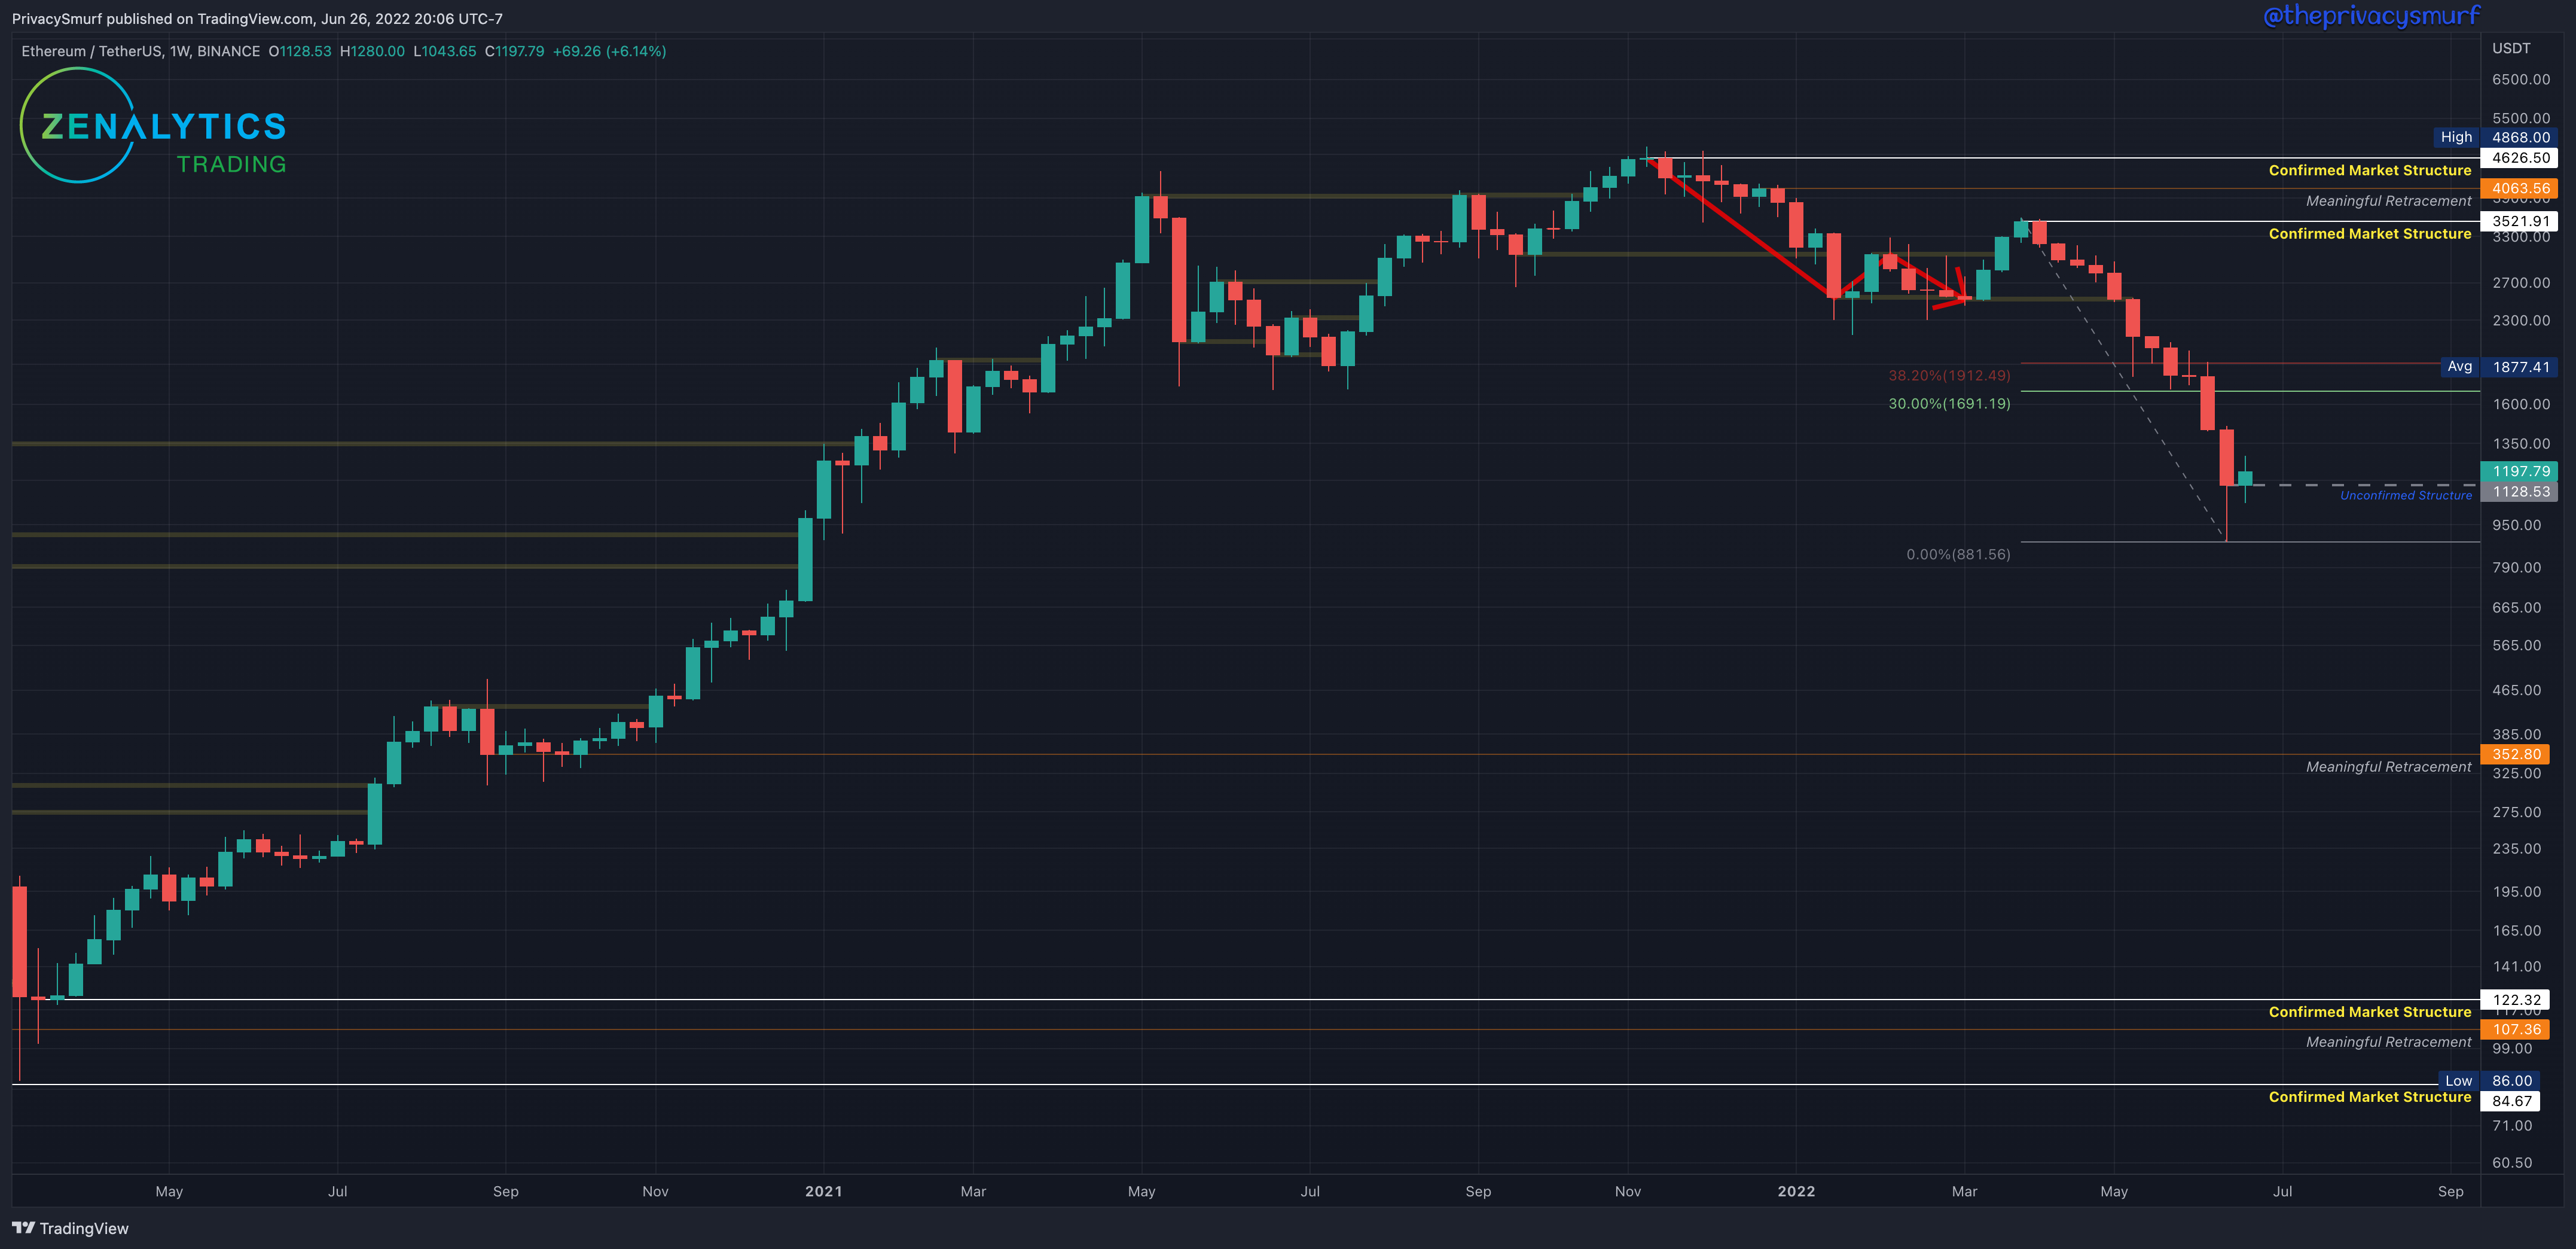
Similar to BTC, this past week ETH closed bullish. With no new lower low the fib retracement from the highest high of the last ‘Confirmed Market Structure’ resistance remains at the last lowest low at $881. This week’s close being bullish leaves the last lowest close at $1128 as an ‘Unconfirmed Structure’. If prices increase from here with a close above $1912 this will confirm the structure as support. The weekly market structure trend is still bearish. From a long-term investing perspective, there are no moves to be made (for the HODL bags) since the ‘meaningful retracement’ at $1232 from Jan 2021 was been hit and the DCA order was filled. The next lower buy location for me is at $352 and potentially at the broken structure at $800 from 2021(it is in no way an attempt to time the market or call a bottom but is a location of value). Given current technicals, I don’t expect that to be hit in the near future, but I have a DCA order there. From a long-term trading perspective, a buy order (for selling at the next cycle peak) won’t be taken by me for this timeframe until the market shifts back to bullishness.
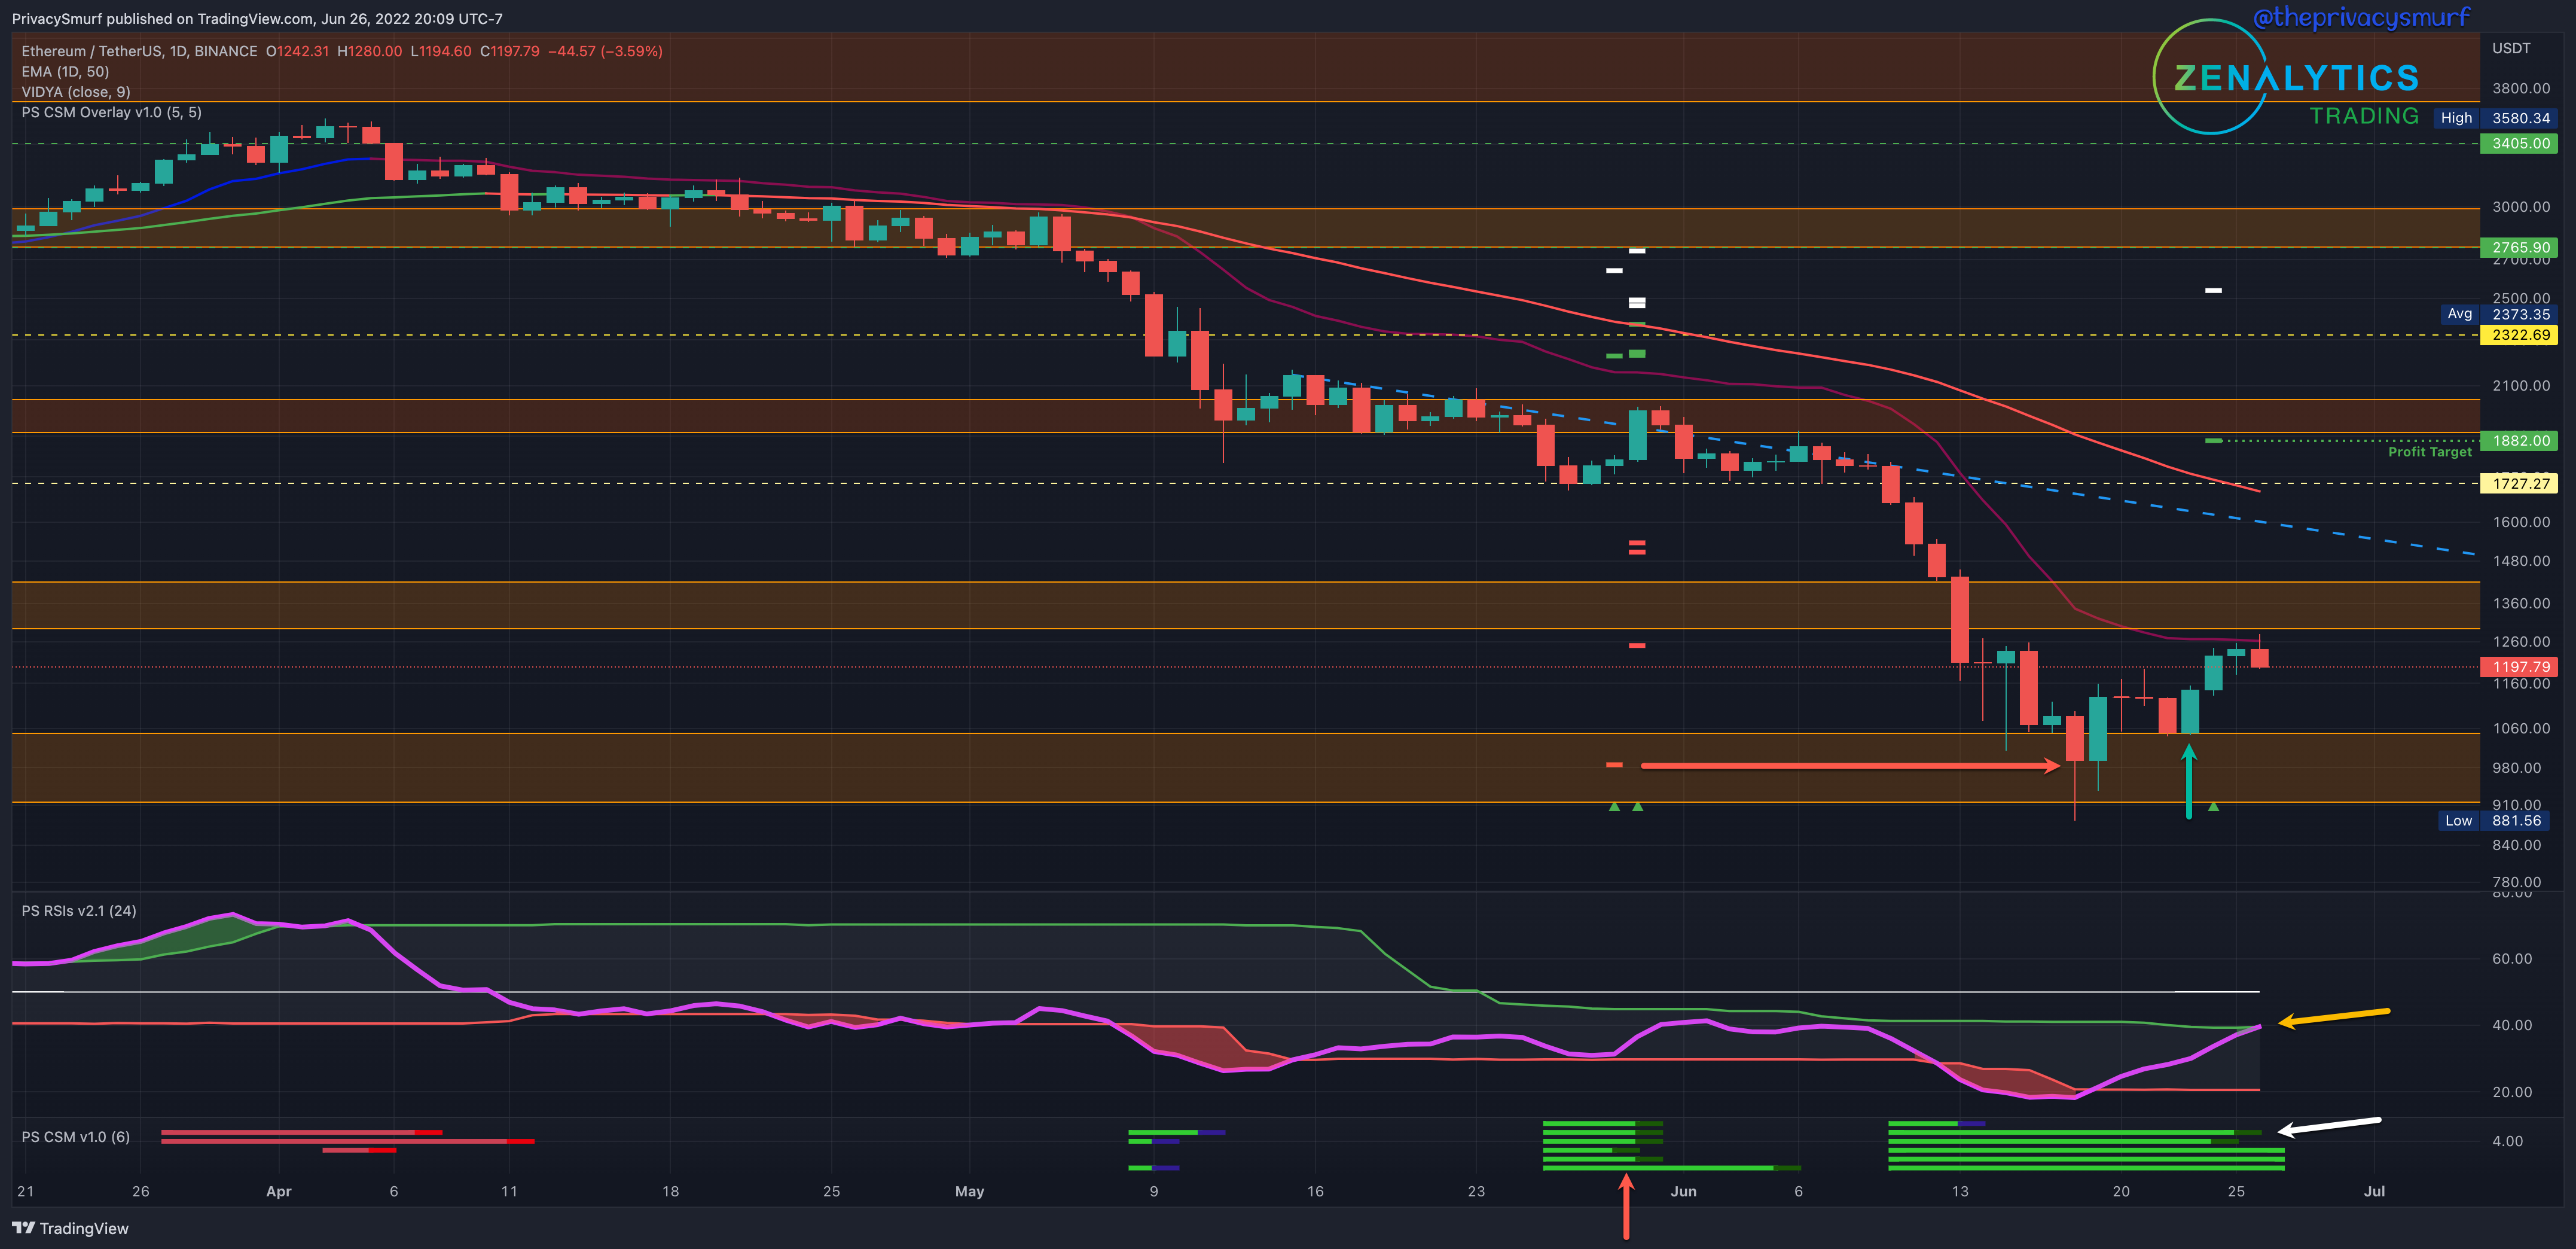
“a case to be made for bullishness… Sunday closed as a bullish engulfing candle… RSI is curling back into the bands from below… shows a slowing in the immediate downtrend. The Correction Strength Meter… in bullish setups… a higher bullish case for ETH than BTC… possible that some ETH and altcoin strength catches folks by surprise.”
“a lot of talk about BTC Dominance and how alts are gonna get wrecked vs BTC… not always the case.. monitor ALT/BTC charts... post about alternate pairings (HERE) and another about how to really look at the concept of BTC Dominance (HERE)… Mid Caps outperforming…”
It was a good week for ETH and many altcoins as shown above. Many of the same technical conditions from last week still exist on this chart but there is still increasing strength. The CSM at the bottom (white arrow) has signaled a bullish trade condition just after a bullish engulfing candle close (green arrow) with initial targets at $1882. I think the target is a bit optimistic in the near term because resistances are present under the target (but it’s still possible) and I’m anticipating some retracement initially at around $1730. The RSI is trending in the right direction and is teasing an adaptive top band break (yellow arrow). It would appear that the breaking of the band may be timed around a resistance test of the VIDYA currently at around $1260. I’m still expecting bullishness this week but not with intensity until the top band can be broken. It’s very possible that we continue to range between the lower closes and $1300 accumulating until there is a little more strength to move up.
Hope we all have another good week. We are getting close to the Q3 forecast. It’s gonna be interesting. You don’t want to miss it. Publishing July 2nd. Here are a couple of tweets to go over some of the cycle stuff you’ll need to know to follow along with the methods.