

Sunday Synopsis #46: Hanginaround
Sunday Synopsis #46: Hanginaround
Way, way, way, way too long.

Hope everyone had a good week but didn't get carried away with the green. Thanks for ‘hanginaround’ waiting for me to post again. I took a much-needed mental break after all the Q3 prep work. I did make a handful of intraday trades and a few scalps. I also added a lot of content to the learning resource I’m building out for all my subscribers. Included in that is a handy journal that I use myself to track and count all my ‘crows’ trades. I hope to start releasing some portions of the learning resource this month.
BTC/USDT Weekly Structure
https://www.tradingview.com/chart/4v8qizyI/
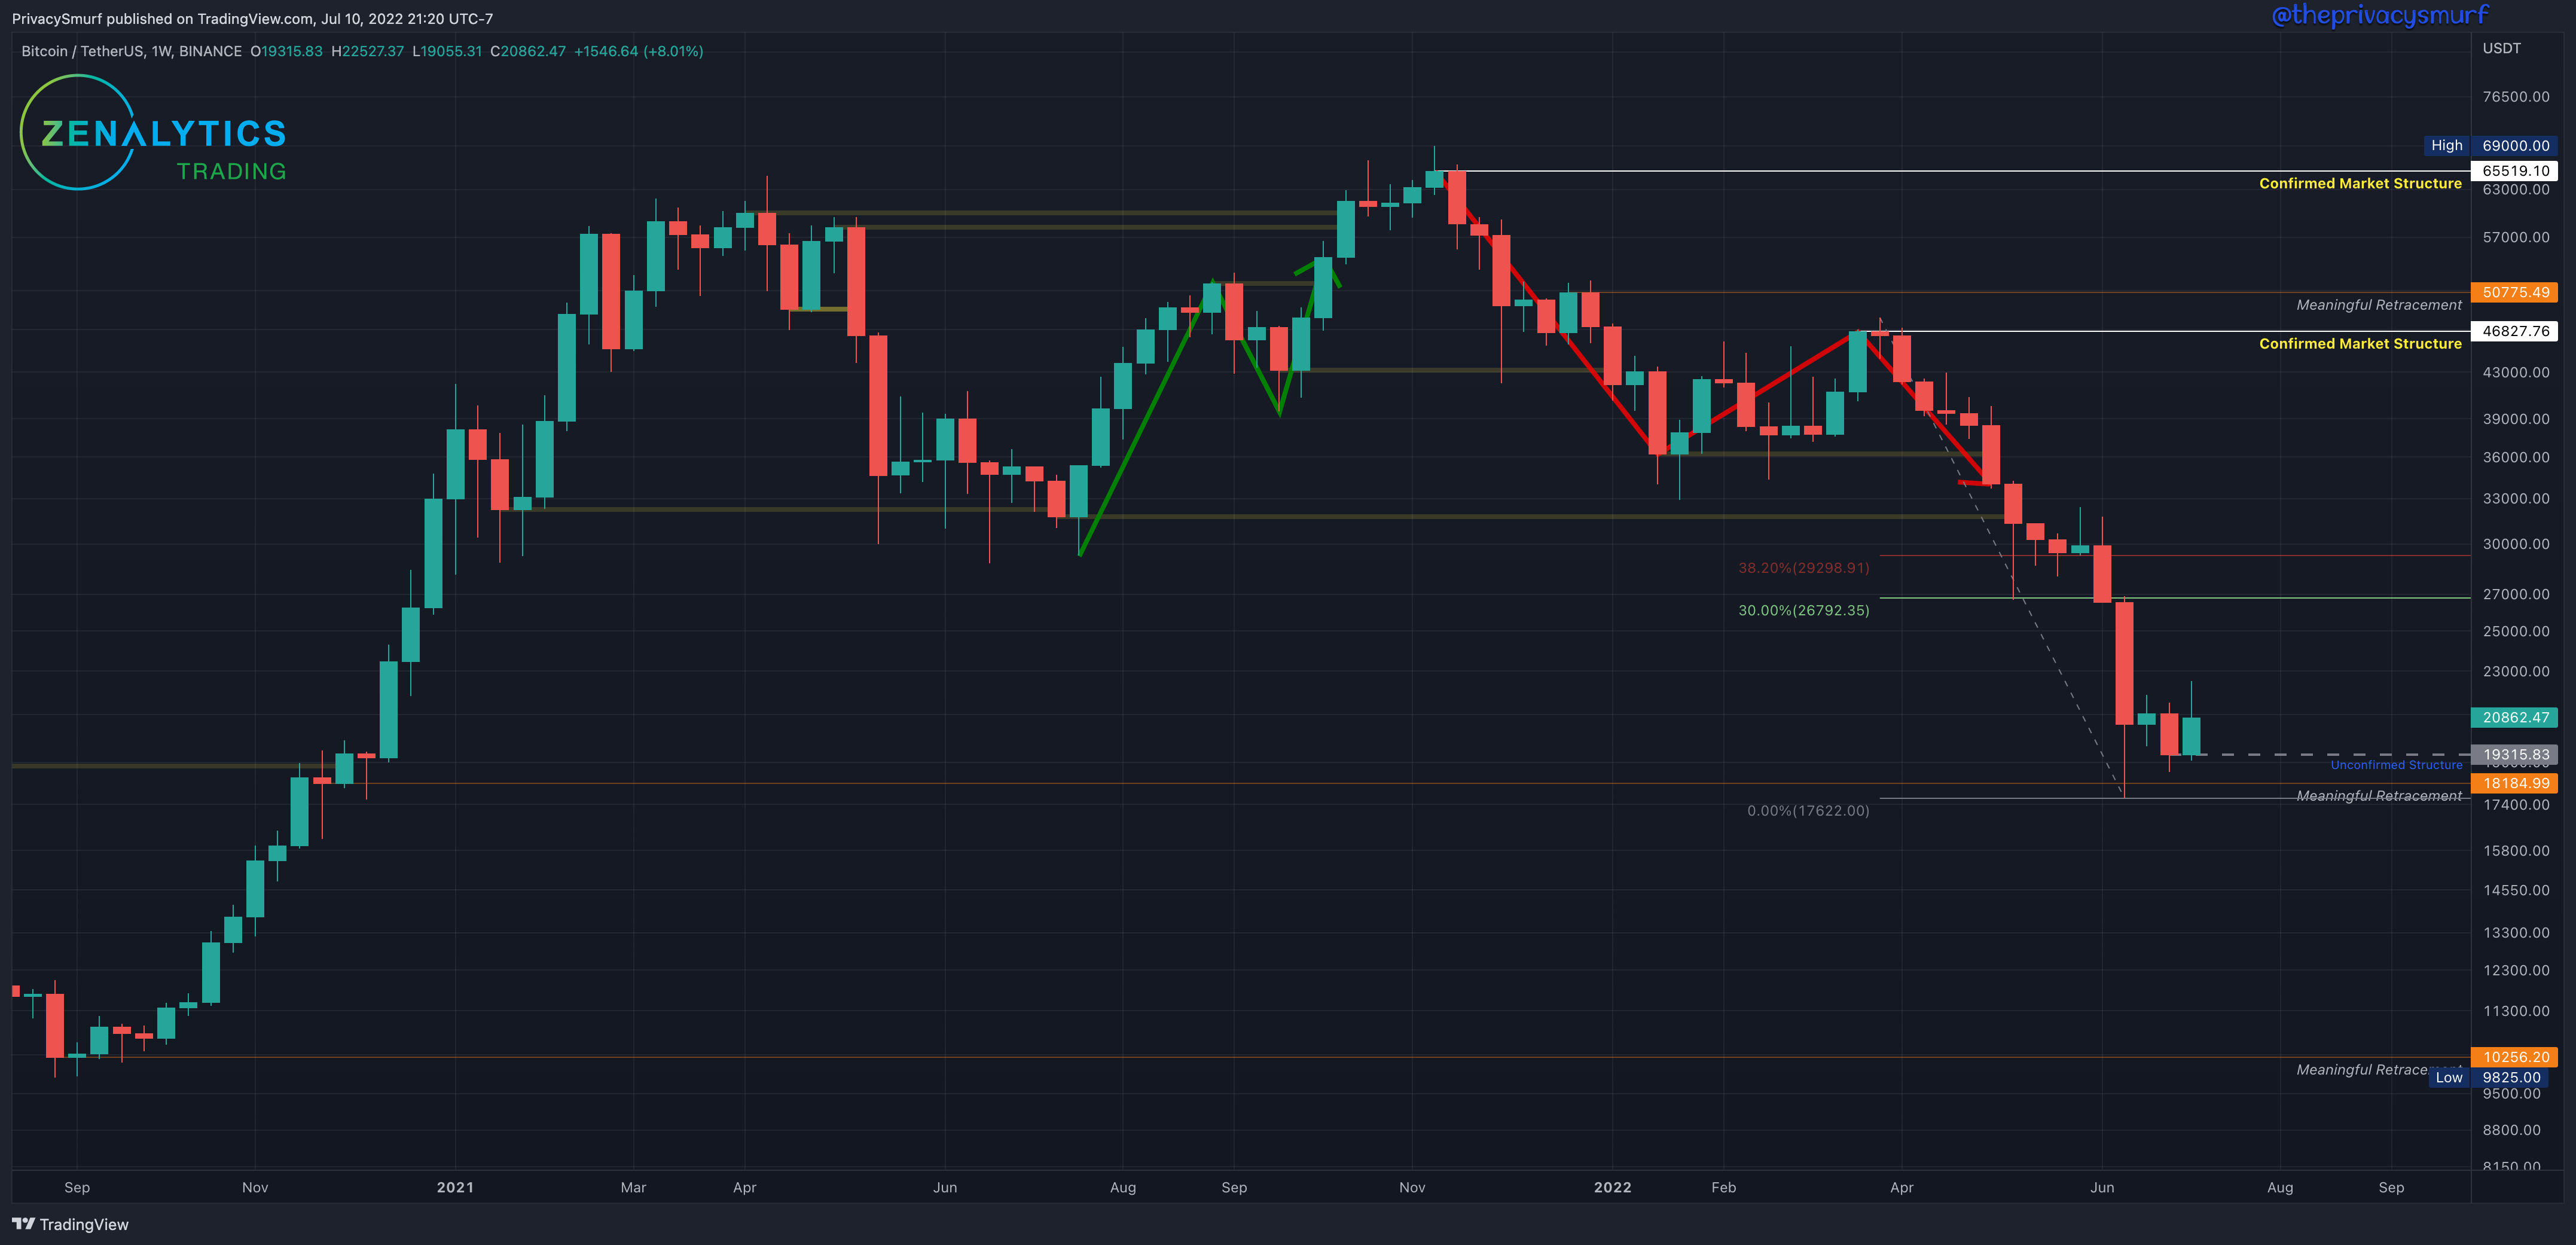
This past week BTC closed bullish. With no new lower low the fib retracement from the highest high of the last ‘Confirmed Market Structure’ resistance remains at the last lowest low at $17622. Since the last posting there has been a new lower low close at $19315 which is now the ‘Unconfirmed Structure’. If prices increase from here with a close above $29298 this will confirm the structure as support. The weekly market structure trend is still bearish.
From a long-term investing perspective, there are no moves to be made (for the HODL bags) since the ‘meaningful retracement’ at $18185 from Dec 2021 was been hit and the DCA order was filled. The next lower buy location for me is at $10256 (it is in no way an attempt to time the market or call a bottom but is a location of value). Given current technicals, I don’t expect that to be hit in the near future, but I have a DCA order there. From a long-term trading perspective, a buy order (for selling at the next cycle peak) won’t be taken by me for this timeframe until the market shifts back to bullishness.
BTC/USDT Daily Chart
https://www.tradingview.com/chart/jjSdFW4b/
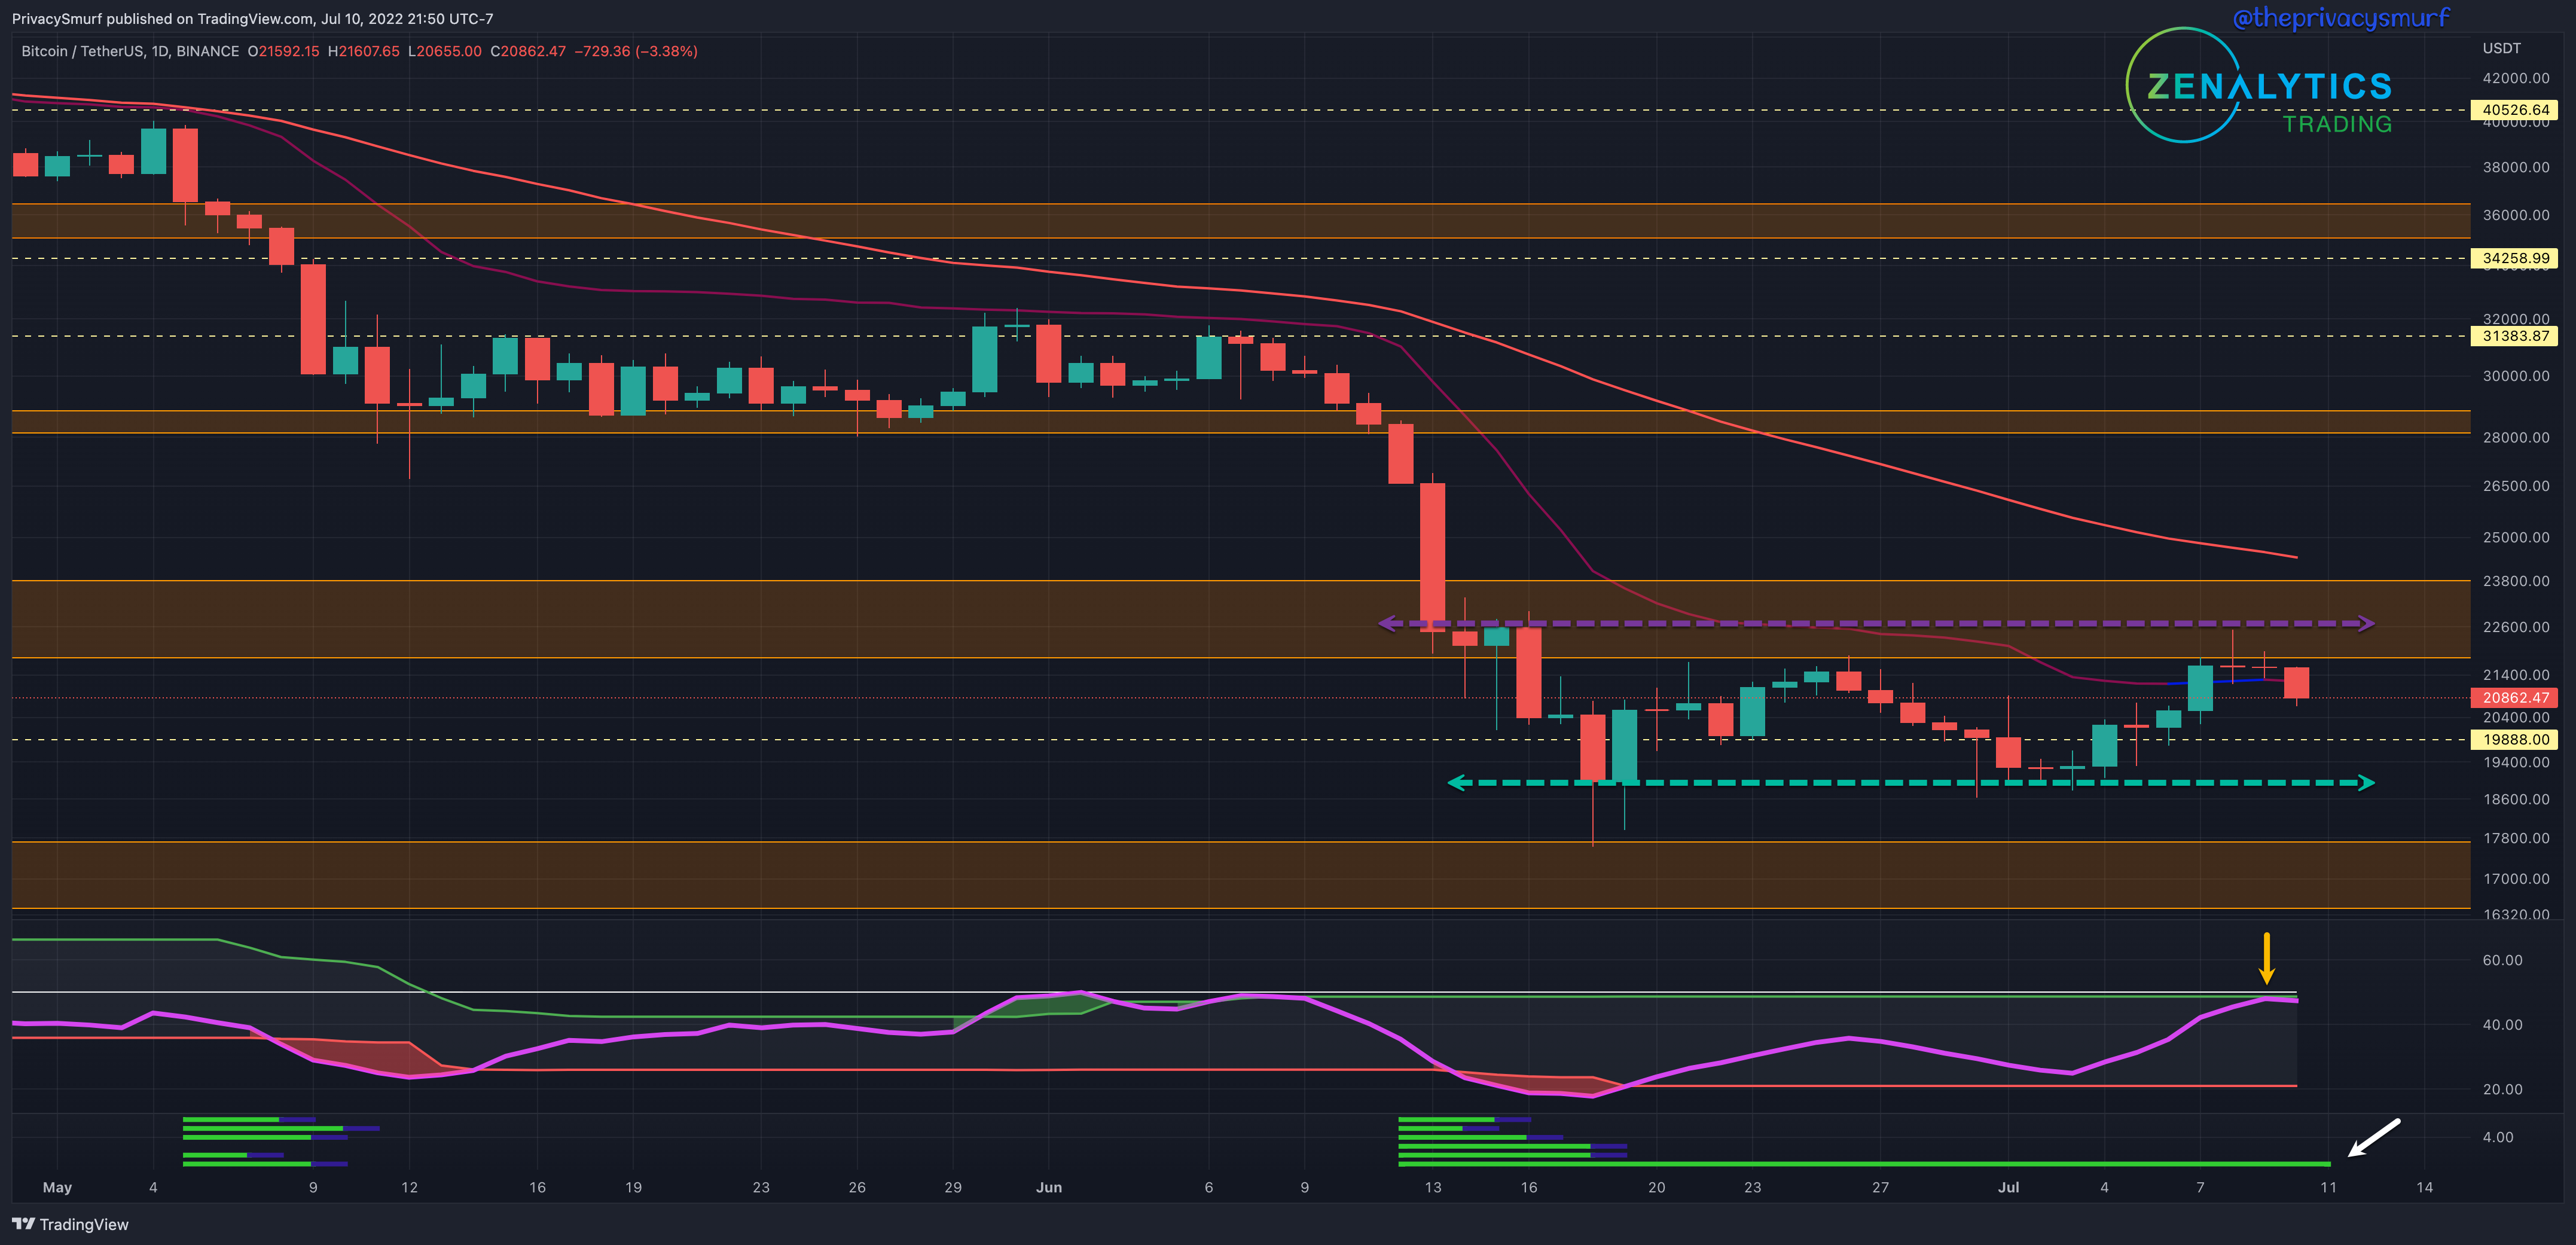
Many of the same conditions from the posting on the 26th of June still exist on this chart. The CSM at the bottom (white arrow) still hasn’t signaled a bullish trade condition yet. The resistances suggested in the last Sunday Synopsis still exist and held up when touched a few days ago (purple arrow line segment). The RSI is trending in the right direction but is still below the midline and top band (yellow arrow) which both recently rejected bullish advances. I’m still expecting bullishness for the eventual break from the range but that likely won’t happen until the top band and midline can be broken. Same as the last post, it’s possible that we continue to range between the lower closes and the resistance accumulating until there is enough strength to move up.
ETH/BTC Weekly Structure
https://www.tradingview.com/chart/sacHlXOv/
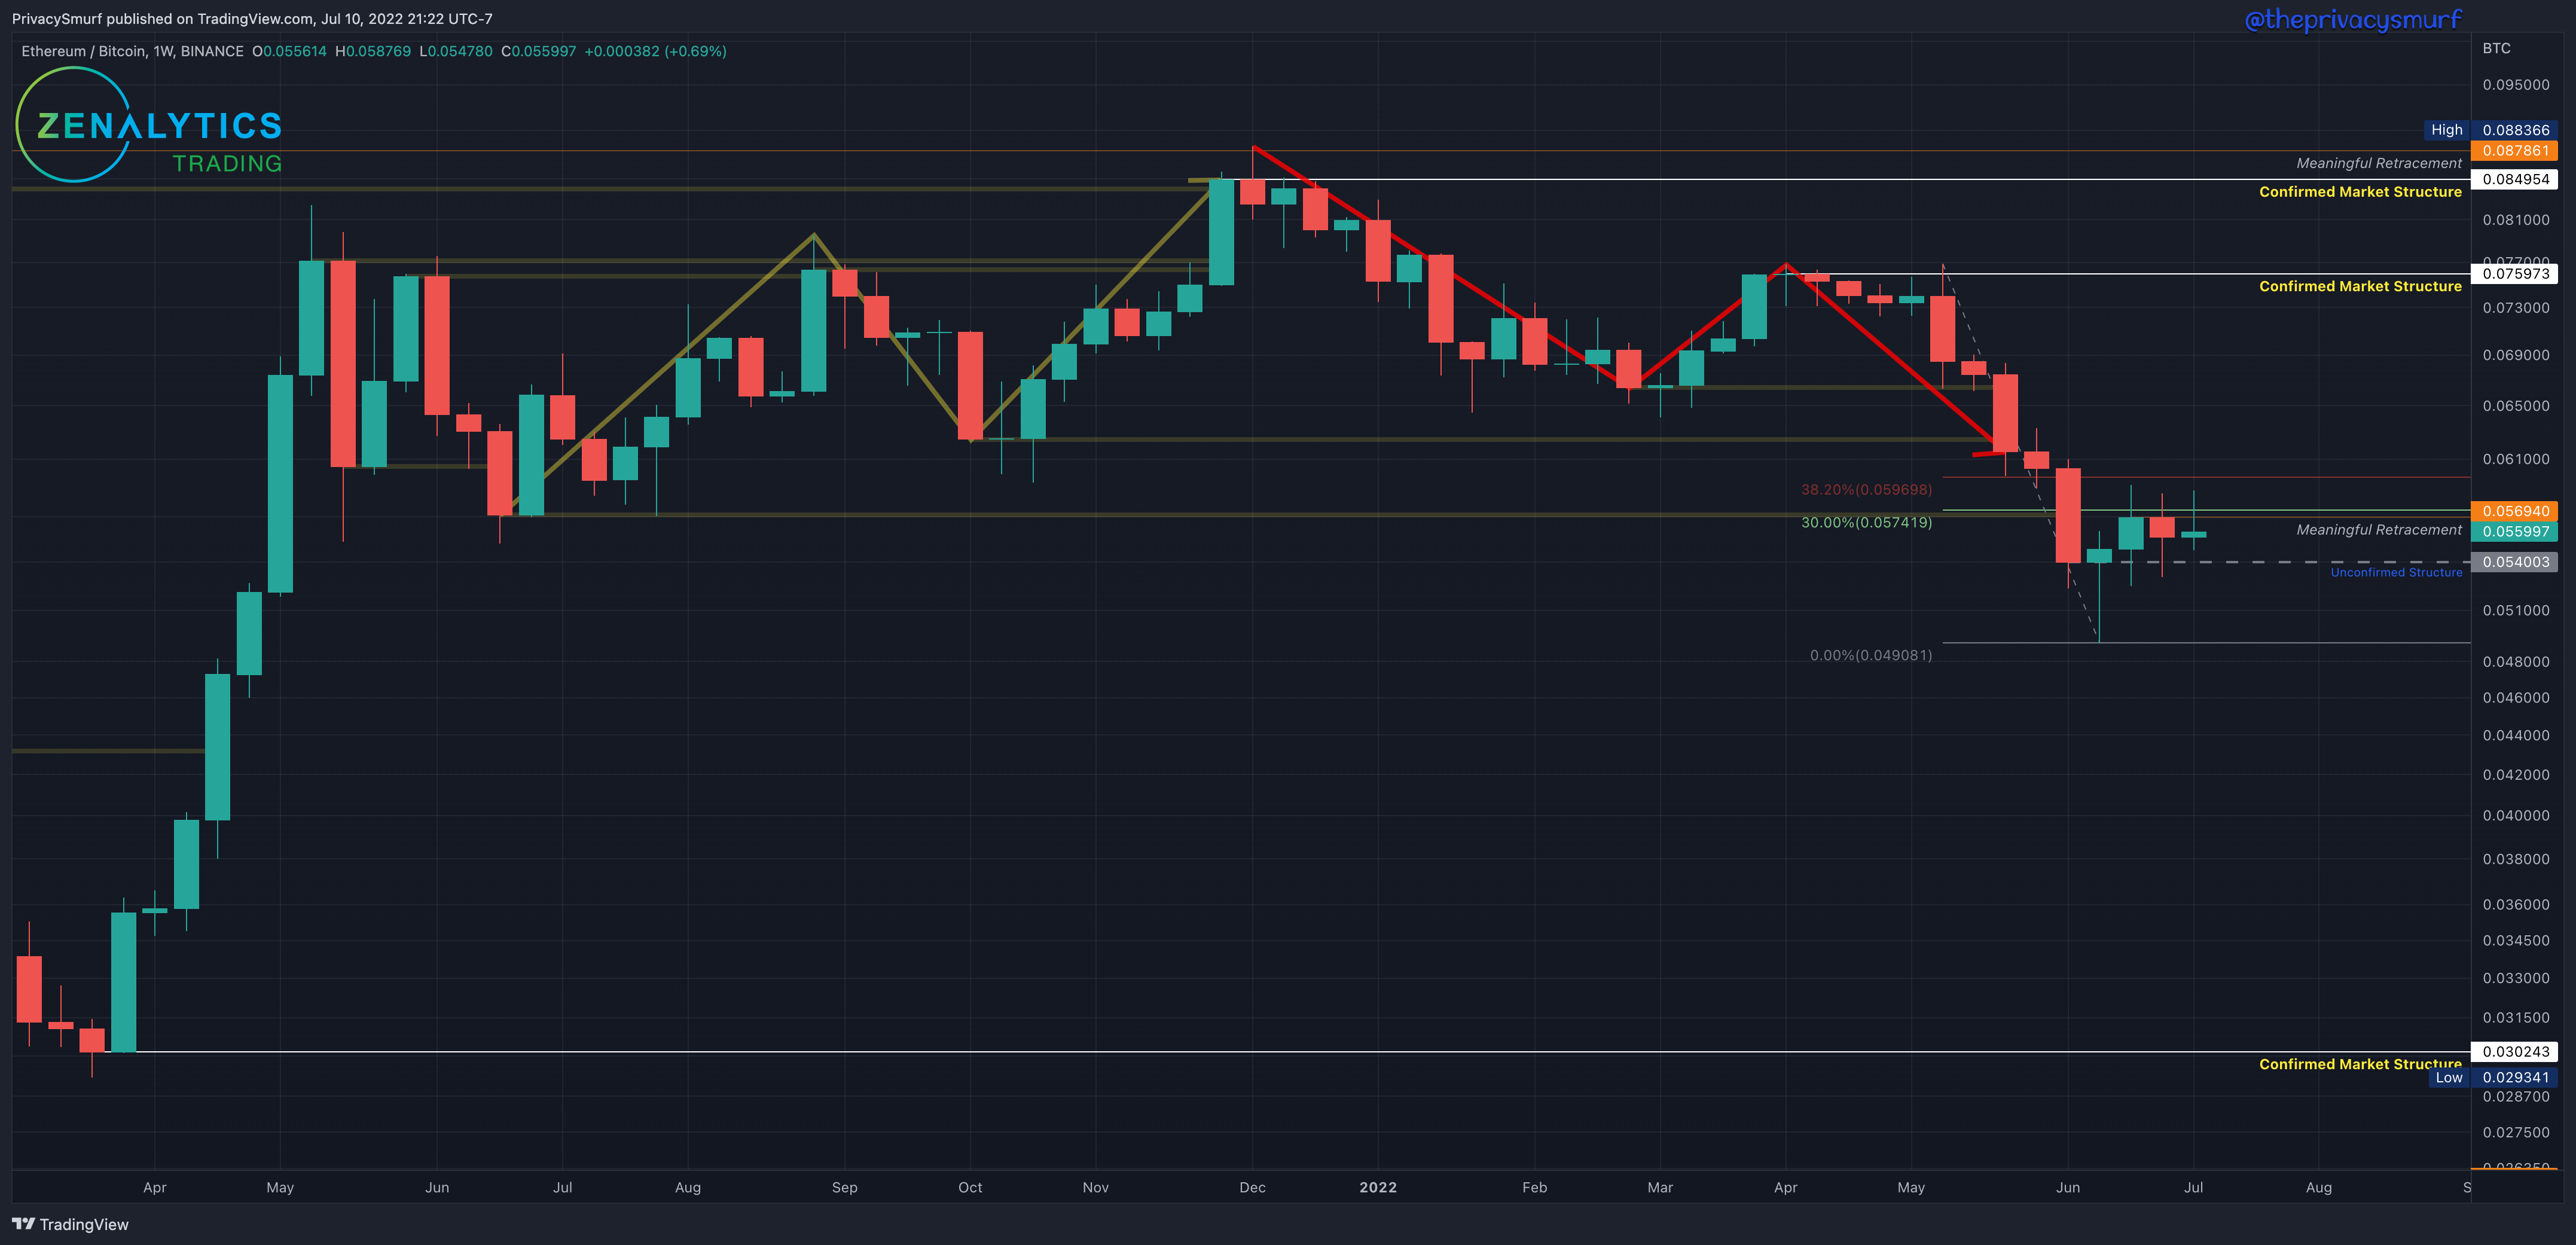
This past week closed bullish with ETH gaining very slightly on BTC. With no new lower low the fib retracement from the highest high of the last ‘Confirmed Market Structure’ resistance remains at the last lowest low at 0.049081. The lowest close remains at 0.054003 as an ‘Unconfirmed Structure’. If prices increase from here with a close above 0.059698 this will confirm the structure as support. The weekly market structure trend is still bearish. Since our last post highs wicked over the 30% retracement level. By my measure, these rallies qualify as “meaningful retracements” from the prevailing downtrend, bullish activity beyond the random walk of the market. In these instances, I label the highest close of the rally (0.055997) and consider it a potential resistance when met in the future.
From a long-term investing perspective, the next market structure is at 0.030243 with the possibility to act as support. I expect that if we continue to lose value in the ETH/BTC relationship the broken structure at just under 0.044 (from 2021) will act as support. I have a long-term DCA buy there (it is in no way an attempt to time the market or call a bottom but is a location of value). Given current technicals, **I don’t expect that to be hit in the near future, but I have a DCA order there. From a long-term trading perspective, a buy order (for selling at the next cycle peak) won’t be taken by me for this timeframe until the market shifts back to bullishness.
ETH/BTC Daily Structure
https://www.tradingview.com/chart/gTkSjkj6/
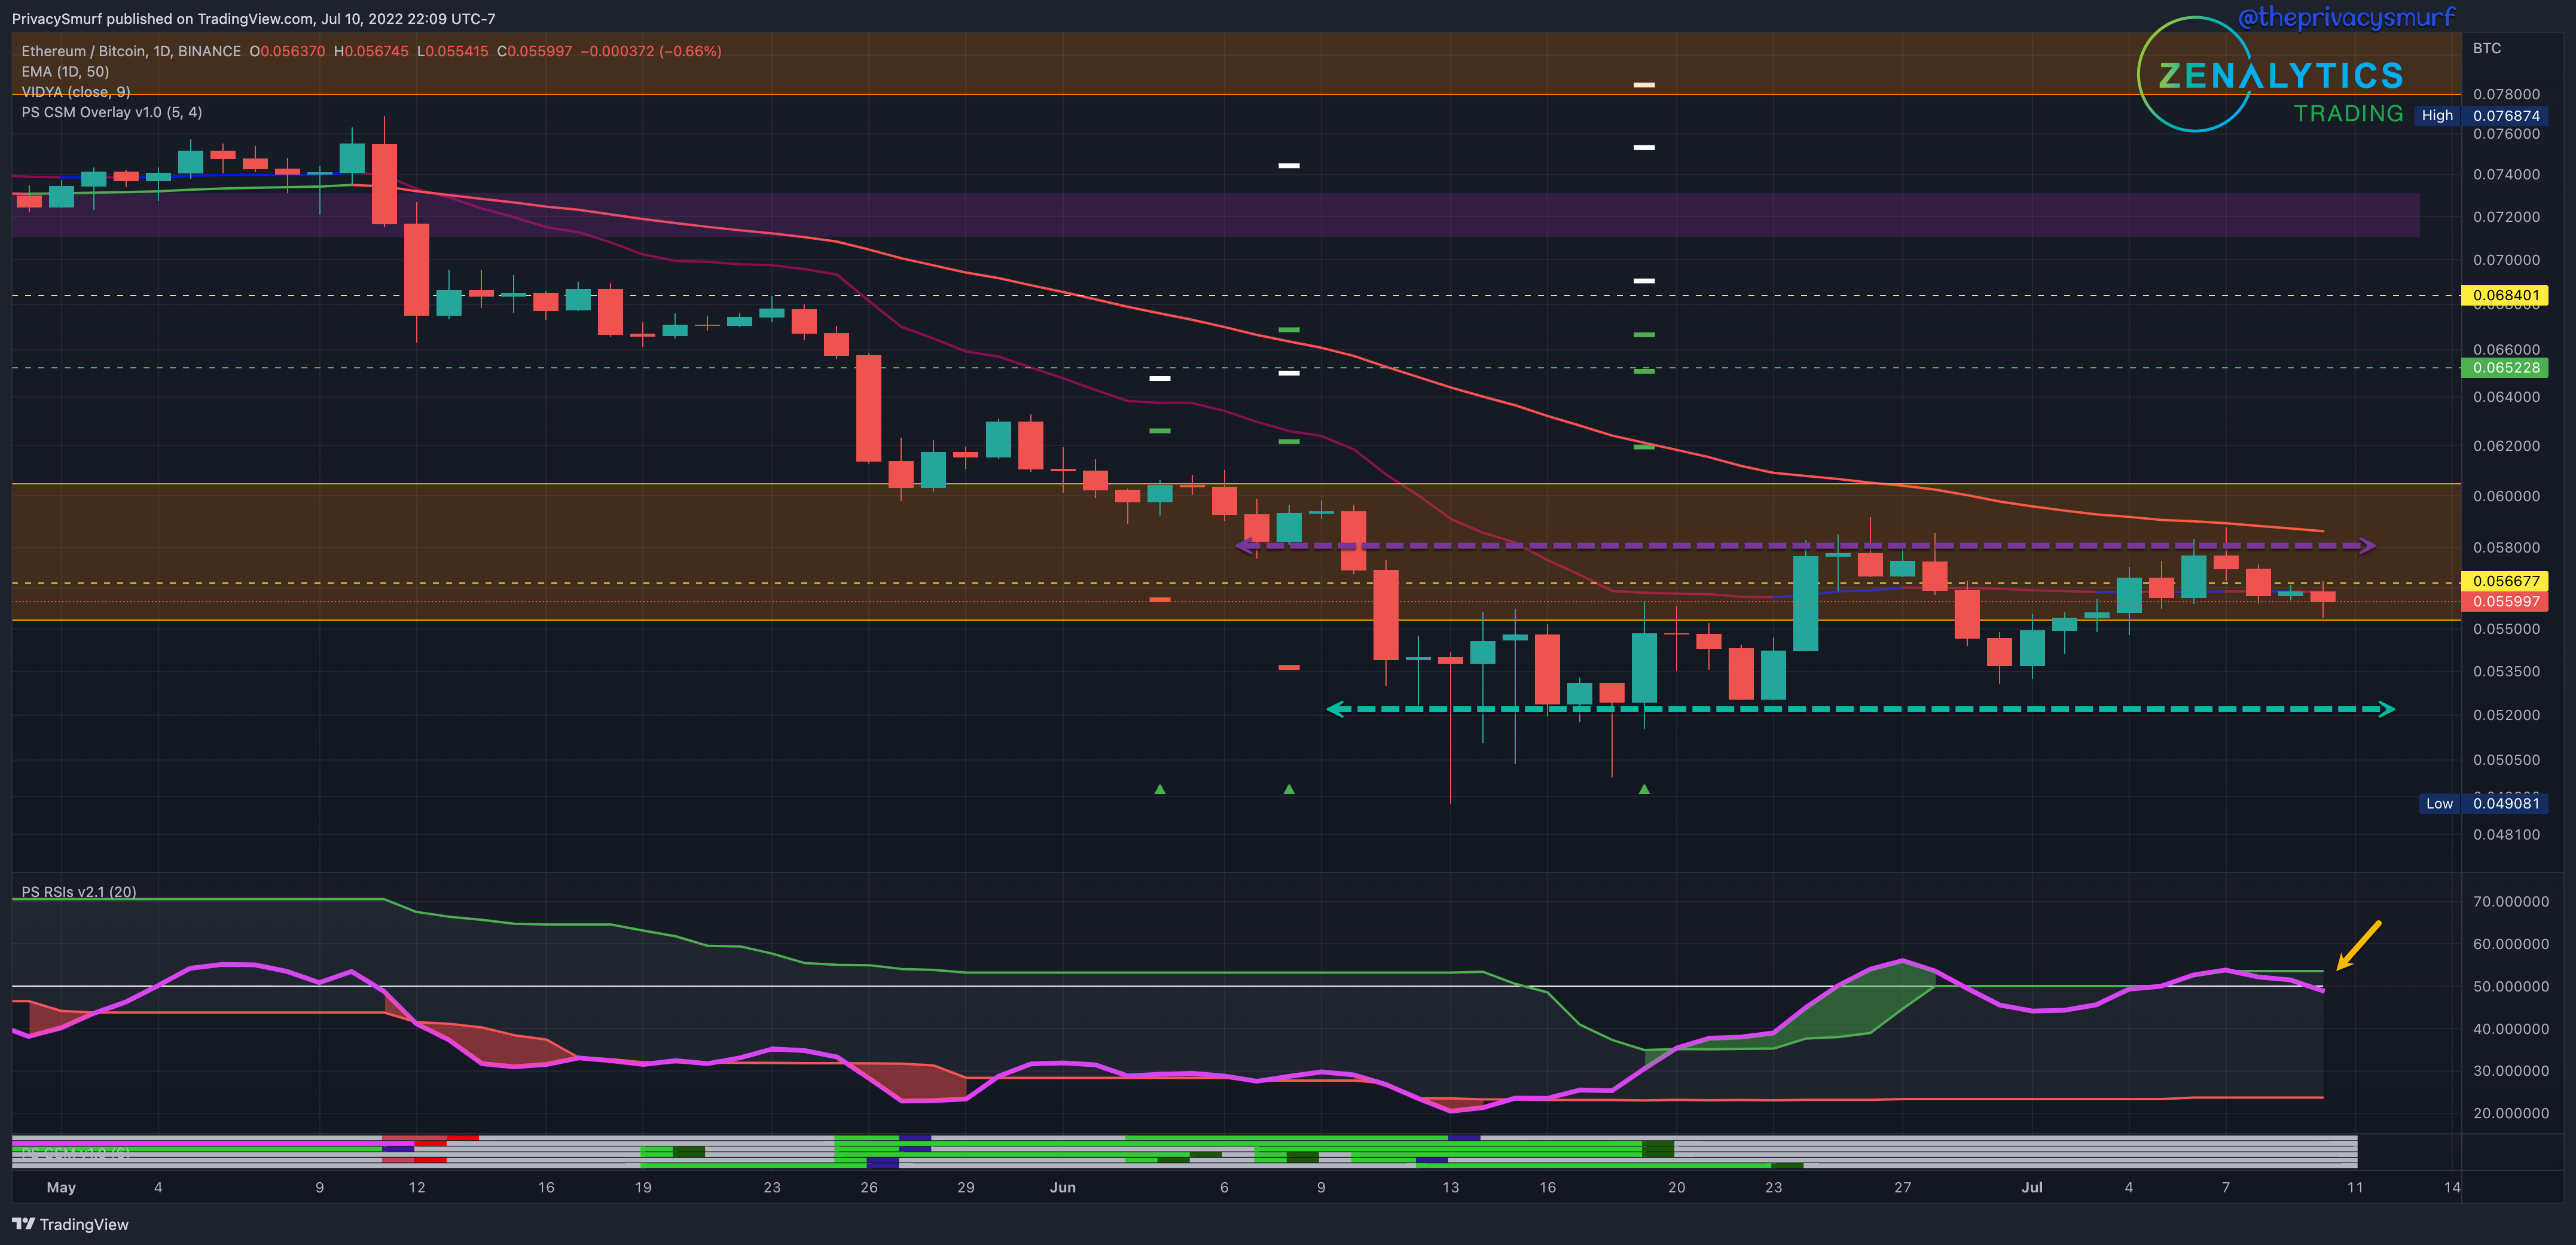
The daily picture shows the same ranging activity, which would be reflected later in the ETH/USDT chart mirroring BTC/USDT. The RSI here (yellow arrow) is now falling back below the top band and midline suggesting bearish influence and a likely pause on any bullish volatility. I’d expect a support test. Resistances still exist at around 0.060 and the 50-Day EMA has crept lower to around 0.058. If candles can break above that level ETH has the possibility of gaining in value much greater than BTC. At that point, short-term positions in ETH and likely altcoins would be viable and I’d be looking for stronger performing coins across the market for short-term long trades. The top side resistance I’d put up at around 0.066. Ranging markets are the in thing apparently and ETH/BTC is no different. It’s possible that we continue to range between the lower closes accumulating until there is a little more strength to move up.
ETH/USDT Weekly Structure
https://www.tradingview.com/chart/JPTp0aXw/
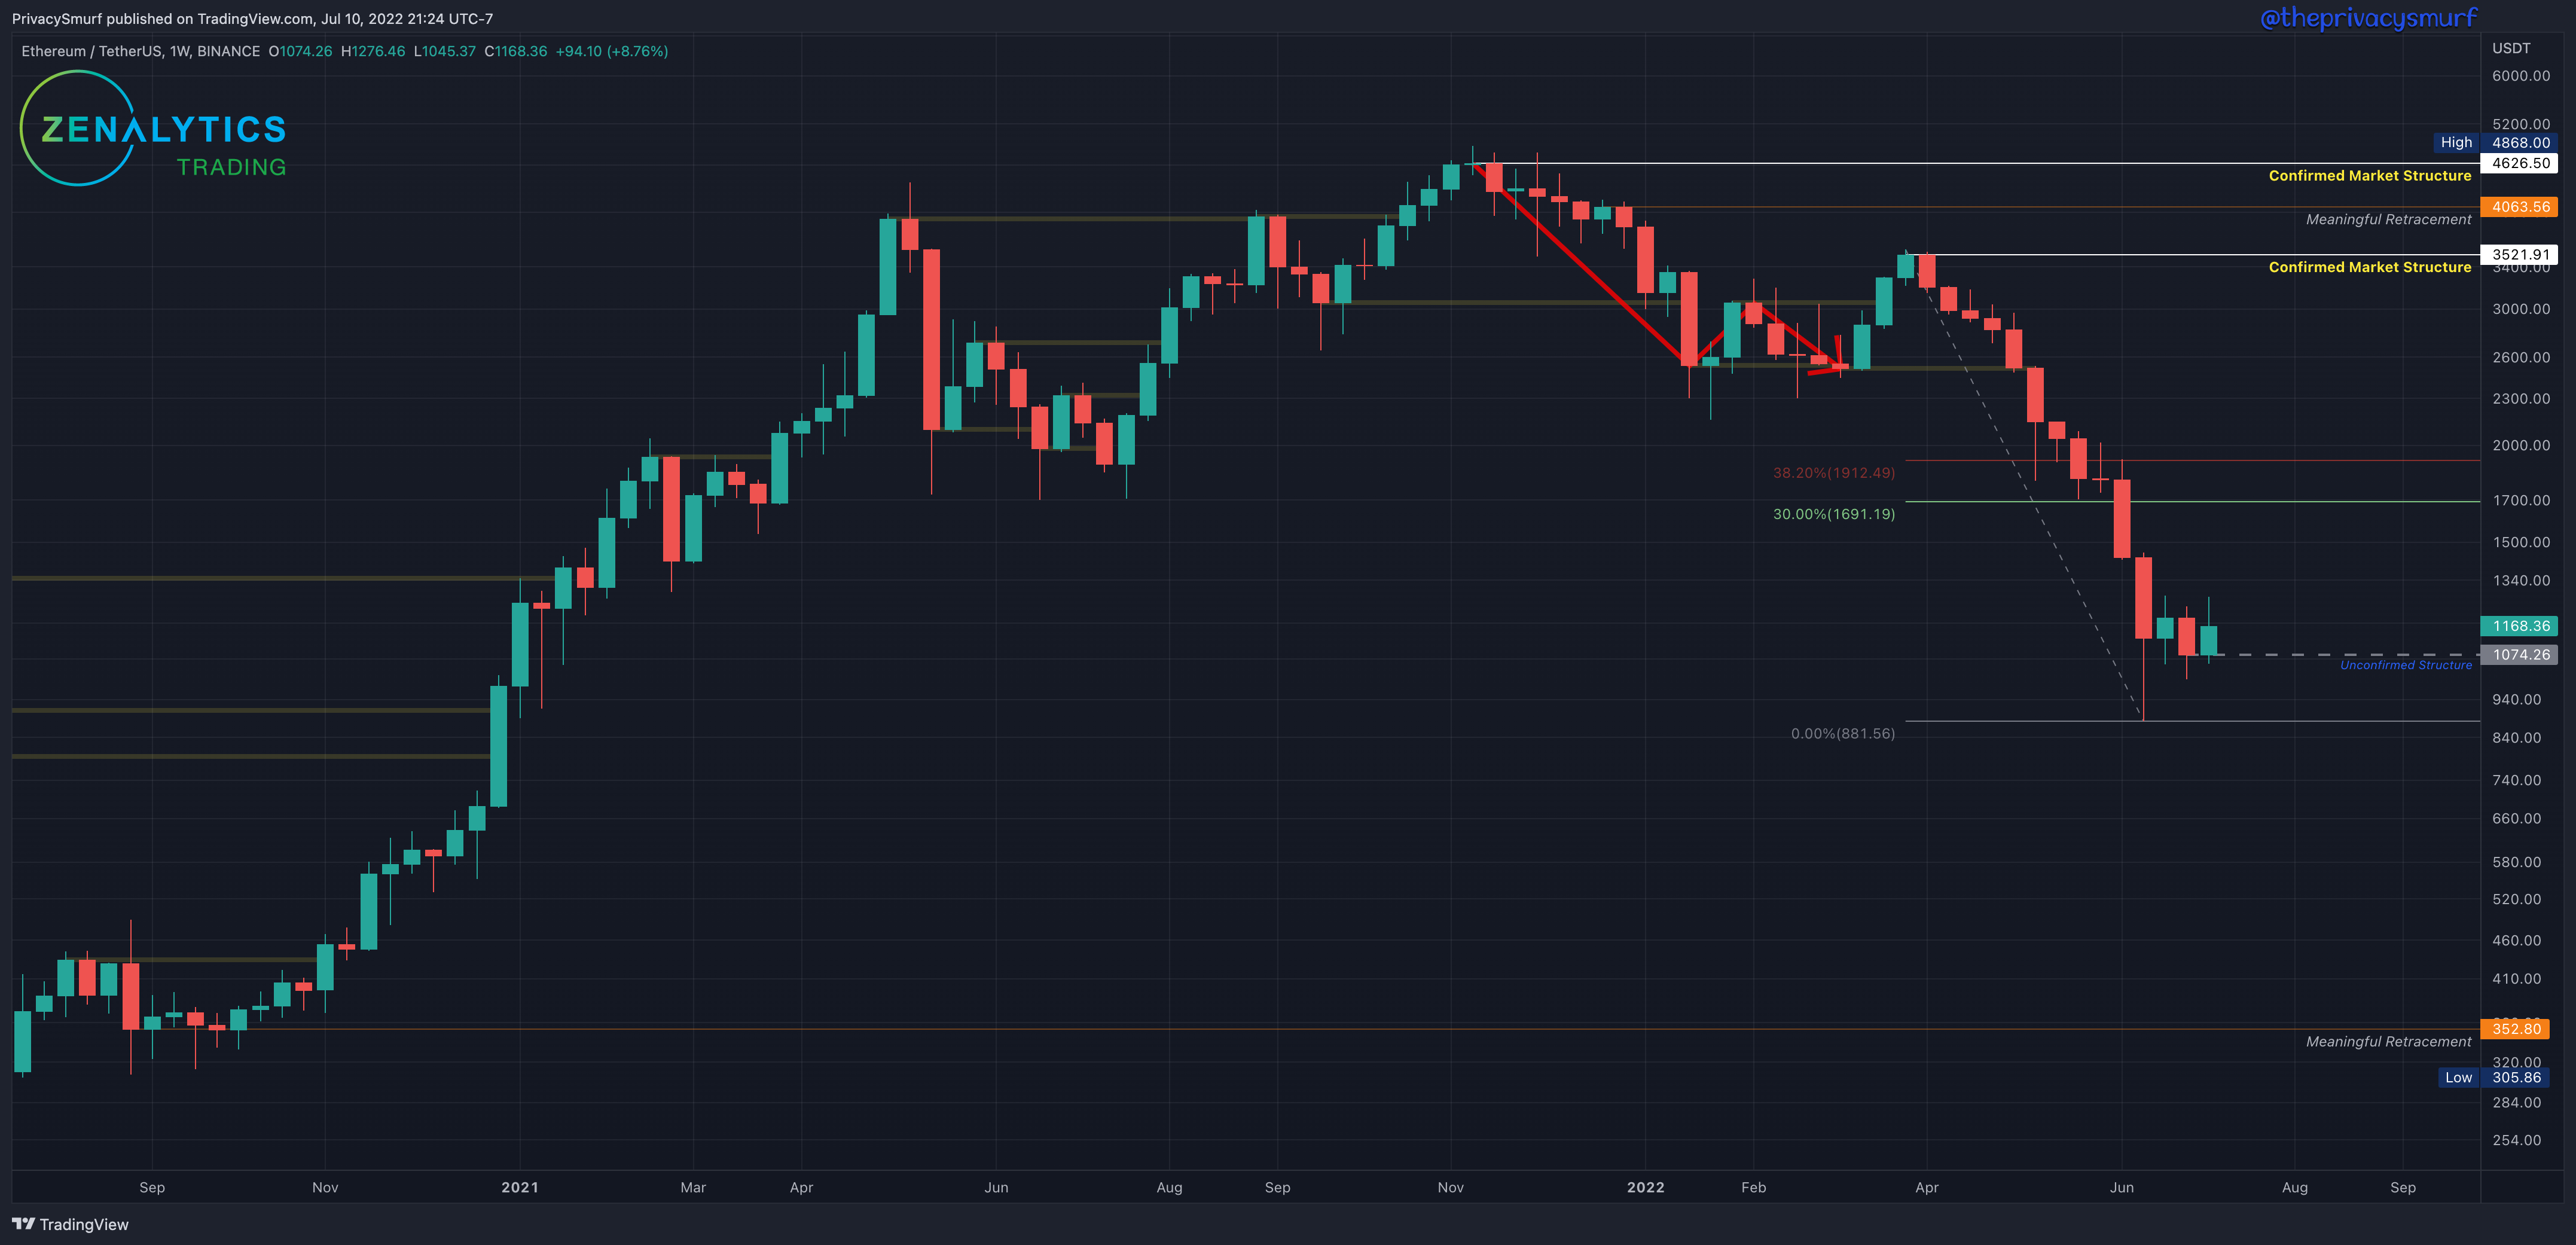
Similar to BTC, this past week ETH closed bullish. With no new lower low the fib retracement from the highest high of the last ‘Confirmed Market Structure’ resistance remains at the last lowest low at $881. Since the last posting there has been a new lower low close at $1074 which is now the ‘Unconfirmed Structure’. If prices increase from here with a close above $1912 this will confirm the structure as support. The weekly market structure trend is still bearish.
From a long-term investing perspective, there are no moves to be made (for the HODL bags) since the ‘meaningful retracement’ at $1232 from Jan 2021 was been hit and the DCA order was filled. The next lower buy location for me is at $352 and potentially at the broken structure at $800 from 2021 (it is in no way an attempt to time the market or call a bottom but is a location of value). Given current technicals, I don’t expect that to be hit in the near future, but I have a DCA order there. From a long-term trading perspective, a buy order (for selling at the next cycle peak) won’t be taken by me for this timeframe until the market shifts back to bullishness.
ETH/USDT Daily Structure
https://www.tradingview.com/chart/xbB6lkZu/
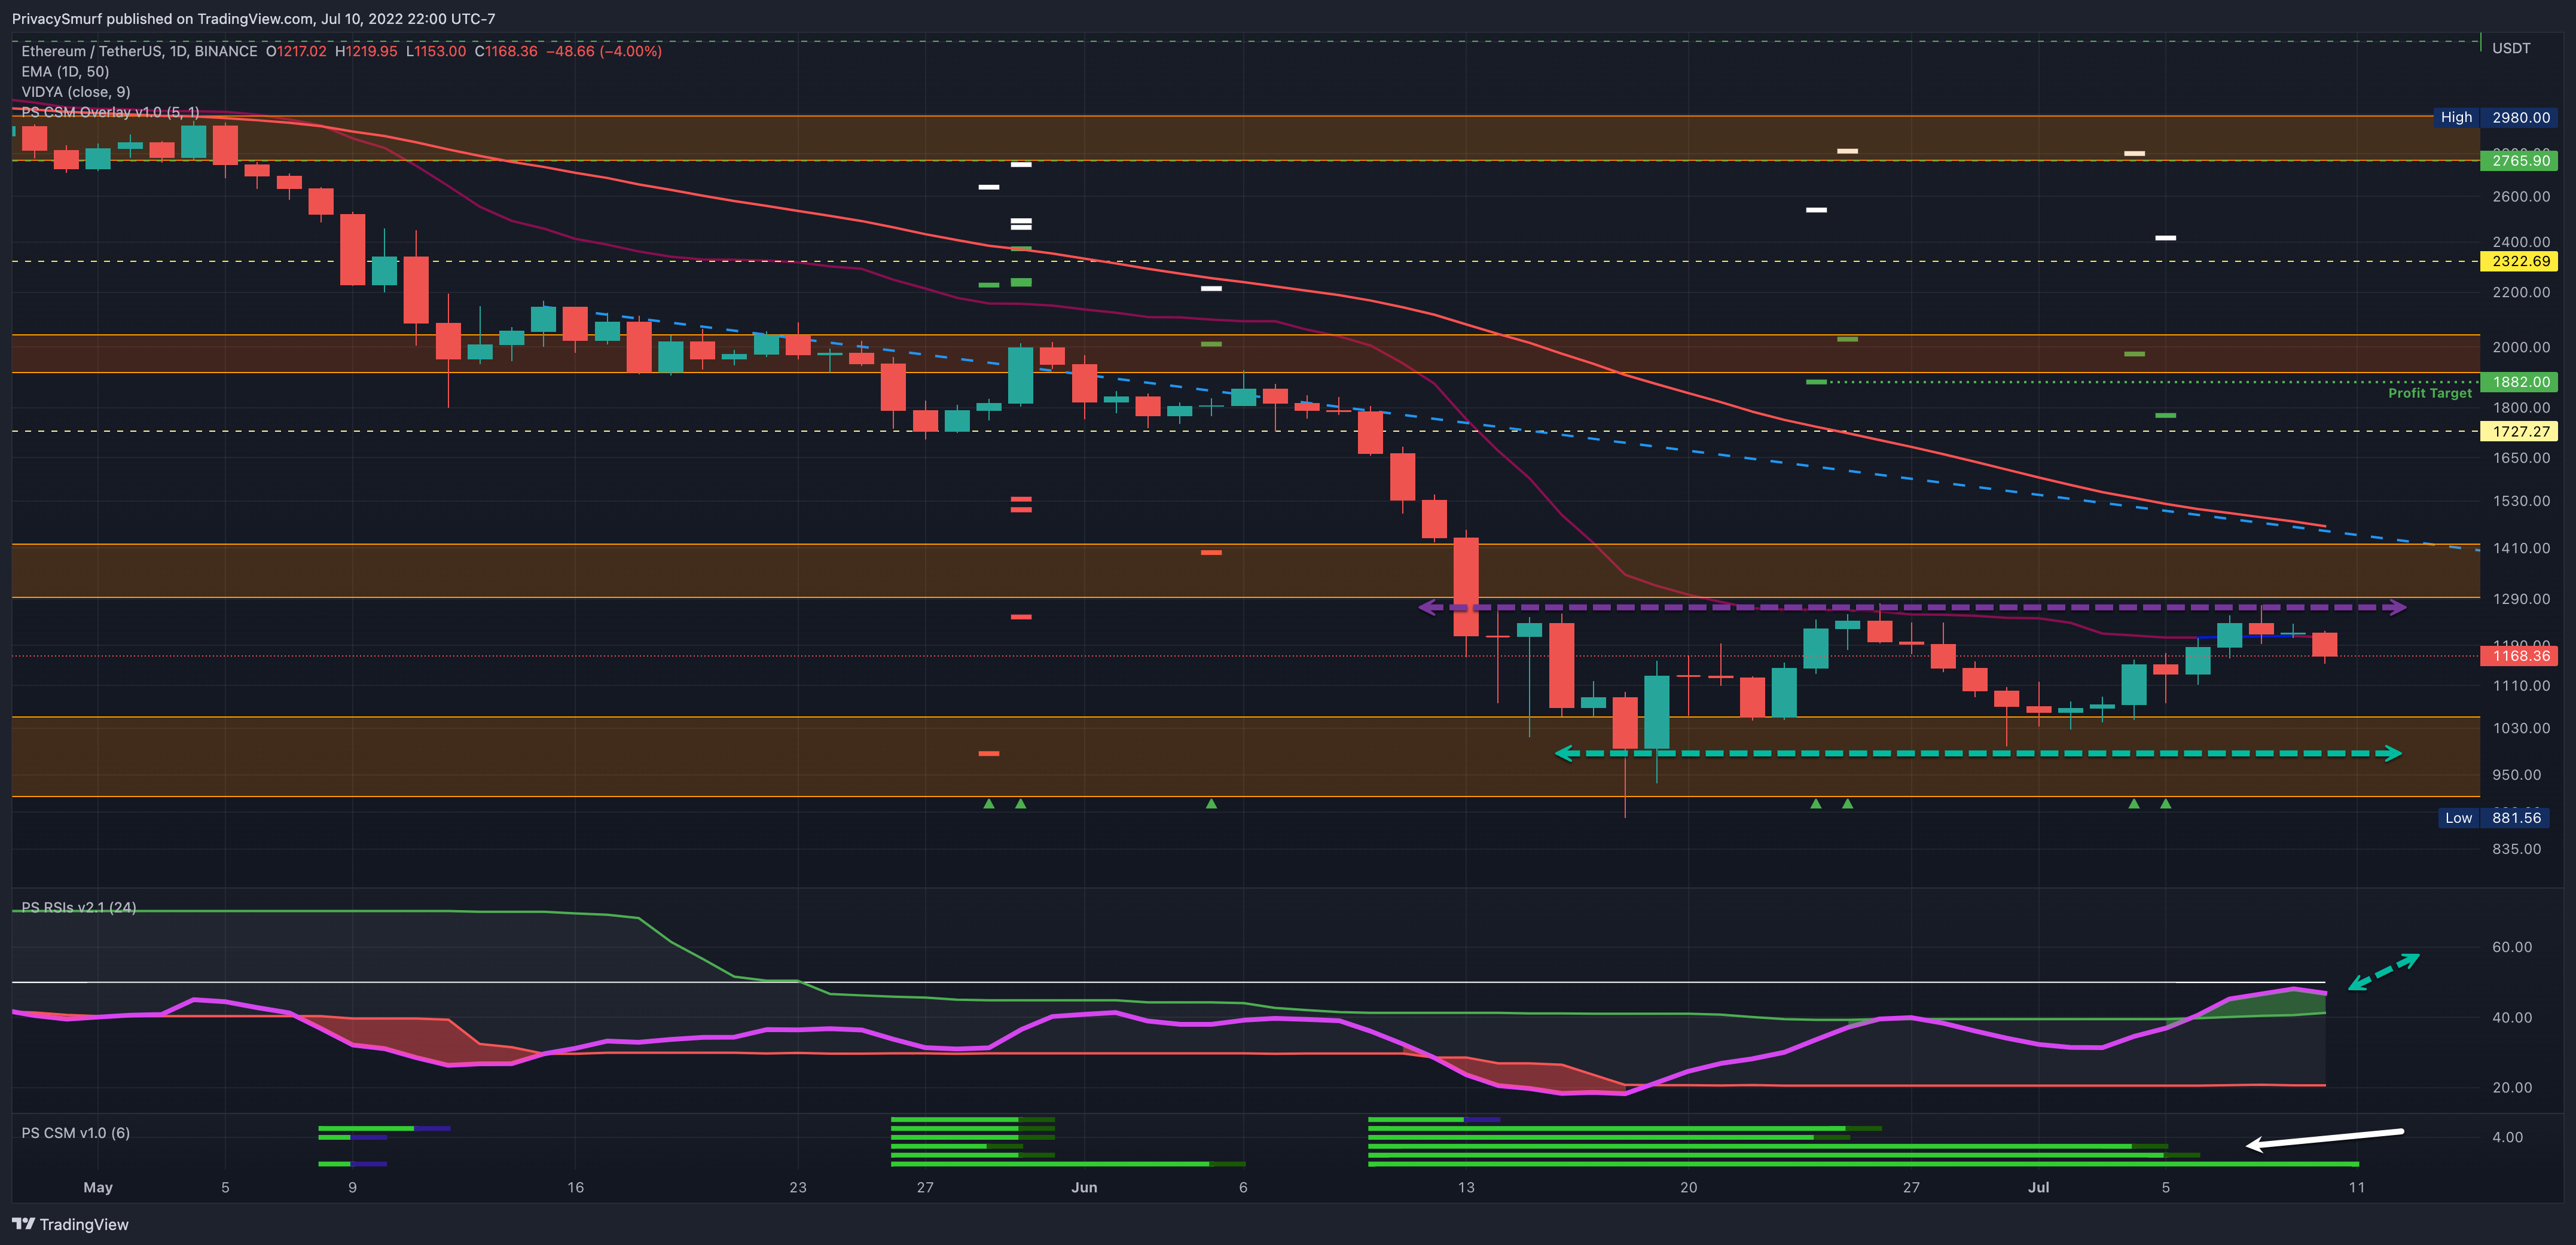
Sometimes I feel like a broken record but the same technical conditions from the last posting still exist on this chart. The CSM at the bottom (white arrow) has signaled a bullish trade condition just after a bullish engulfing candle close (green arrow) with initial targets at $1882. Consecutive trade signals also put targets around the 1800 level as shown on July 4th and 5th. So far it’s been correct in thinking the profit target is a bit optimistic and I’m still anticipating some retracement initially at around $1730 once we break the range. The RSI did manage to break the top band but remained under the midline maintaining the dominant bearish influence on prices (yellow arrow). The prior post suggesting the breaking of the band might be timed around a resistance test of the VIDYA currently at around $1260 was on point but prices couldn't be held above for long falling under again. I’m still expecting bullishness for the eventual break from the range but that likely won’t happen until the midline can be broken. If the RSI returns back under the top band that would be more indication that bullish volatility has normalized and we will likely return to the ranging activity. It’s possible that we continue to range between the lower closes and $1300 accumulating until there is a little more strength to move up.
We’ll be back to the normal posting schedule this week. See you then.
@theprivacysmurf