

Sunday Synopsis #47: Pursuit of Happiness
Sunday Synopsis #47: Pursuit of Happiness
Everything that shine ain't always gonna be gold

A great end to the week. Bounce plays from last week paid out nicely. Been another great summer weather week in the pacific northwest. I spent time outside ‘living my life’ and made some good trades that continue to provide the capital for my partner and me to be ‘getting our dreams.’
BTC/USDT Weekly Structure
https://www.tradingview.com/chart/4v8qizyI/
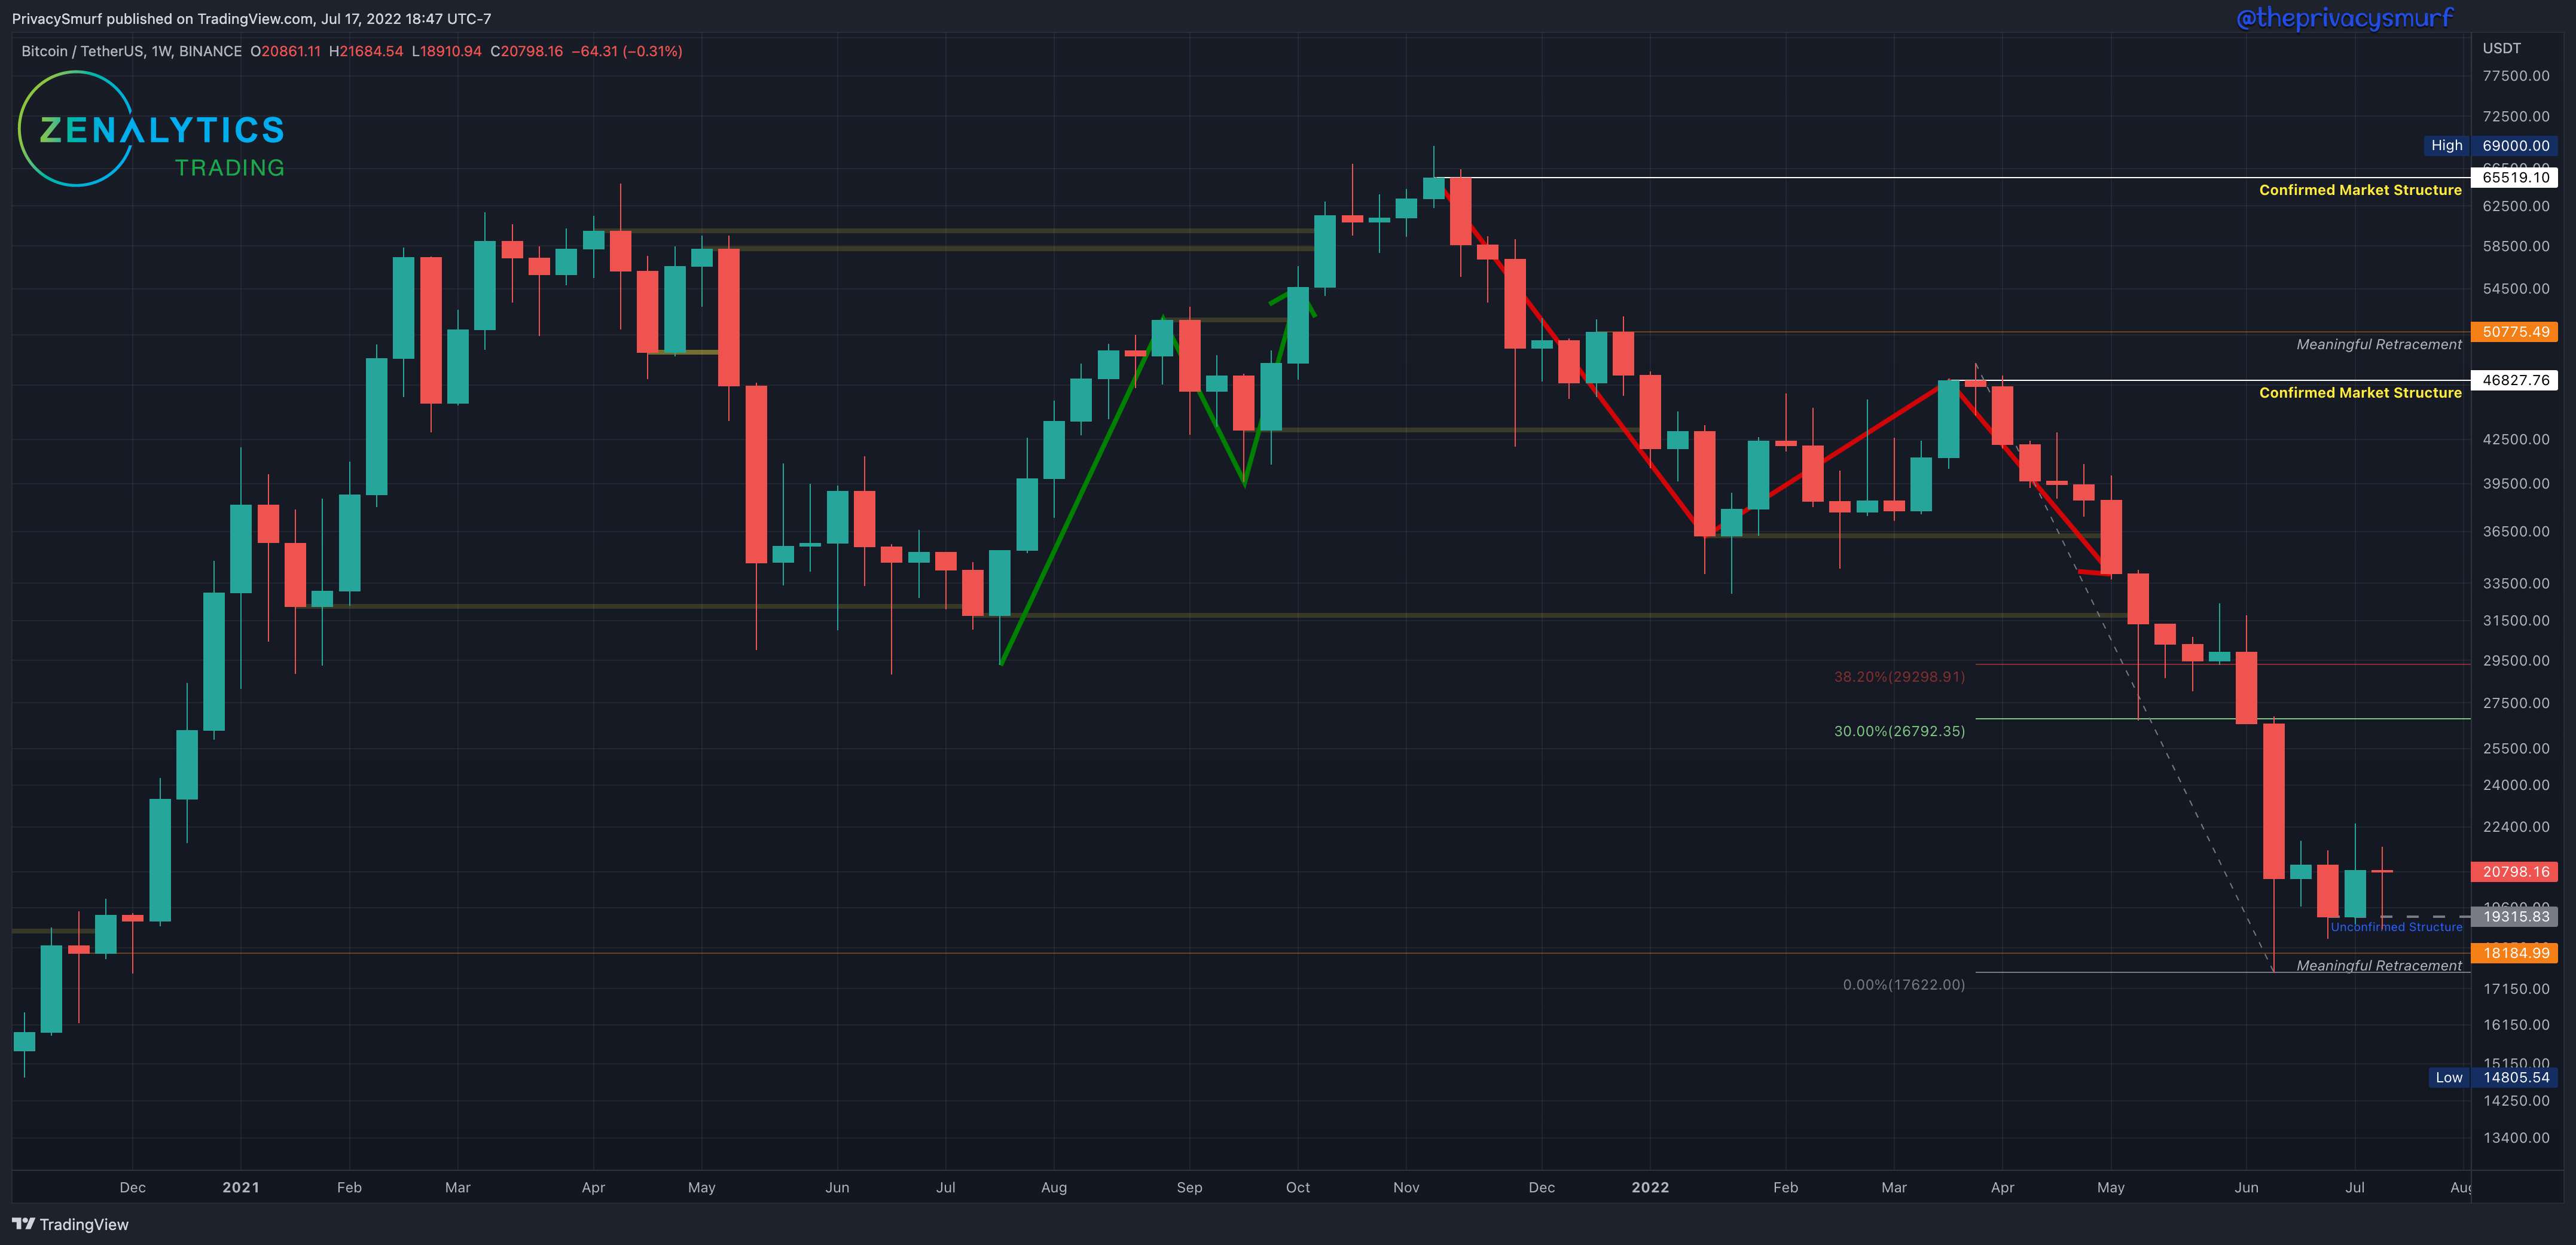
This past week BTC closed bearish. With no new lower low, the fib retracement from the highest high of the last ‘Confirmed Market Structure’ resistance remains at the last lowest low at $17622. Since the last posting, there has been a new lower low close past $19315, which is the ‘Unconfirmed Structure.’ If prices increase from here with a close above $29298, this will confirm the structure as support. The weekly market structure trend is still bearish.
From a long-term investing perspective, there are no moves to be made (for the HODL bags) since the ‘meaningful retracement’ at $18185 from Dec 2021 was been hit and the DCA order was filled. The next lower buy location for me is at $10256 (it is in no way an attempt to time the market or call a bottom but is a location of value). Given current technicals, I don’t expect that to hit soon, but I have a DCA order. From a long-term trading perspective, a buy order (for selling at the next cycle peak) won’t be taken by me for this timeframe until the market shifts back to bullishness. I want to buy strength, not weakness.
BTC/USDT Daily Chart
https://www.tradingview.com/chart/jjSdFW4b/
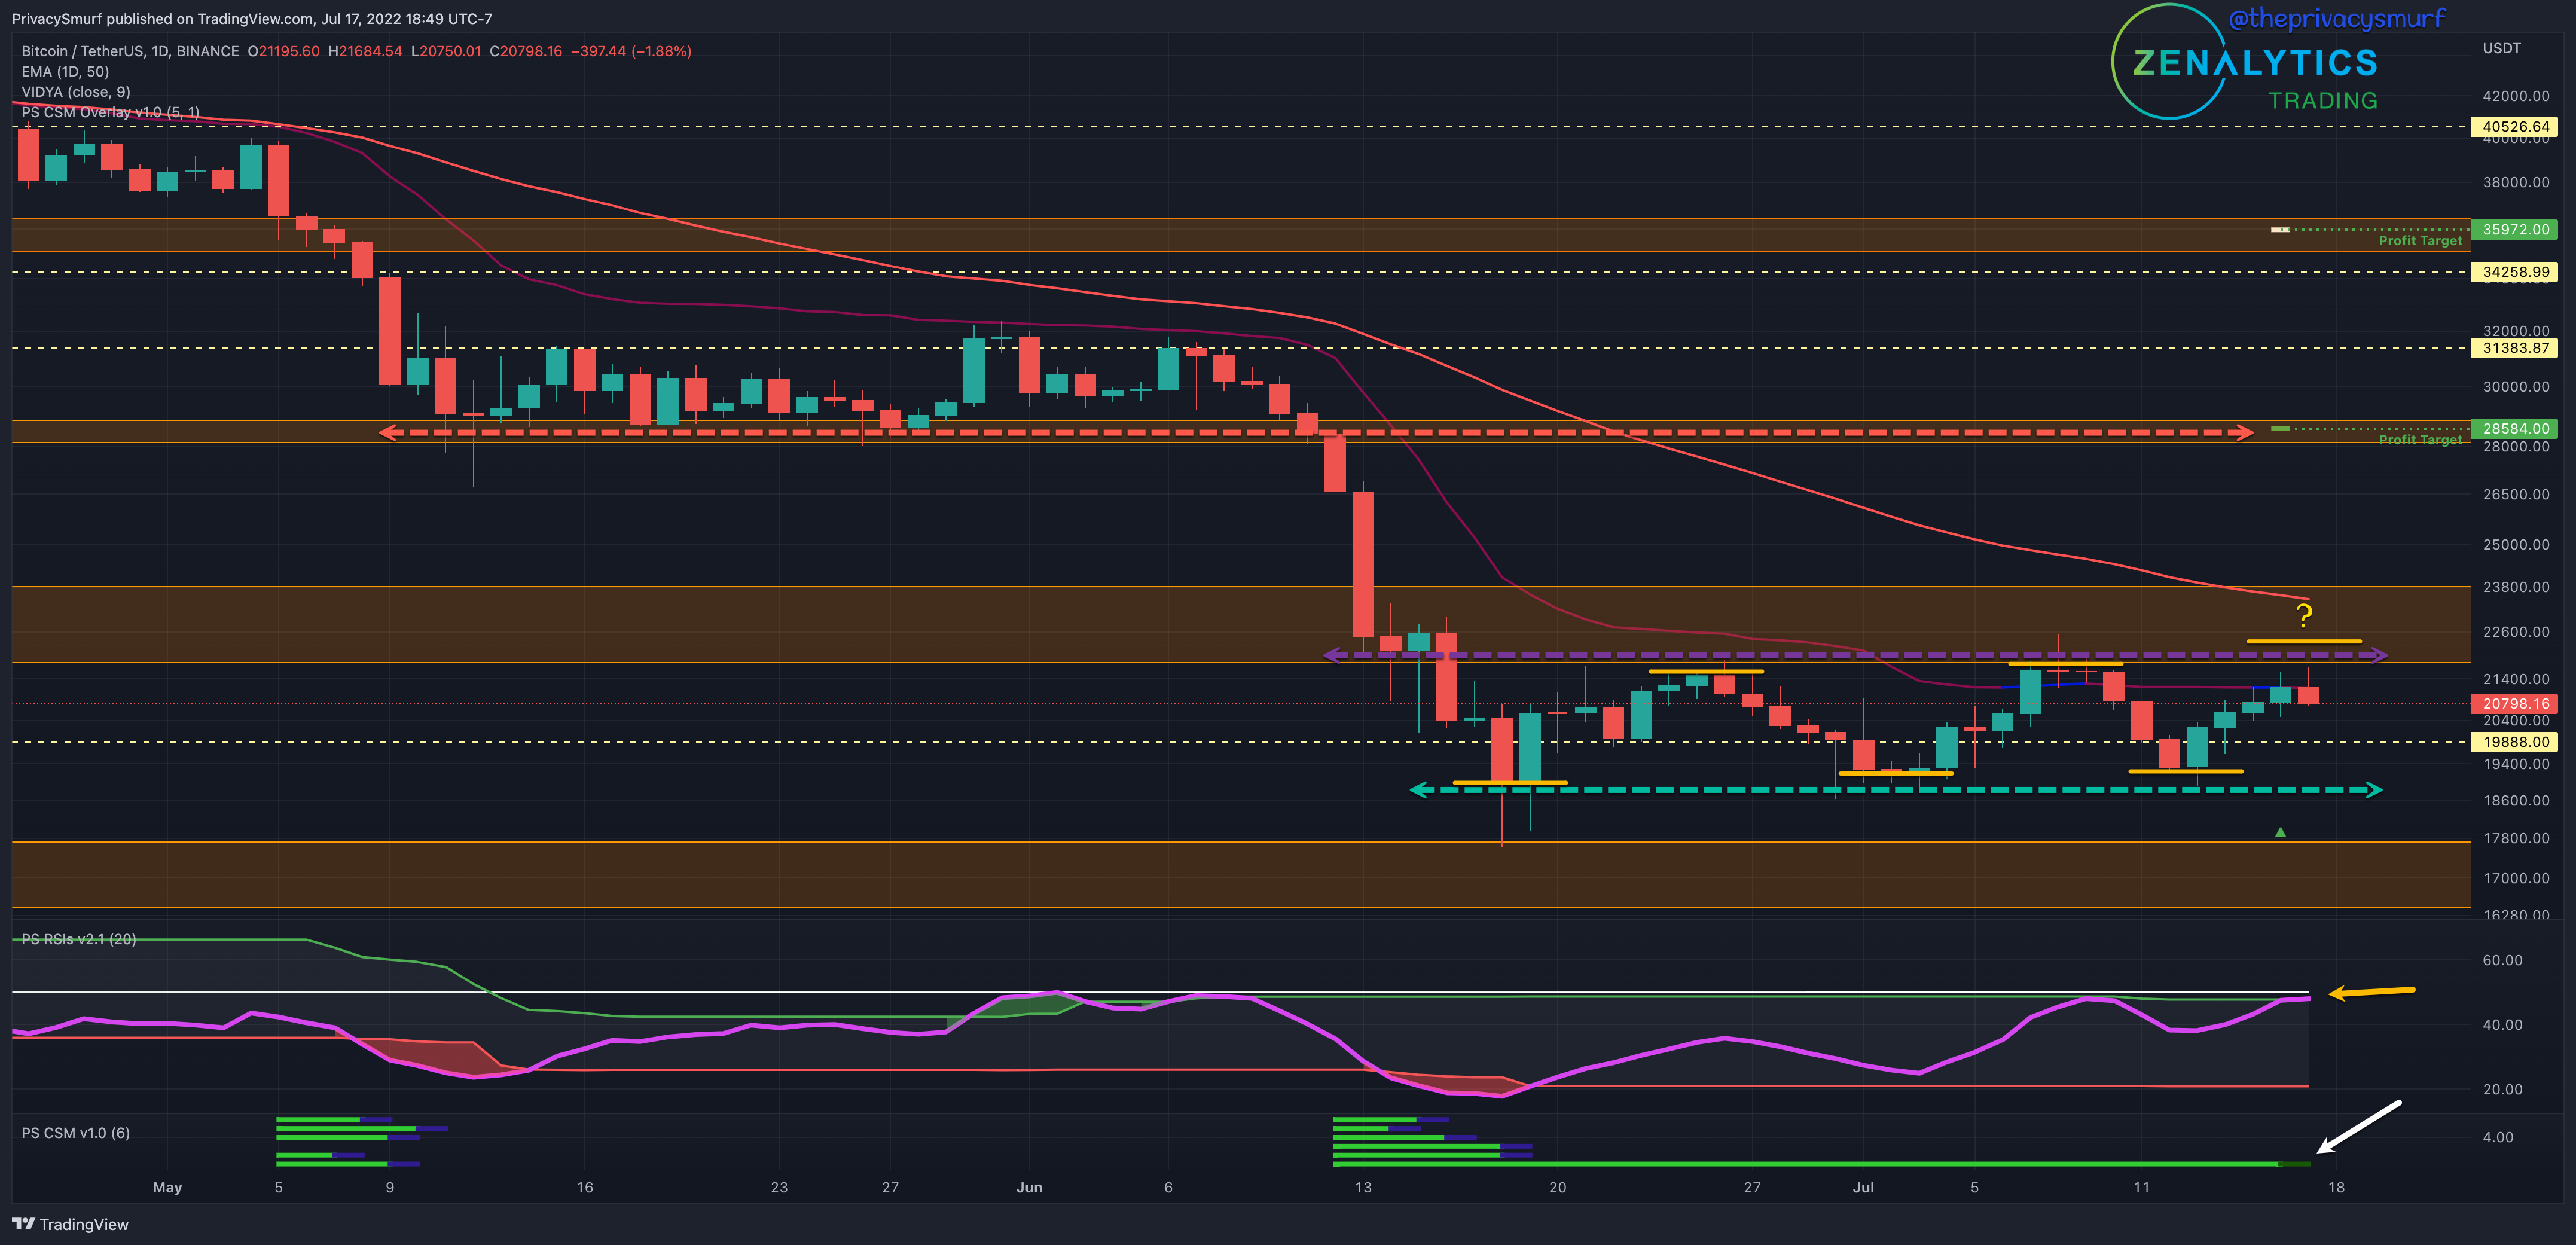
Many of the same conditions from last week but we also have some new things. The CSM at the bottom (white arrow) has FINALLY signaled a bullish trade condition. The first profit target is plotted up at $28584. The is confluent with the floor that was broken back in June. It seems only natural that prices would rally there for a retest. The resistances suggested in the last Sunday Synopsis still exist and held up when touched again (purple arrow line segment). The RSI is trending in the right direction but is still below the midline but is now starting to break above the top band (yellow arrow). If the midline can be breached, this would likely coincide with breaking the top of the range. I’ve added in some yellow line segments. These showcase the subtle but visible and consistent increase in higher low and higher high pivots as we move forward in time. These are the right things to see in the market, which still suggest a bullish continuation. I’m still expecting bullishness for the eventual break from the range, but that likely won’t happen until the midline can be broken. Like the last post, we may continue to range between the lower closes and the resistance accumulating until there is enough strength to move up.
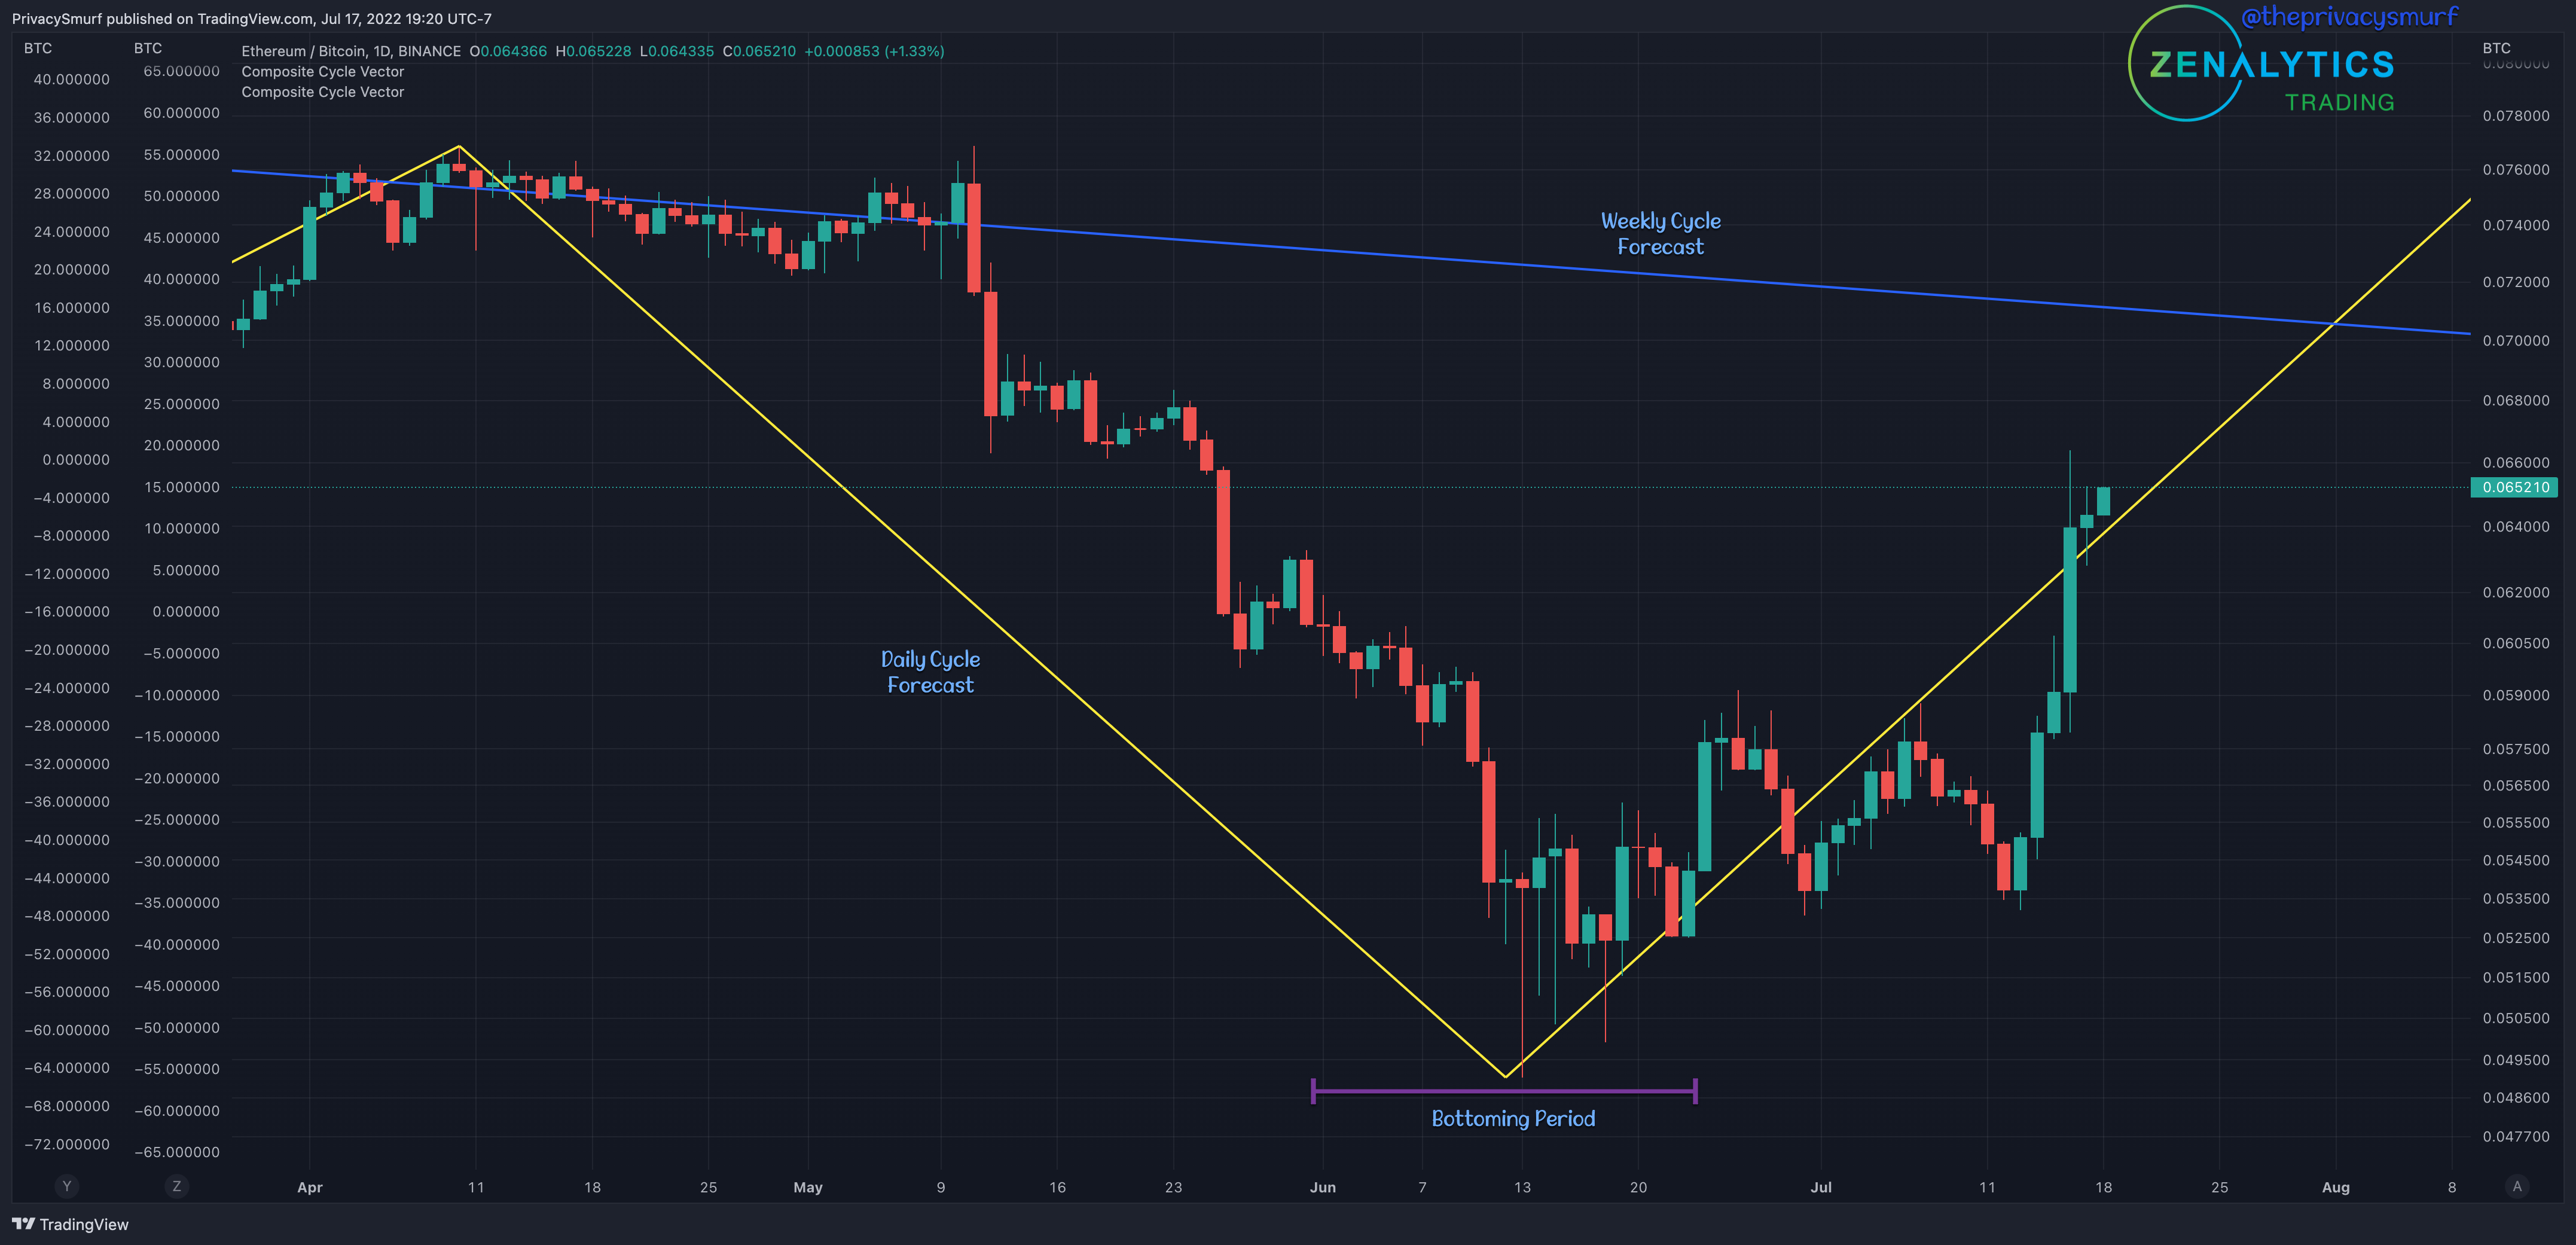
Q3 Forecast Update
In the Q3 Forecast from earlier this month, I provided some projections, and the best response from them so far has been ETH/BTC. We still have room to go in this upwards leg of the daily cycle. It brings up an interesting thought train with it. With BTC holding at resistance and ETH running, are we experiencing the rotation of profits from folks who bought BTC at the bottom of the range and are moving it to other assets? When we get to the 0.072 level with was a floor that broke, will the nice run end and ETH and altcoins fall back hard, or will those profits rotate back into BTC hodl bags, and we keep this bull train going?
Here’s that forecast in case you missed it.

ETH/BTC Weekly Structure
https://www.tradingview.com/chart/sacHlXOv/
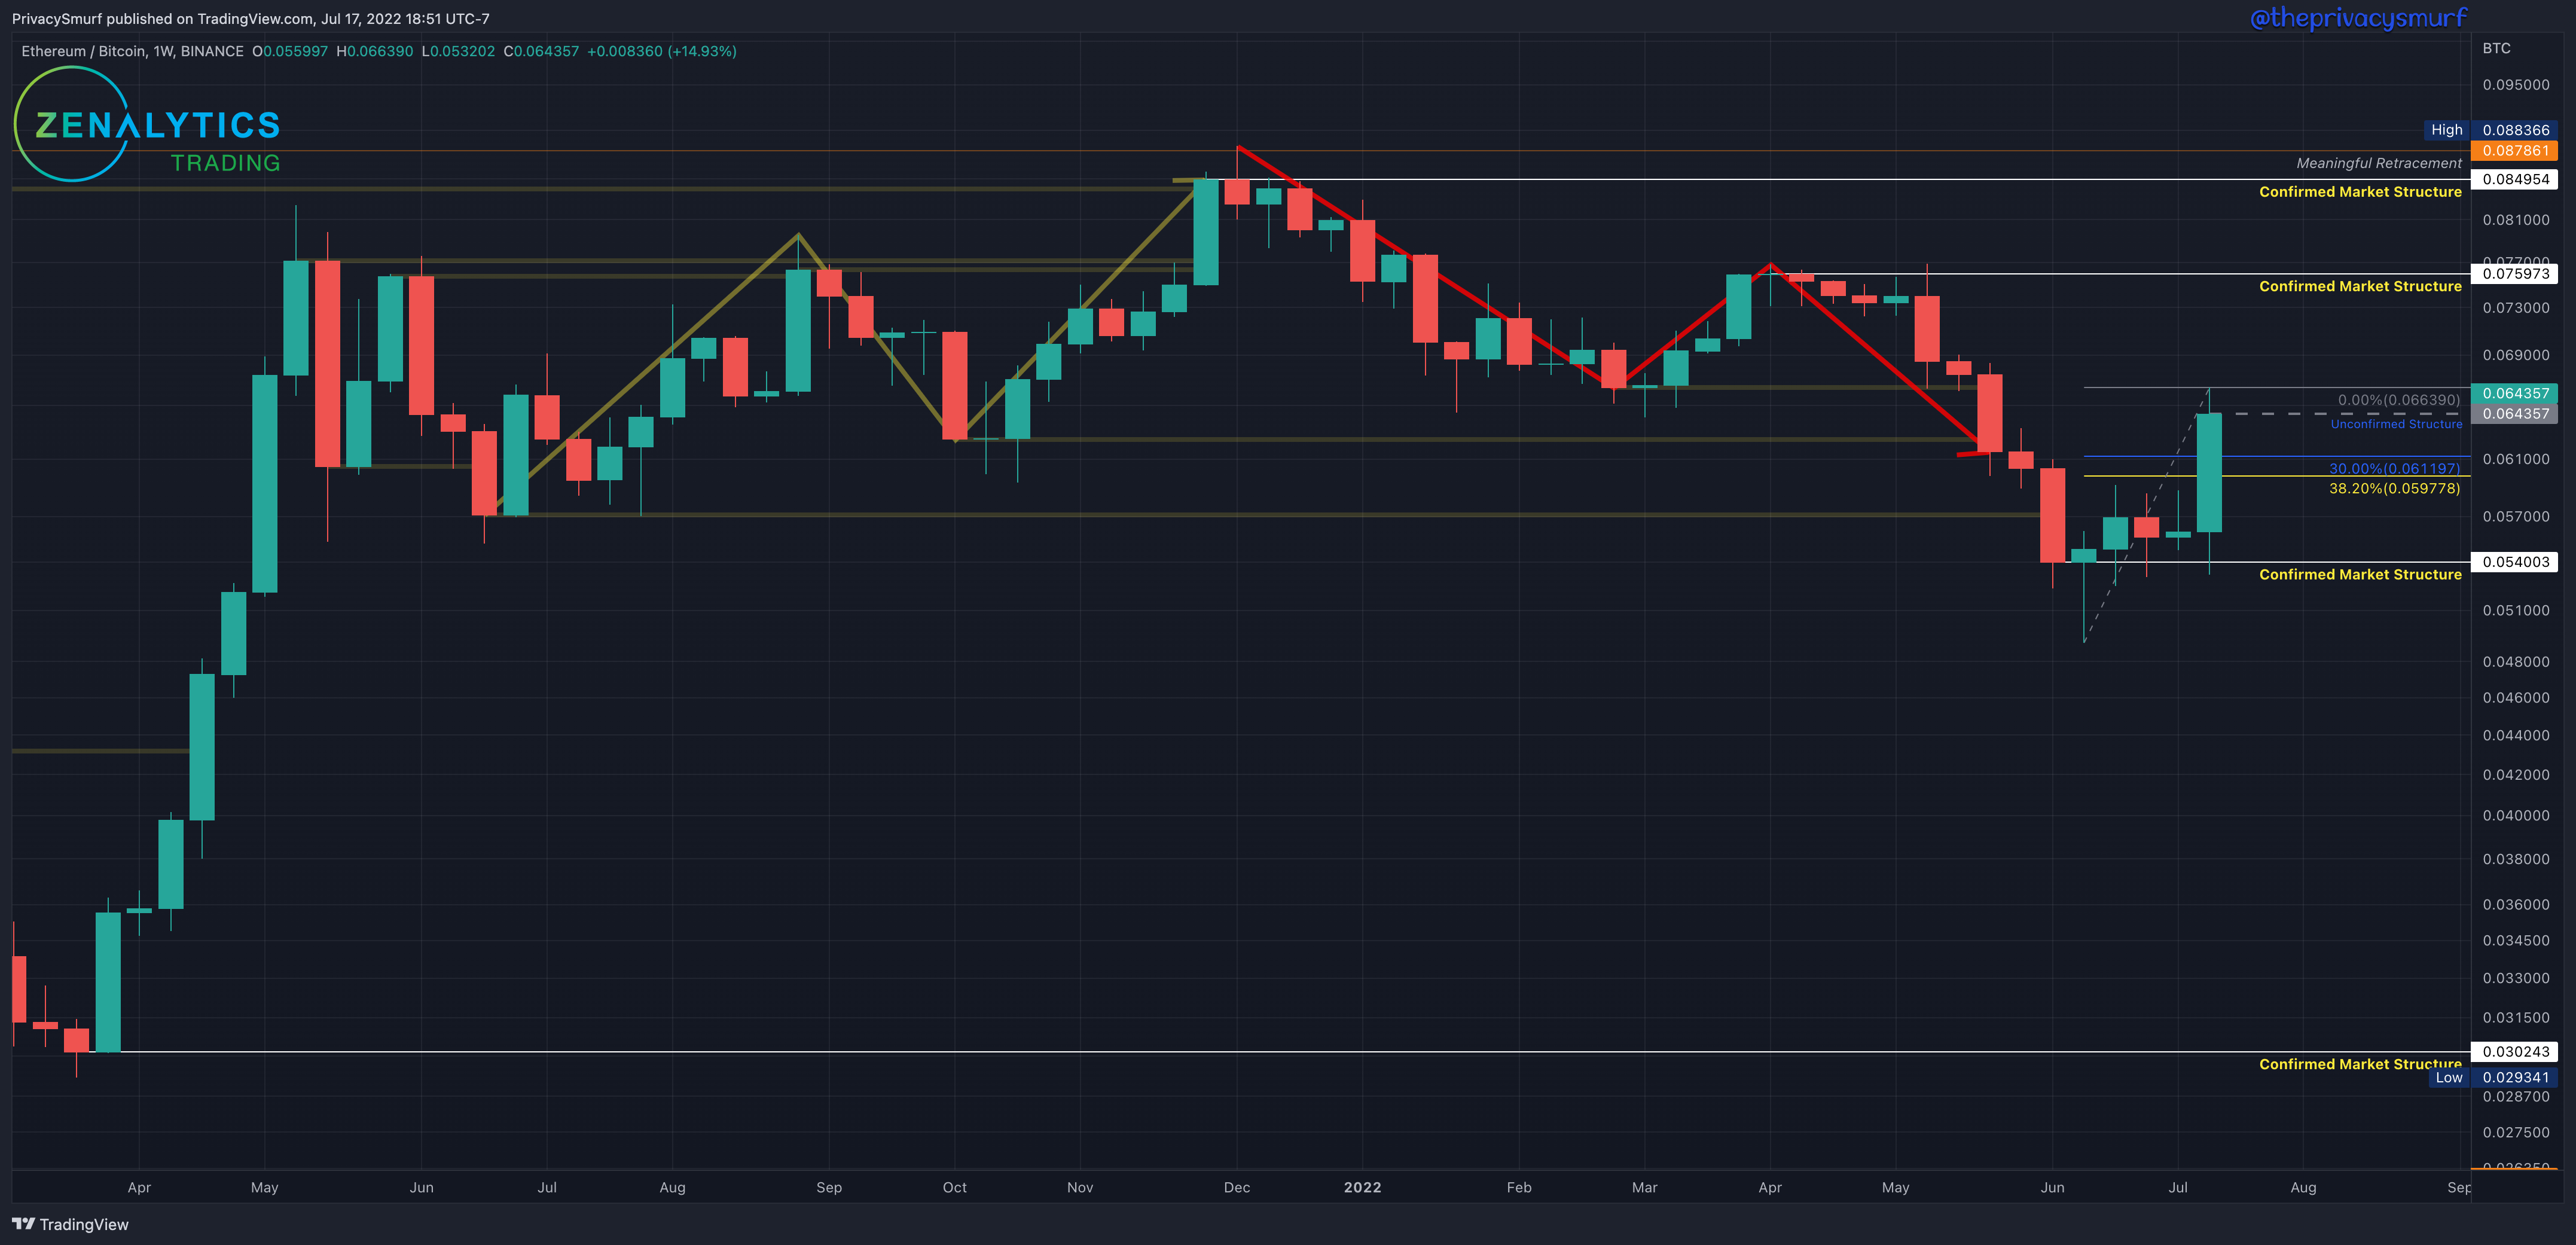
This past week closed bullish with ETH gaining heavily on BTC. I’ll include a small version of last week's chart below. This week the candle closed above 0.059698 (the 38.2% level in last week’s photo). This act makes the 0.054003 mark “Confirmed Market Structure” and potential support. We now shift the anchor of the fib retracement tool to the most recent low at 0.049081 and follow prices up to the most recent highest high. The highest close (0.64357) is now “Unconfirmed Structure” until a new higher close prints. Prices much decrease from here for two red weeks with a close below 0.059778 (the 38.2% retracement) to confirm the higher structure as potential resistance. The weekly market structure trend is still bearish despite this price action.
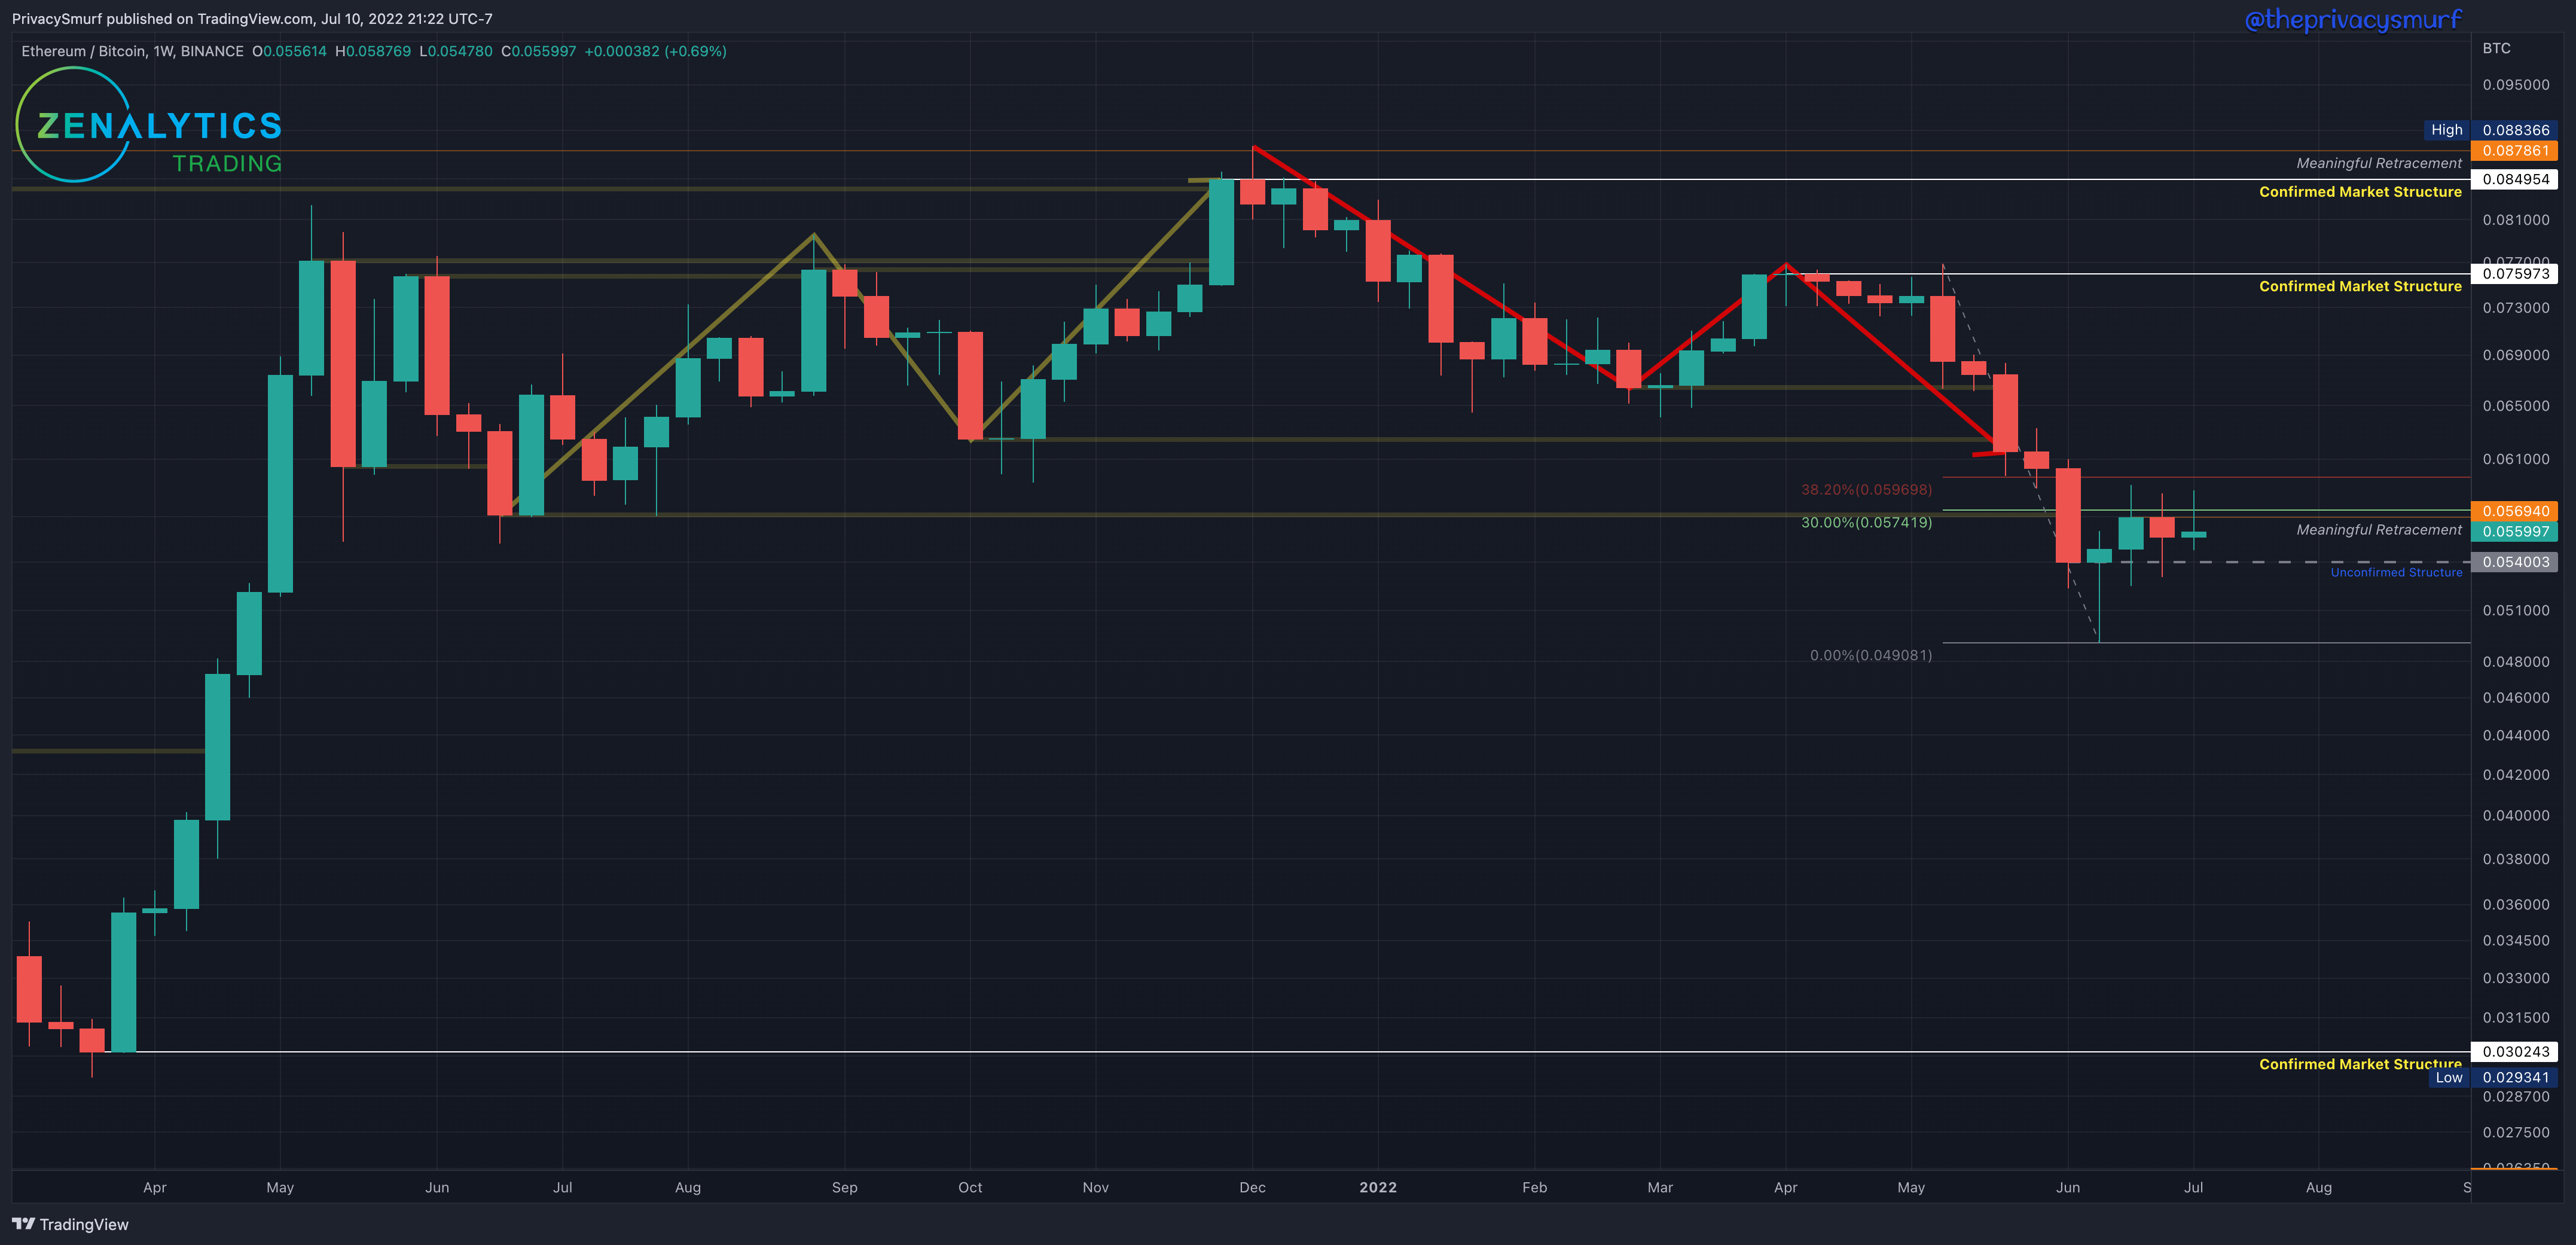
From a long-term investing perspective, I expect that if we fall here and lose value in the ETH/BTC relationship, the new structure at just under 0.054 may act as support. I don't have a long-term DCA buy order there. Still, it may provide an opportunity to buy for long-term hodl positions if that price level was missed prior (and it should in no way be an attempt to time the market or call a bottom, it is a location of value as shown by the amount buying activity there). Given current technicals, **I don’t expect that to be hit in the near term. From a long-term trading perspective, a buy order (for selling at the next cycle peak) won’t be taken by me for this timeframe until the market shifts back to bullishness. This would come with either a breakout of structure at 0.0759 (which is less than ideal as I’d miss the beginning of the trend shift) OR in a few weeks after a retracement where I can buy a bounce/support test (which is a more conservative and ideal move, for me). On a side note, the prior structure support that broke back in mid-May at around the 0.0645 level may act as a resistance in the near term.
ETH/BTC Daily Chart
https://www.tradingview.com/chart/gTkSjkj6/
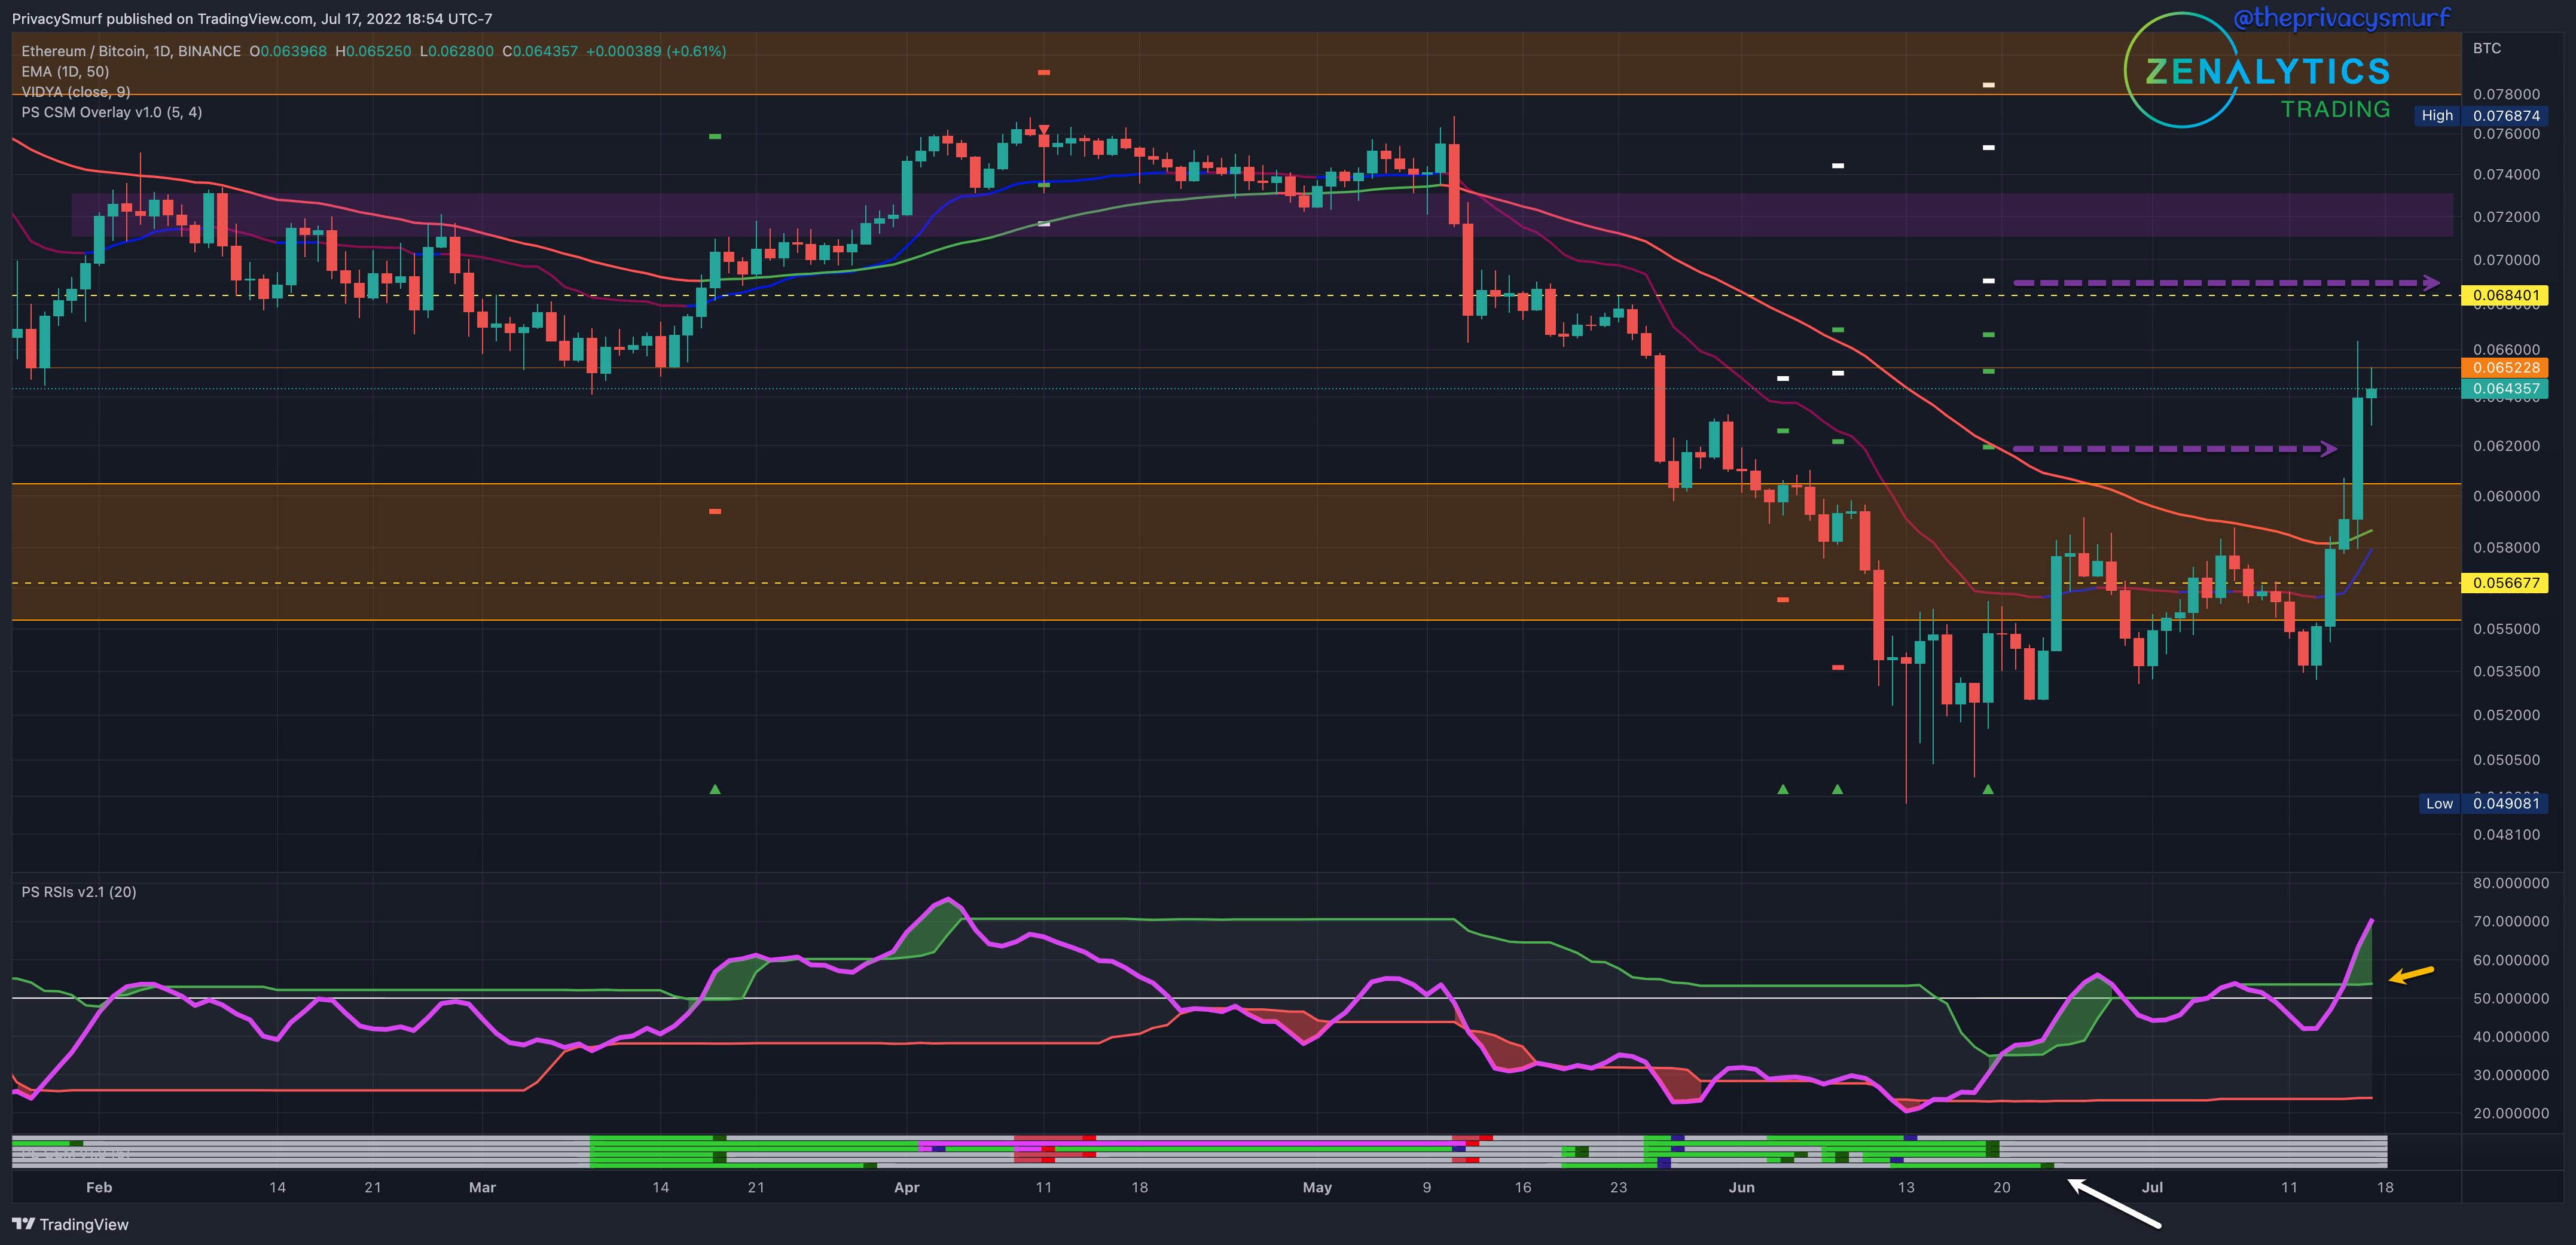
From last week:
The daily picture shows the same ranging activity… RSI… falling back below the top band and midline suggesting bearish influence… expect a support test. Resistances still exist at around 0.060 and the 50-Day EMA has crept lower to around 0.058. If candles can break above that level ETH has the possibility of gaining in value much greater than BTC. At that point, short-term positions in ETH and likely altcoins would be viable and I’d be looking for stronger performing coins across the market for short-term long trades. The top side resistance I’d put up at around 0.066.
This week ETH/BTC hit the bottom of the range early in the week and took a ride shooting up past the 50-Day EMA and was stifled at the resistance at 0.066 at the end of the week. The trade signaled earlier (June 19 Sunday Synopsis) on the CSM (white arrow) hit the first target. The next resides above resistance at 0.0684. Upon reaching the first targets, I typically take some profits to reduce my risk in the position and lock in gains. The RSI (yellow arrow) is well above the midline but not into extreme overbought regions (above 80), but monitoring it for curling back down may suggest some dying off of the rally. If the top band moves up and the RSI falls back inside the bands, that will likely be a return to normal price fluctuations and the establishment of a new trading range. There are no expectations of a substantial decline in the technicals. Still, resistance at 0.066 may slow things down and force some more accumulation to gather the bullish energy to resume the rally.
ETH/USDT Weekly Structure
https://www.tradingview.com/chart/JPTp0aXw/
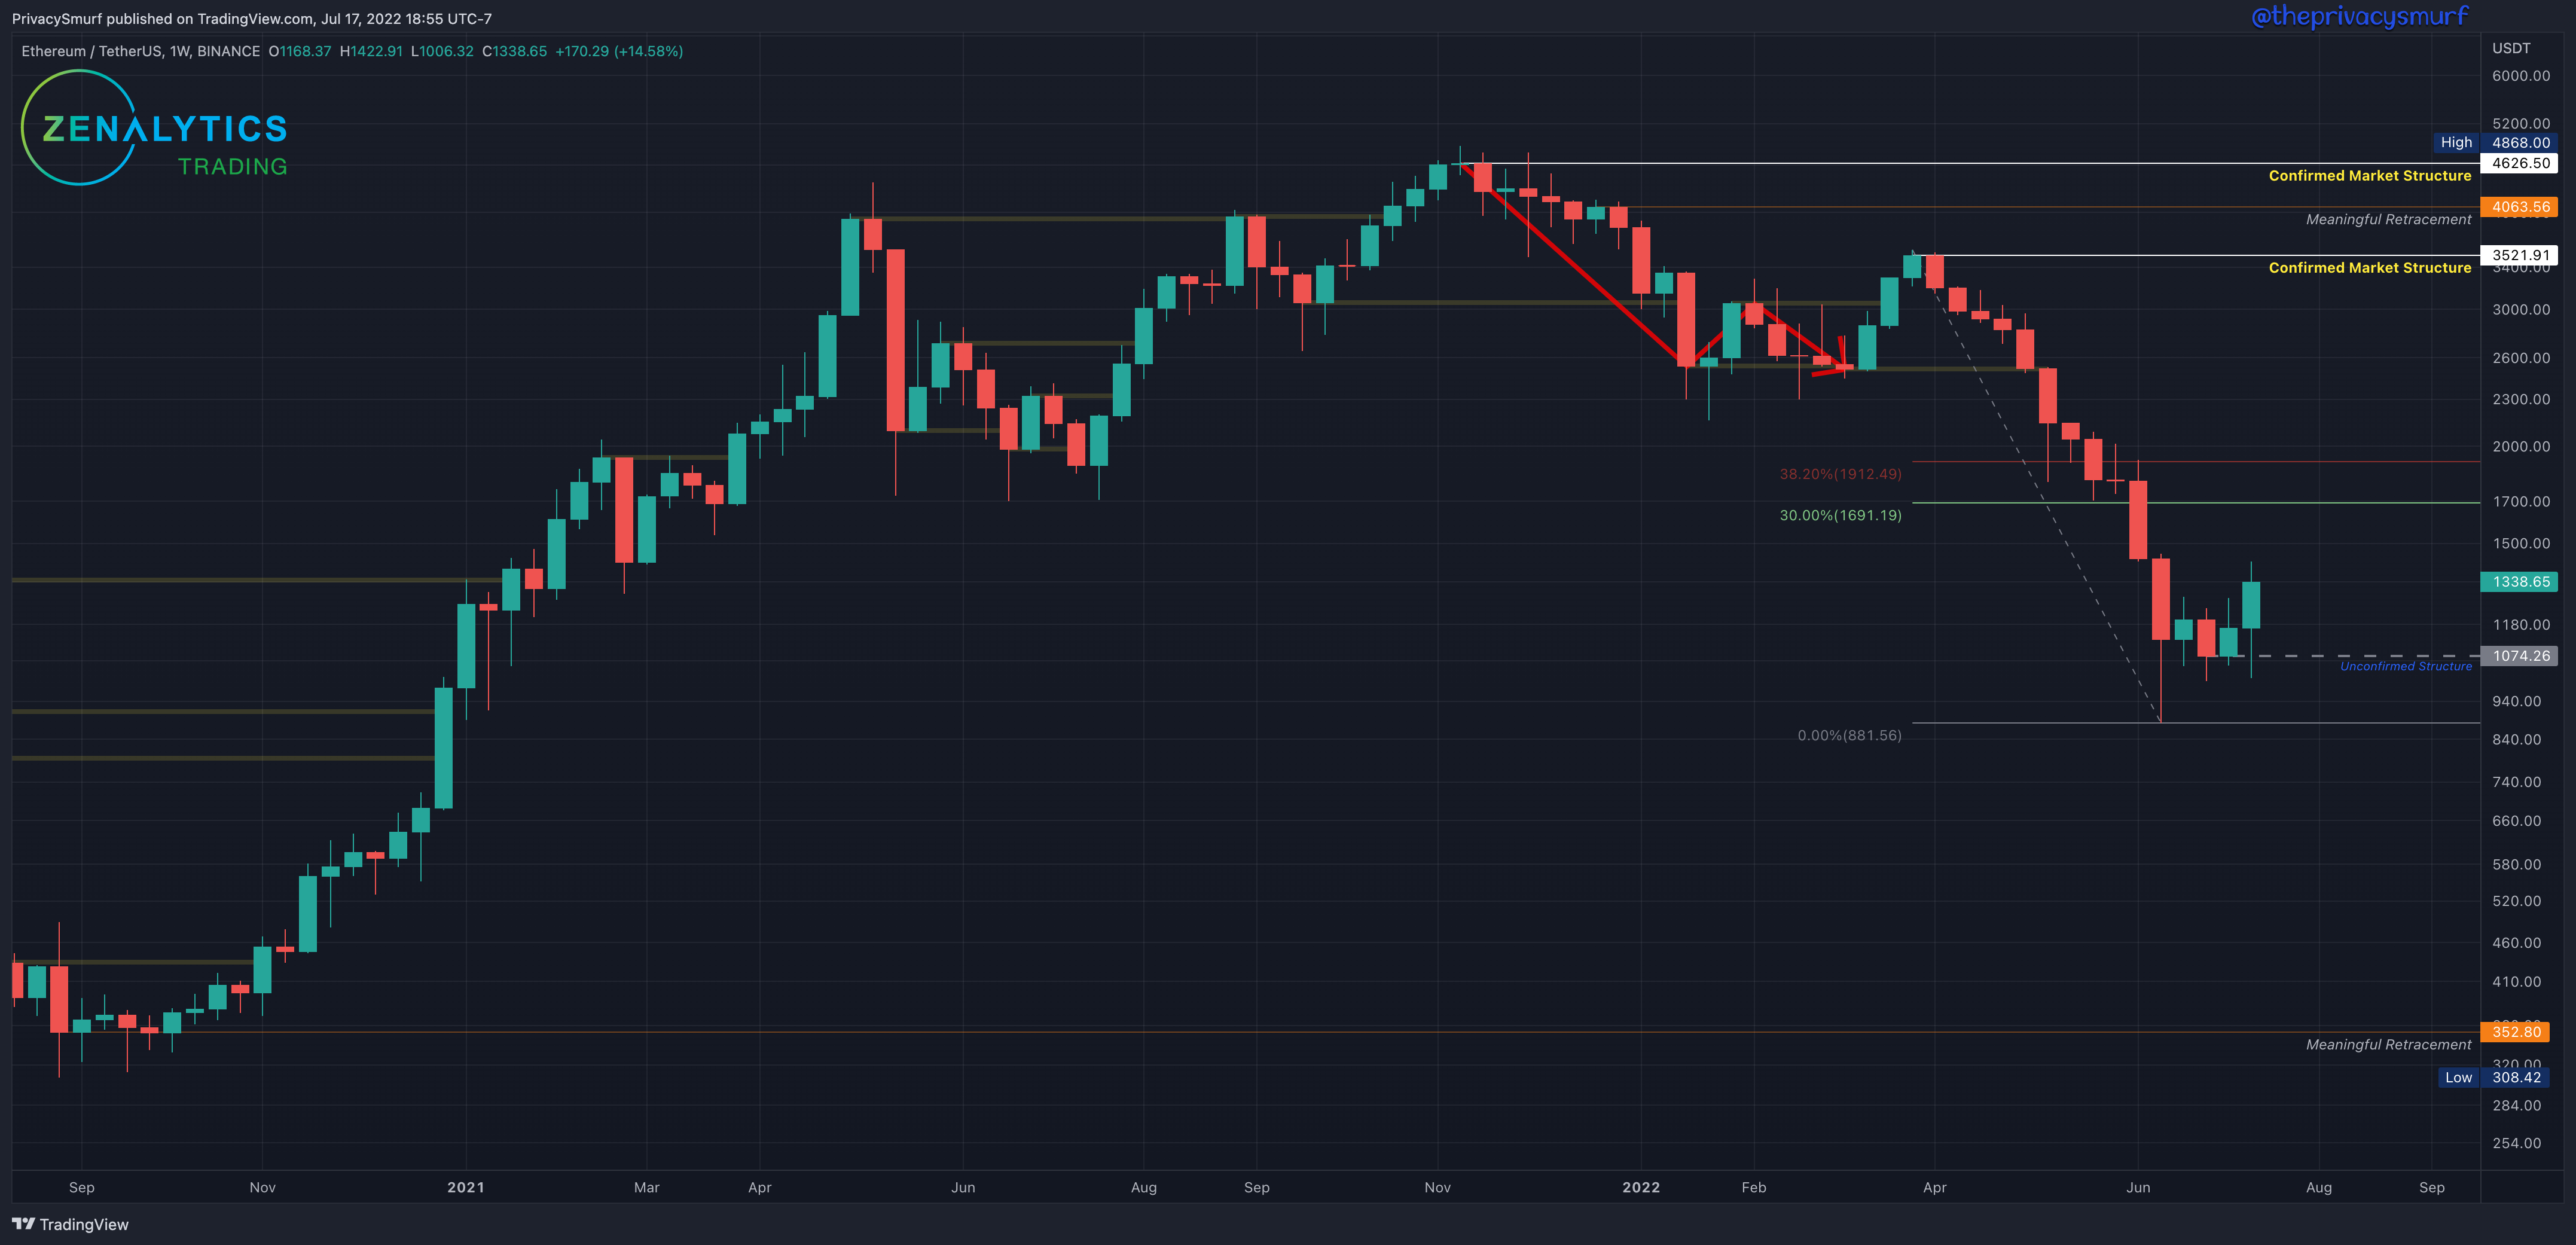
Unlike BTC, this past week, ETH closed bullish. With no new lower low, the fib retracement from the highest high of the last ‘Confirmed Market Structure’ resistance remains at the last lowest low at $881. Since there has been no new lower low close than $1074, it remains the ‘Unconfirmed Structure’. If prices increase with a close above $1912, this will confirm the structure as support. The weekly market structure trend is still bearish despite price action.
From a long-term investing perspective, there are no moves to be made (for the HODL bags) since the ‘meaningful retracement’ at $1232 from Jan 2021 was hit, and the DCA order was filled. The next lower buy location for me is at the broken structure at $800 from 2021 (it is in no way an attempt to time the market or call a bottom but is a location of value) and $352. Given current technicals, I don’t expect that to hit soon, but I have DCA orders there. From a long-term trading perspective, a buy order (for selling at the next cycle peak) won’t be taken by me for this timeframe until the market shifts back to bullishness. This is a tough call to make as that will require many weeks of waiting while potentially missing much of a move. An earlier cue that I would explore if the chart lacked the technicals could alternatively be taken from the ETH/BTC chart if it changes structure before the ETH/USDT chart.
ETH/USDT Daily Chart
https://www.tradingview.com/chart/xbB6lkZu/
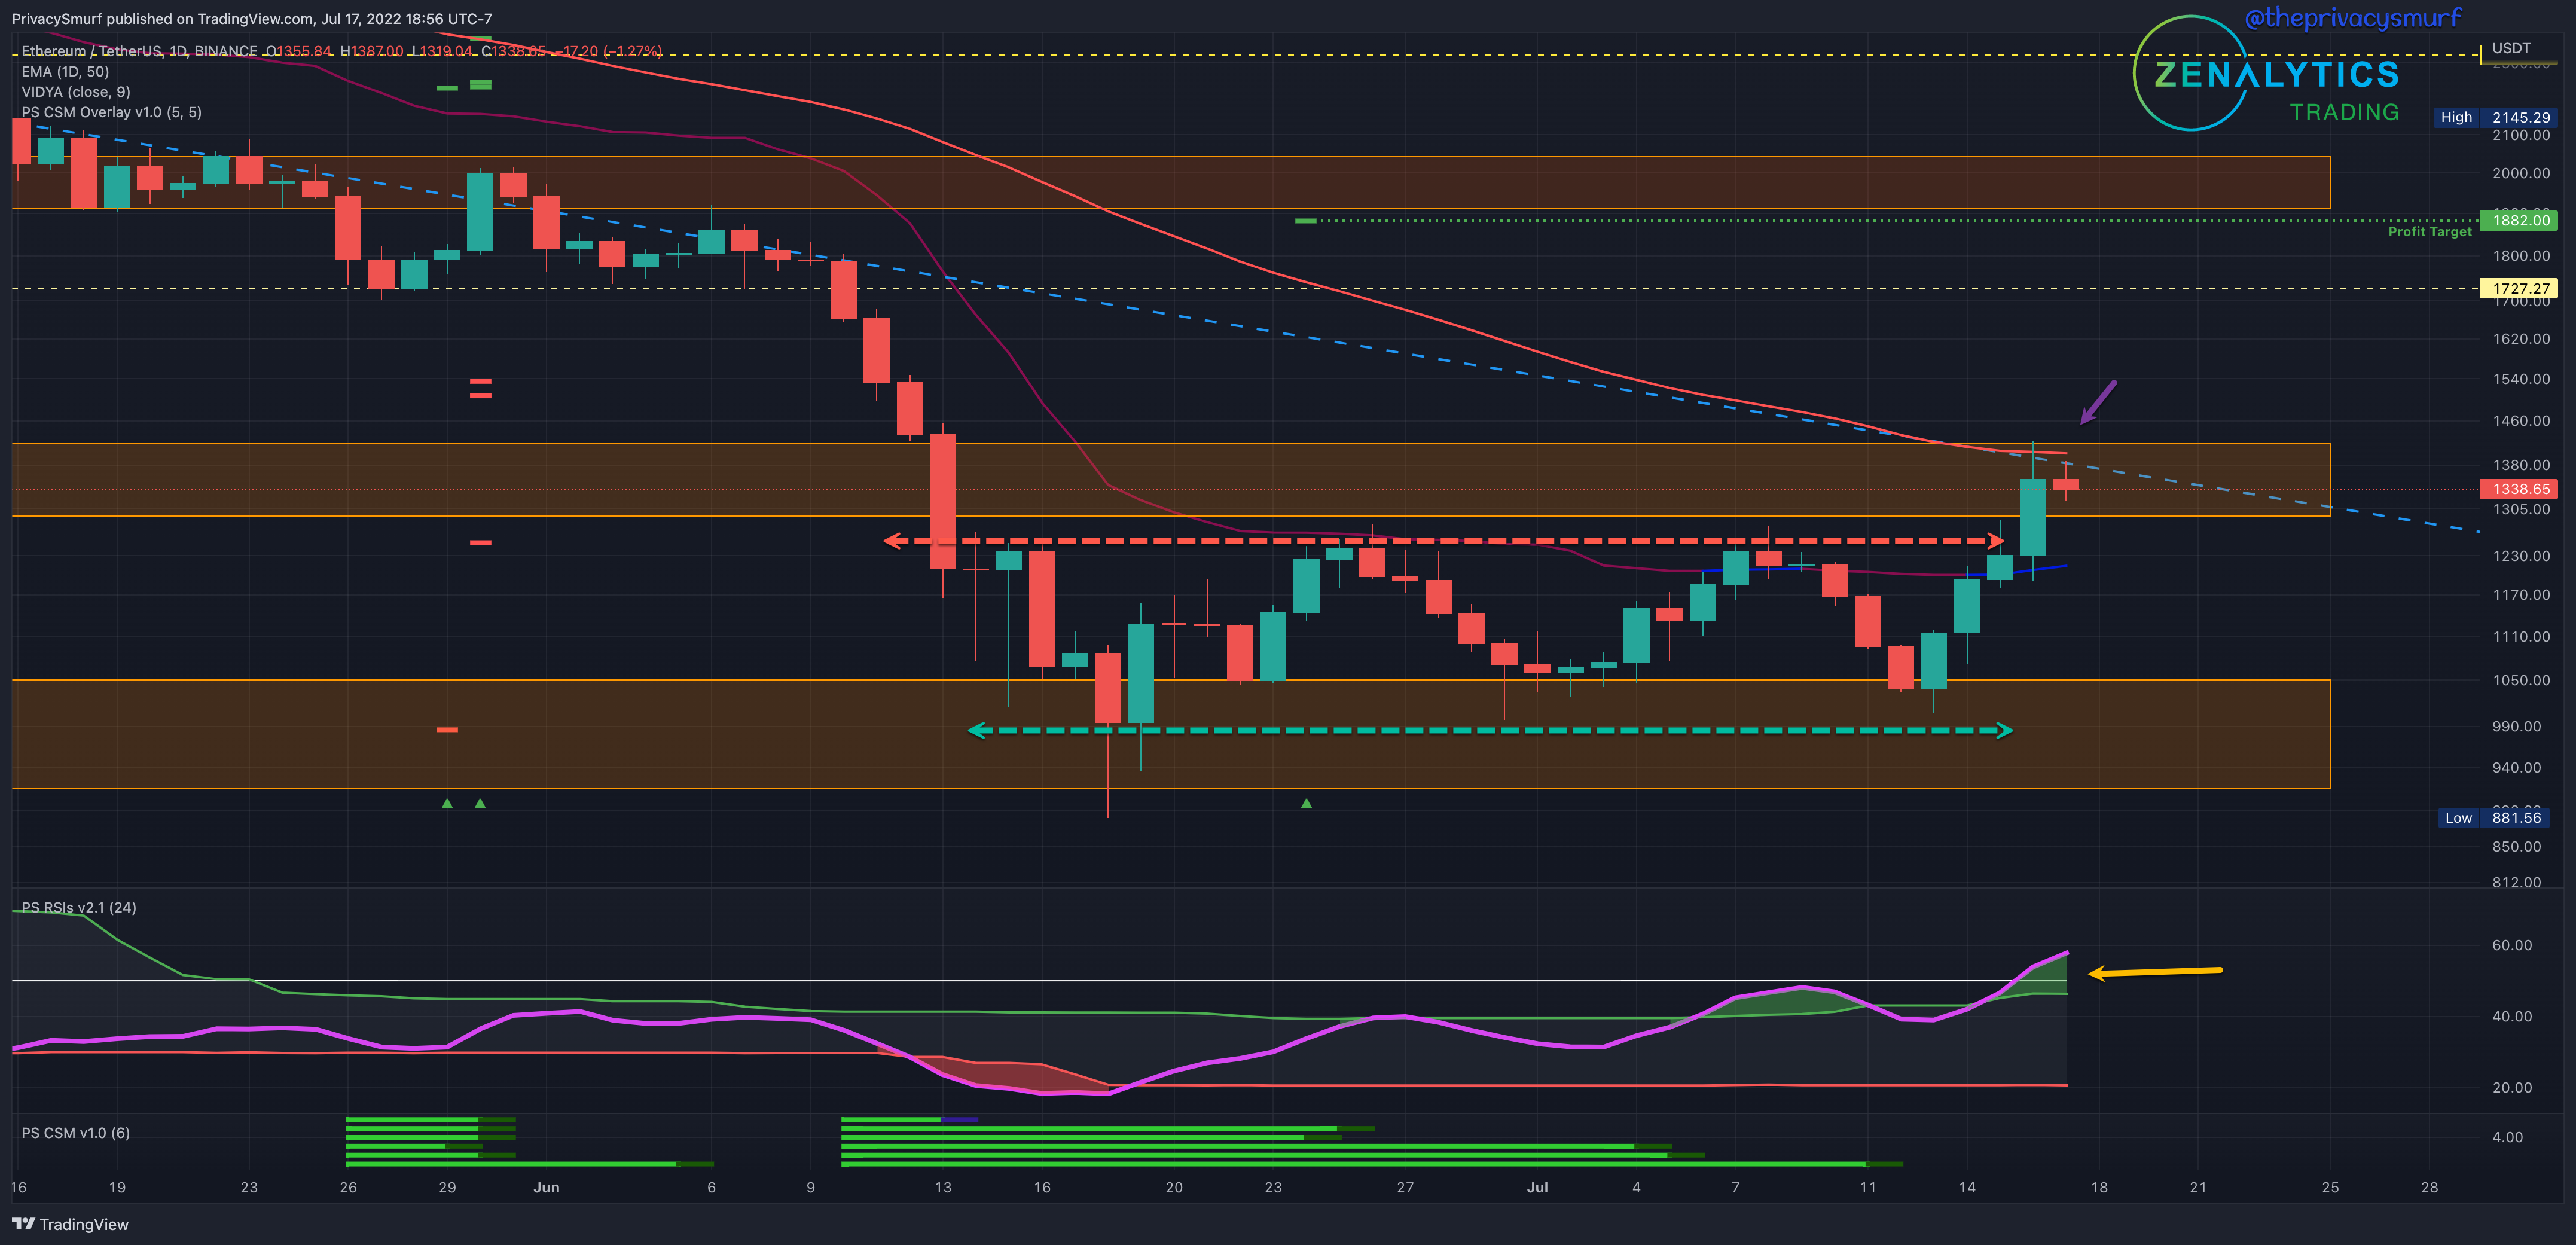
From last week:
The CSM at the bottom (white arrow) has signaled a bullish trade condition… So far it’s been correct in thinking the profit target is a bit optimistic… I’m still expecting bullishness for the eventual break from the range but that likely won’t happen until the midline can be broken.
As with BTC and ETH/BTC we saw a retracement early in the week and a bullish finish with the breaking out of the range coinciding with the RSI breaching above the top band and midline (yellow arrow). A long-standing descending trend line I’ve had on the chart acted as a backup resistance along with the 50-Day EMA and the resistance zone from months ago (purple arrow). The RSI is nowhere near extreme overbought regions (above 80), but if it returns between the bands early in the week, this resistance will likely hold, and we will establish a new higher trading range. The retracement down towards the $1230 level offers an interesting spot to potentially look for a bounce to take a long position. It’s something I’d be watching on intraday timeframes for a bullish trade signal. The bullish technicals on this timeframe still exist, but we aren’t past historical resistances, just recent ones. Closing above the recent highs at $1450 projects a lot of strength and will probably bring further bullish continuation.
From the top:
‘Everything that shine ain't always gonna be gold.’
Be careful not the jump in too heavy where we are right now without looking at all the potential risks. We are not confirmed bullish just yet. Consider the repercussions of buying into long positions at the top of the ranges. Daily and weekly trends are still down.
@theprivacysmurf