

Sunday Synopsis #48: The Boat I Row
Sunday Synopsis #48: The Boat I Row
Many ways to go. It's hard to self-assure when everyone's a pro sayin', "It's so obvious."

An interesting place to be in the market right now. Maybe a pullback to gather liquidity for the rest of the dead cat or failure far down if people get too overzealous and liquidated on the way down. I finally got my rowing machine delivered this week. I’d been sooooooo nice. It’s one of the few kinds of exercise that I actually enjoy doing.
BTC/USDT Weekly Structure
https://www.tradingview.com/chart/4v8qizyI/
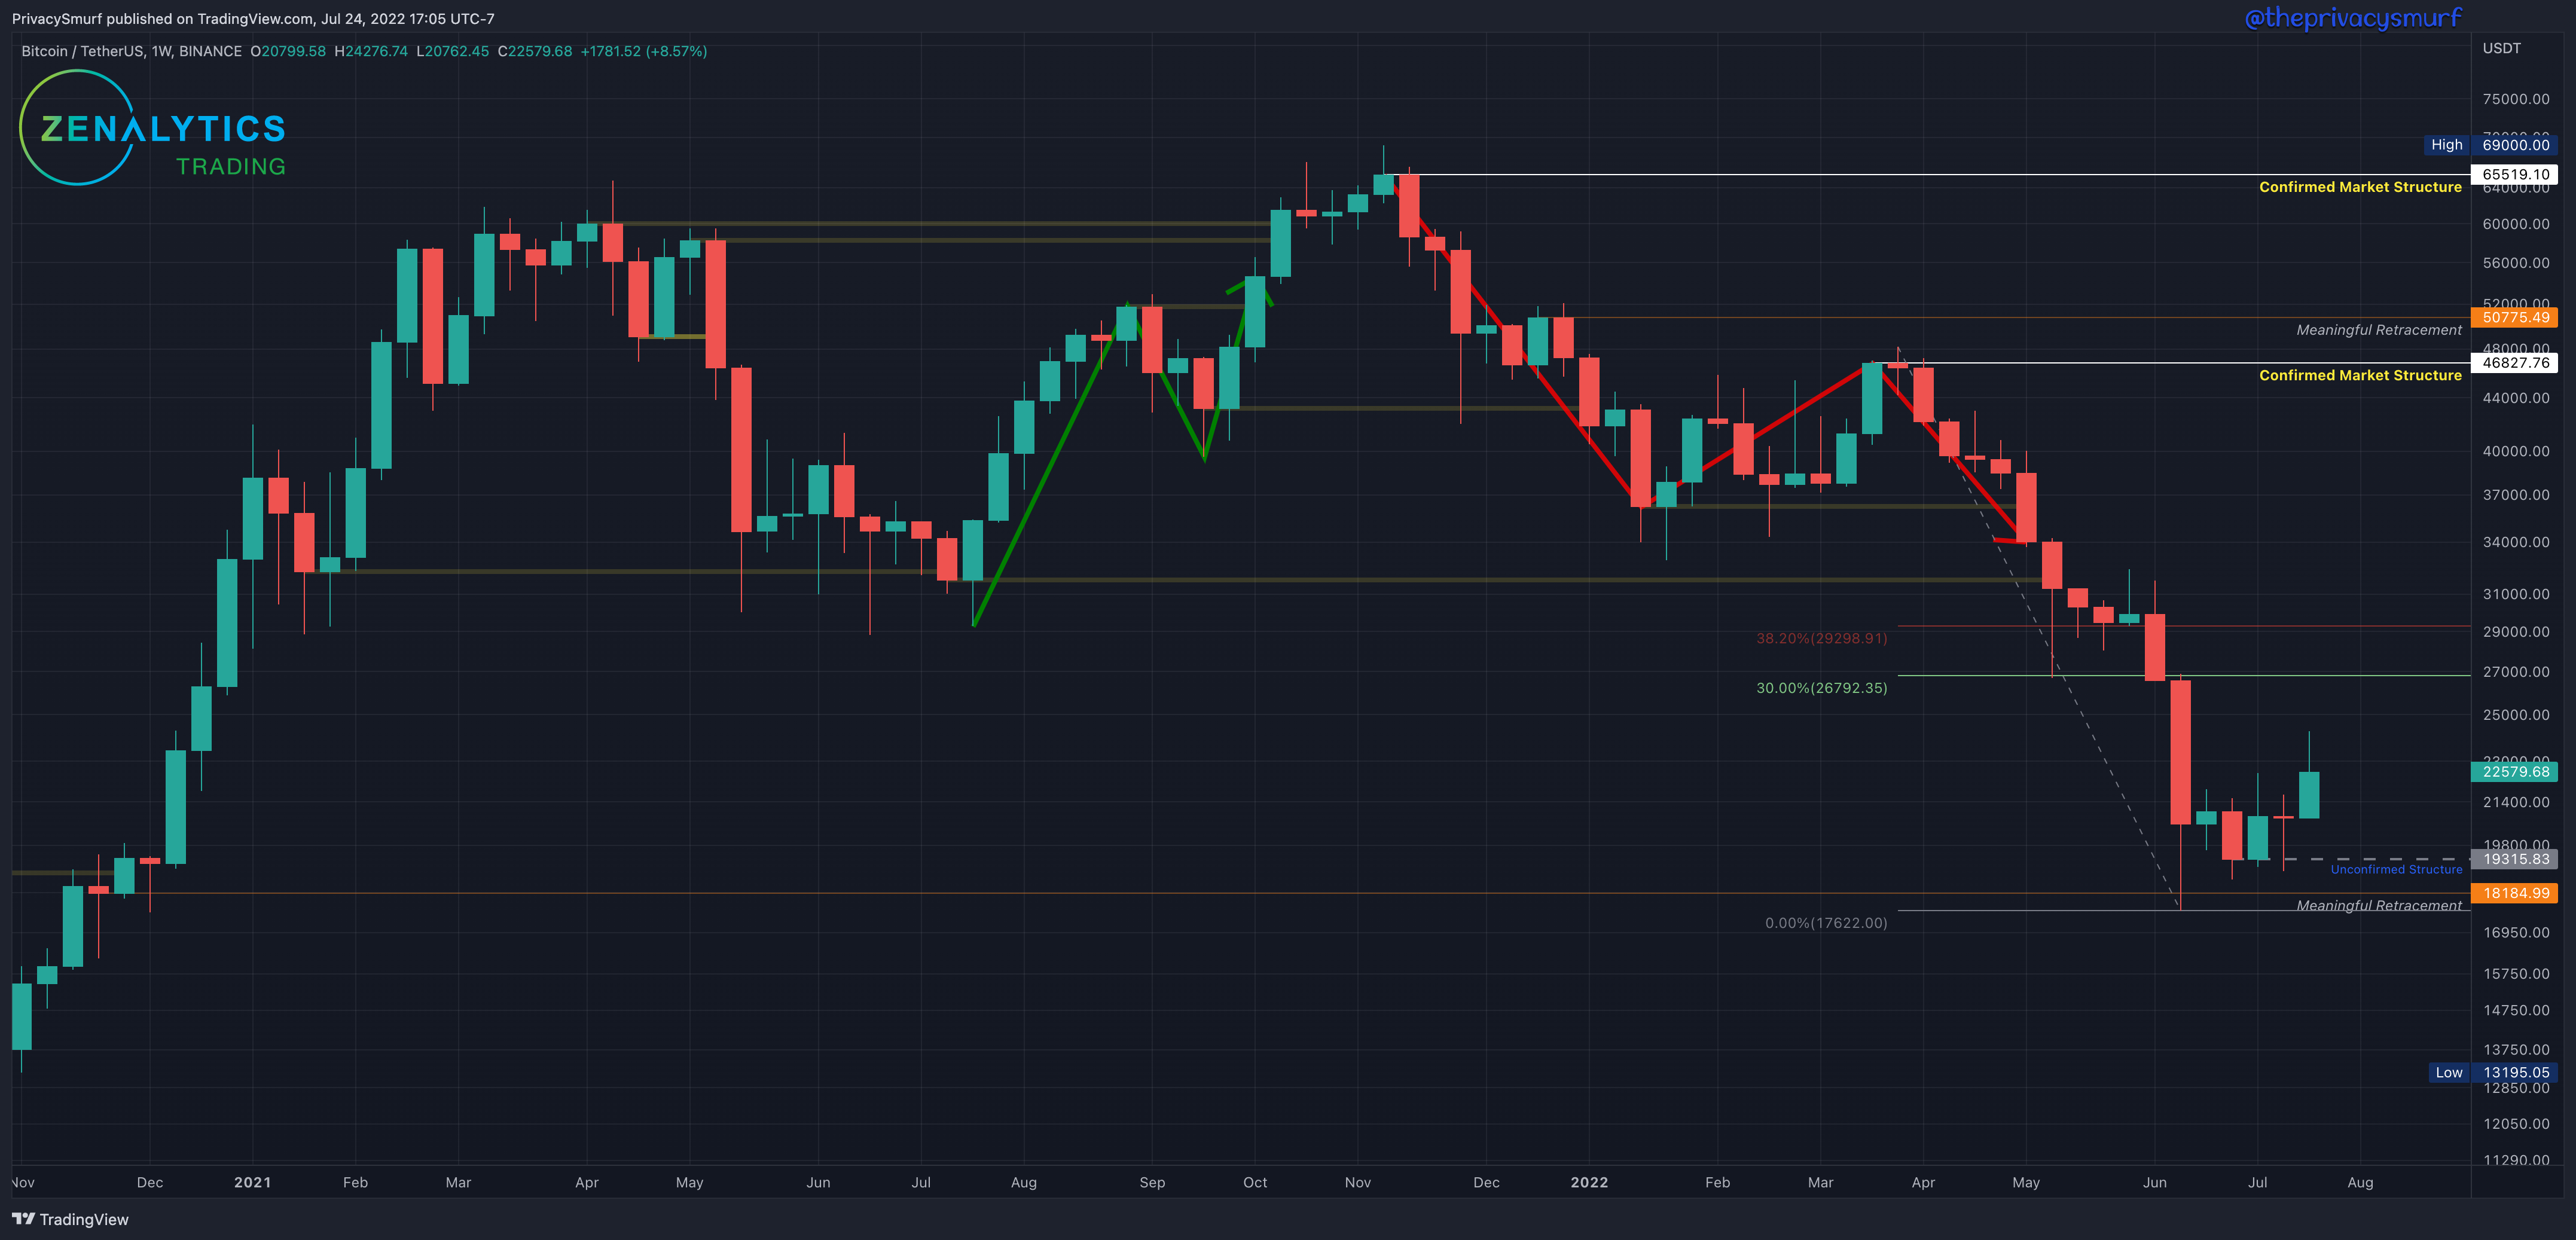
This past week BTC closed bullish otherwise no changes with the long-term picture. With no new lower low, the fib retracement from the highest high of the last ‘Confirmed Market Structure’ resistance remains at the last lowest low at $17622. Since the last posting, there has been no lower low close past $19315, so it remains the ‘Unconfirmed Structure.’ If prices increase from here with a close above $29298, this will confirm the structure as support. The weekly market structure trend is still bearish.
From a long-term investing perspective, there are no moves to be made (for the HODL bags) since the ‘meaningful retracement’ at $18185 from Dec 2021 was been hit and the DCA order was filled. The next lower buy location for me is at $10256 (it is in no way an attempt to time the market or call a bottom but is a location of value). Given current technicals, I don’t expect that to hit soon, but I have a DCA order. From a long-term trading perspective, a buy order (for selling at the next cycle peak) won’t be taken by me for this timeframe until the market shifts back to bullishness. I want to buy strength, not weakness.
BTC/USDT Daily Chart
https://www.tradingview.com/chart/jjSdFW4b/

From last week:
… If the midline can be breached, this would likely coincide with breaking the top of the range… subtle but visible and consistent increase in higher low and higher high pivots… suggest a bullish continuation… expecting bullishness… break from the range… won’t happen until the midline can be broken.
Early in the week, The RSI broke above the top band and the midline as prices made the venture up and out of the month-long trading range. The 50-Day EMA acted as resistance. A consolidation occurs between the 50-Day EMA and the range high that we just broke. This will eventually lead to a volatile exit. With the RSI falling back into the bands, this would suggest the potential for a bearish break first. Falling below the midline would also suggest returning inside the trading range. Ideally, this will establish a new higher low before we break the $23.8k ceiling. Ultimately I’m not concerned with potential bullish movement failure unless we start closing below $21k. That may drag out the amount of time required to be bullish again.
Q3 Forecast Update
In the Q3 Forecast from earlier this month, I provided some projections, and the end of this week brings in another accurate timing projection. The Total Crypto Market Cap has entered a phase of shorter-term bearishness. Ideally, things don’t get too low, and it’s just a pullback to springboard into the rest of the rally.
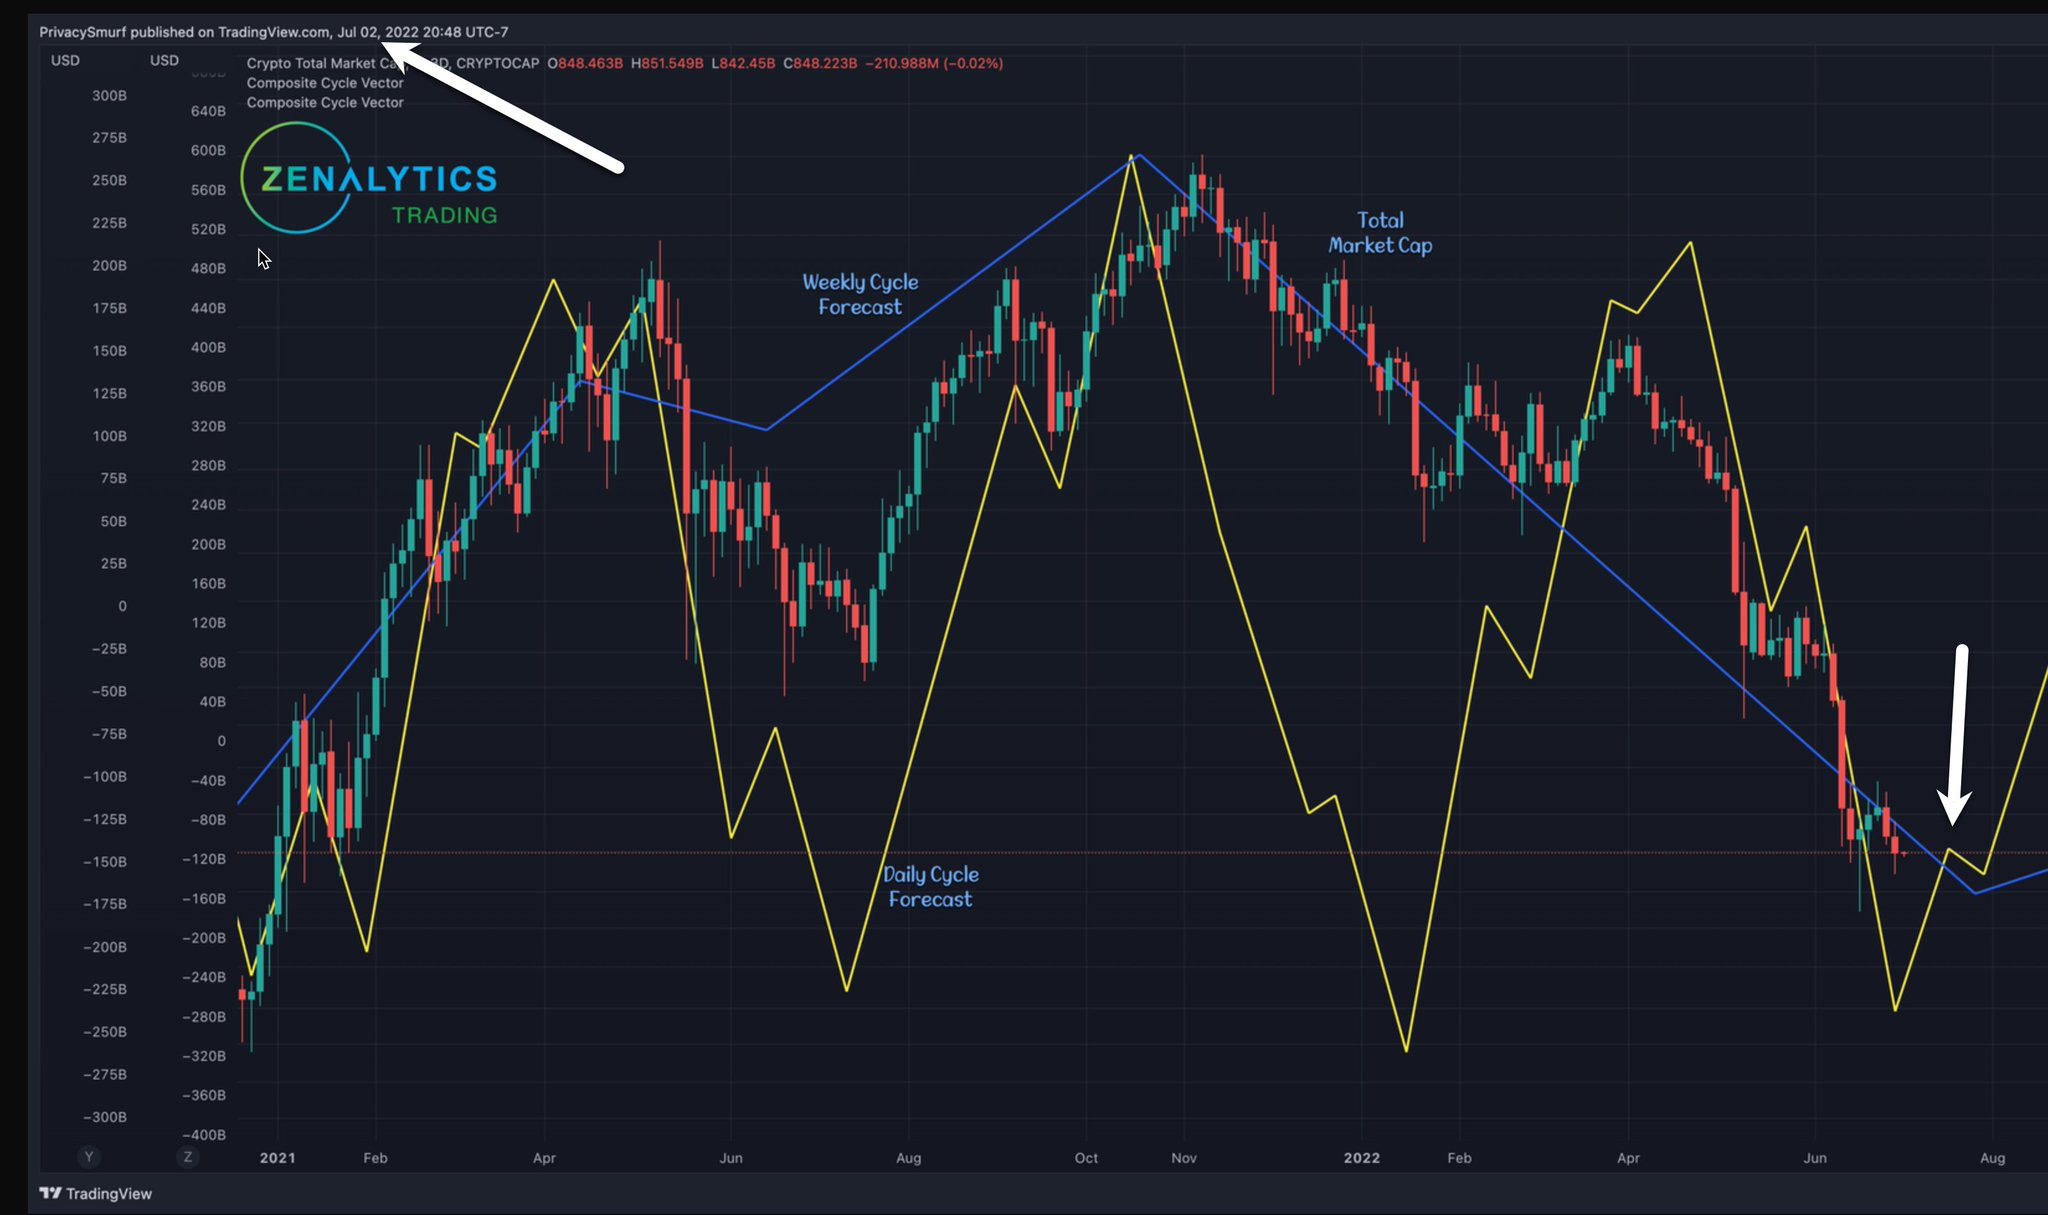
Here’s that forecast in case you missed it.

ETH/BTC Weekly Structure
https://www.tradingview.com/chart/sacHlXOv/

This past week closed bullish again, with ETH gaining heavily on BTC. Since the last posting, there has been a new higher high, so the high anchor of the fib tool extends to the new highest high at 0.07223. There is also a new higher high close at 0.070766, the new ‘Unconfirmed Structure.’ If prices decrease from here for two weeks with a close below 0.06345, this will confirm the above structure as resistance. The weekly market structure trend is still bearish despite this bullish price action.
From a long-term investing perspective, I expect that if we fall here and lose value in the ETH/BTC relationship, the new structure at just under 0.054 may act as support. I don't have a long-term DCA buy order there. Still, it may provide an opportunity to buy for long-term hodl positions if that price level was missed prior (and it should in no way be an attempt to time the market or call a bottom, it is a location of value as shown by the amount buying activity there). Given current technicals, **I don’t expect that to be hit in the near term. From a long-term trading perspective, a buy order (for selling at the next cycle peak) won’t be taken by me for this timeframe until the market shifts back to bullishness. This would come with either a breakout of structure at 0.0759 (which is less than ideal as I’d miss the beginning of the trend shift) OR in a few weeks after a retracement where I can buy a bounce/support test (which is a more conservative and ideal move, for me). On a side note, the prior structure support that broke back in mid-May at around the 0.0645 level may act as a resistance in the near term.
ETH/BTC Daily Chart
https://www.tradingview.com/chart/gTkSjkj6/
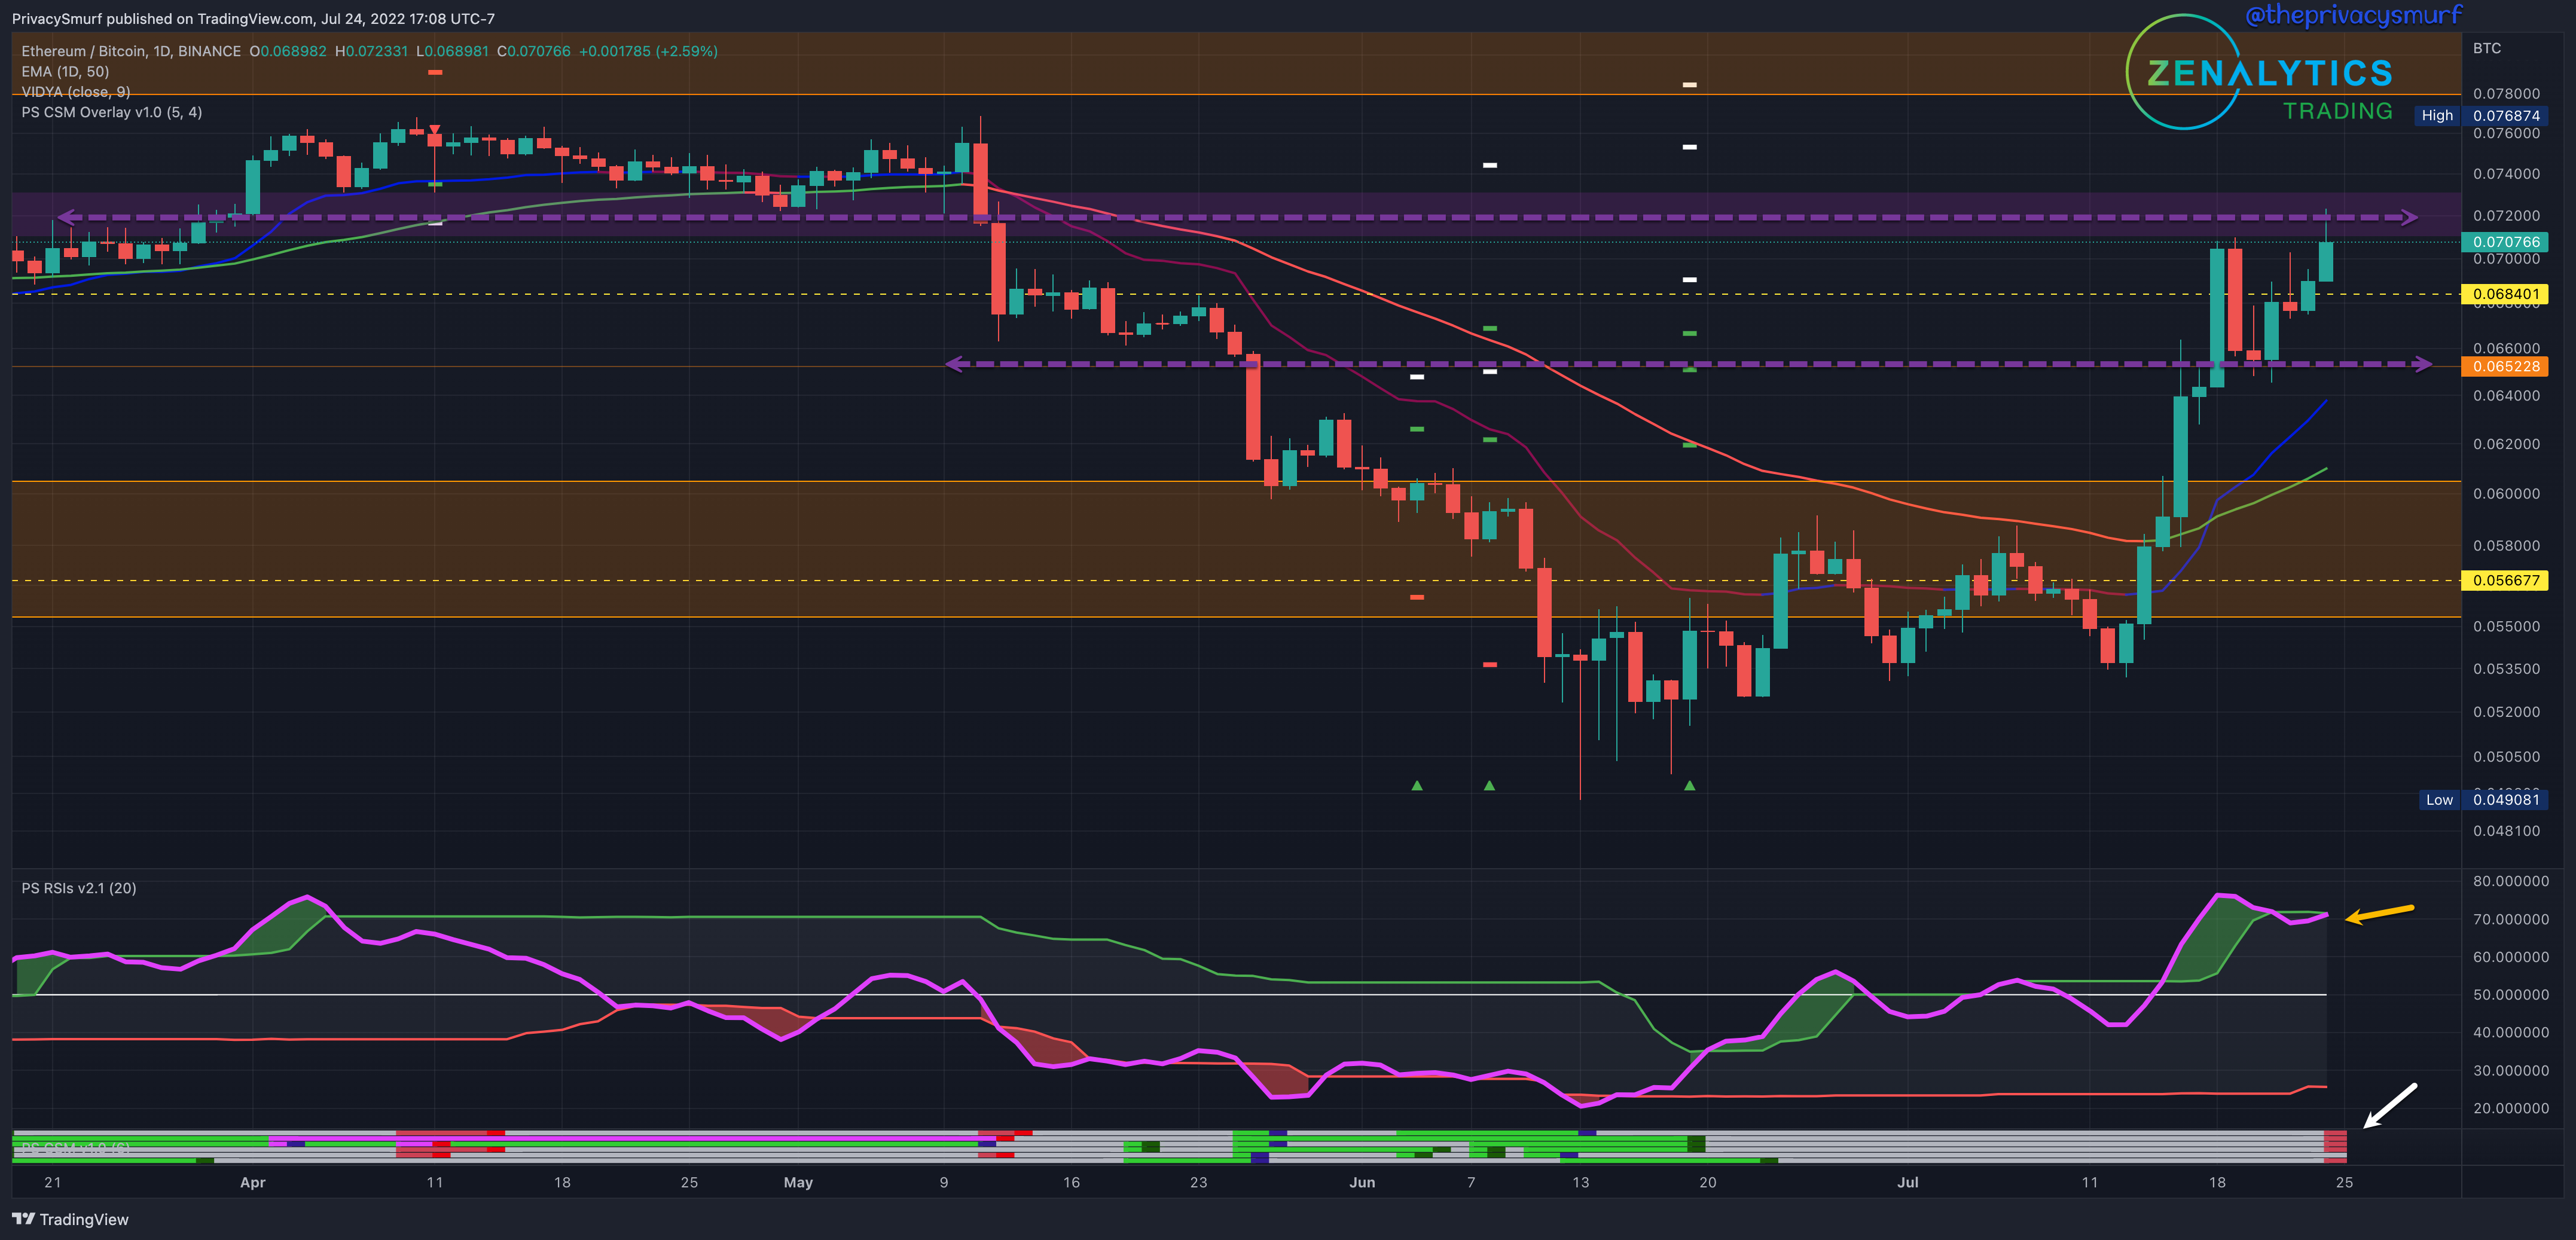
It was a volatile week for the ETH/BTC chart swinging quickly back and forth from the 0.072 resistance and the 0.0665 level. The RSI (yellow arrow) is showing a potential break above the top band again which may occur with a flash above the resistance, but I’m hesitant to say the break will be continuation as the Correction Strength Meter, my custom indicator at the bottom of the chart, is showing bearish divergences on price action oscillators (white arrow). The candles are plotting new highs, but the momentum on the oscillators is not matching that bullishness. It’s something to monitor as the week goes on. New higher on oscillators like the RSI or MACD or Momentum will suggest that the ETH buyers are back in the market and it will continue gaining on BTC. I’d put the next level of resistance at the highs of this chart around 0.078 if a bullish break does come through. With BTC showing the potential for a bearish break if ETH also shows the same this will also be a bearish chart or will continue ranging, likely in the drawn-on purple line segments.
ETH/USDT Weekly Structure
https://www.tradingview.com/chart/JPTp0aXw/
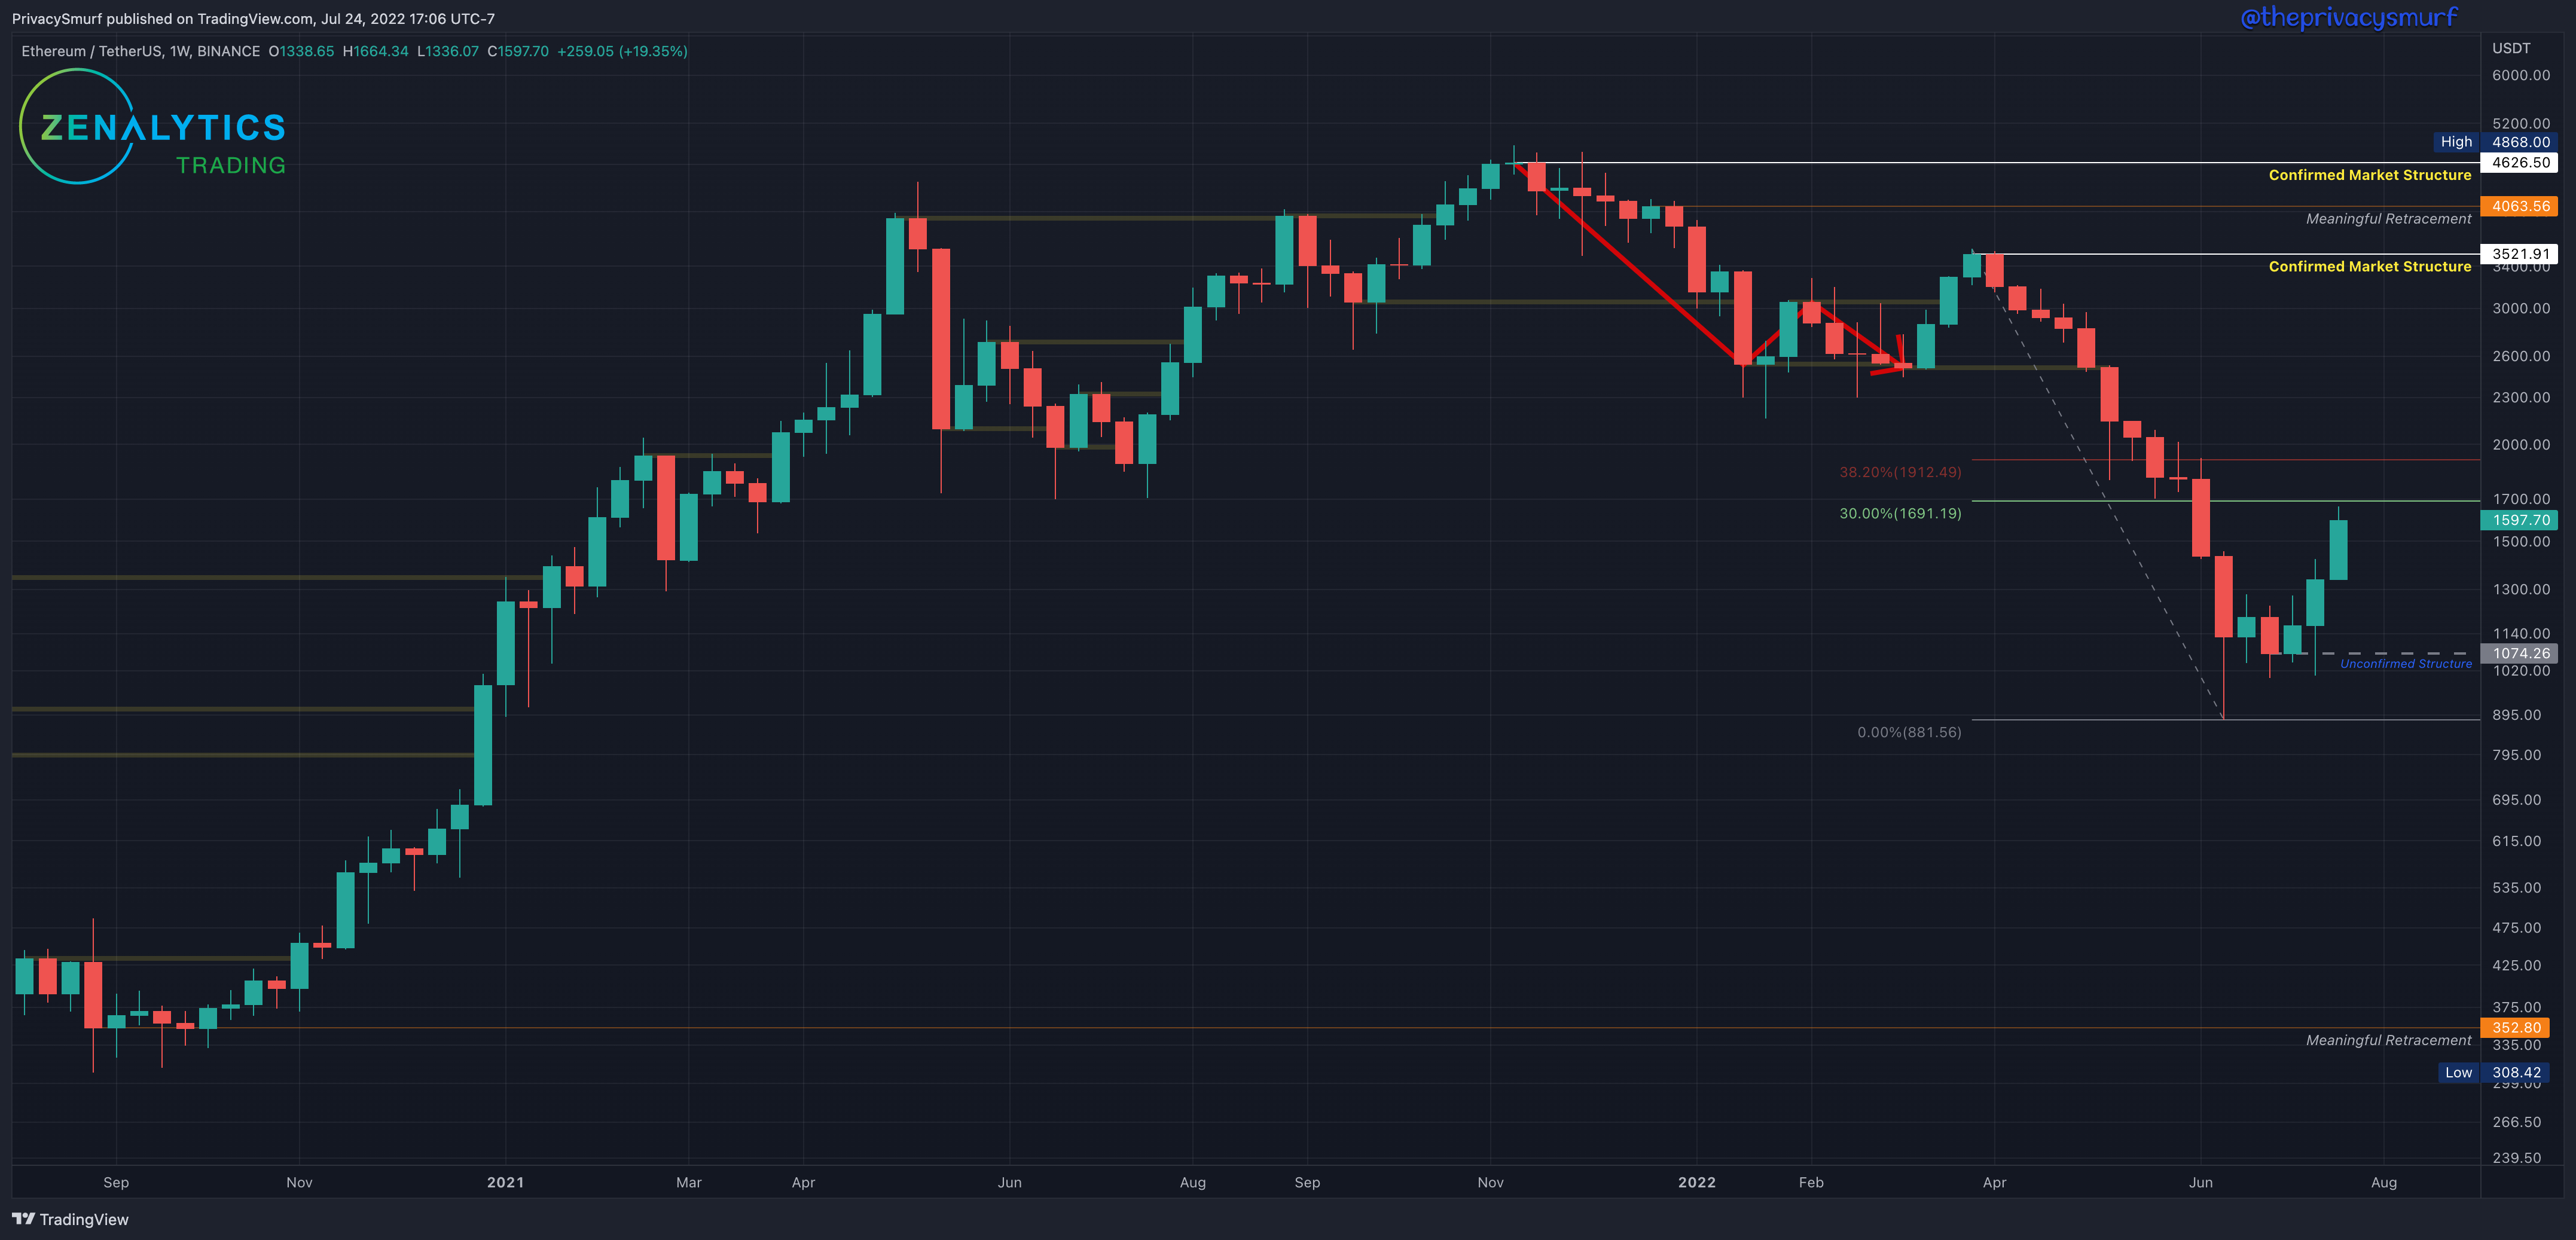
Like BTC, ETH closed bullish this past week; otherwise, no changes in the long-term picture. With no new lower low, the fib retracement from the highest high of the last ‘Confirmed Market Structure’ resistance remains at the last lowest low at $881. Since the last posting, there has been no new lower low close past $1074, so it remains the ‘Unconfirmed Structure.’ If prices increase from here with a close above $1912, this will confirm the structure as support. The weekly market structure trend is still bearish.
From a long-term investing perspective, there are no moves to be made (for the HODL bags) since the ‘meaningful retracement’ at $1232 from Jan 2021 was hit, and the DCA order was filled. The next lower buy location for me is at the broken structure at $800 from 2021 (it is in no way an attempt to time the market or call a bottom but is a location of value) and $352. Given current technicals, I don’t expect that to hit soon, but I have DCA orders there. From a long-term trading perspective, a buy order (for selling at the next cycle peak) won’t be taken by me for this timeframe until the market shifts back to bullishness. This is a tough call to make as that will require many weeks of waiting while potentially missing much of a move. An earlier cue that I would explore if the chart lacked the technicals could alternatively be taken from the ETH/BTC chart if it changes structure before the ETH/USDT chart.
ETH/USDT Daily Chart
https://www.tradingview.com/chart/xbB6lkZu/
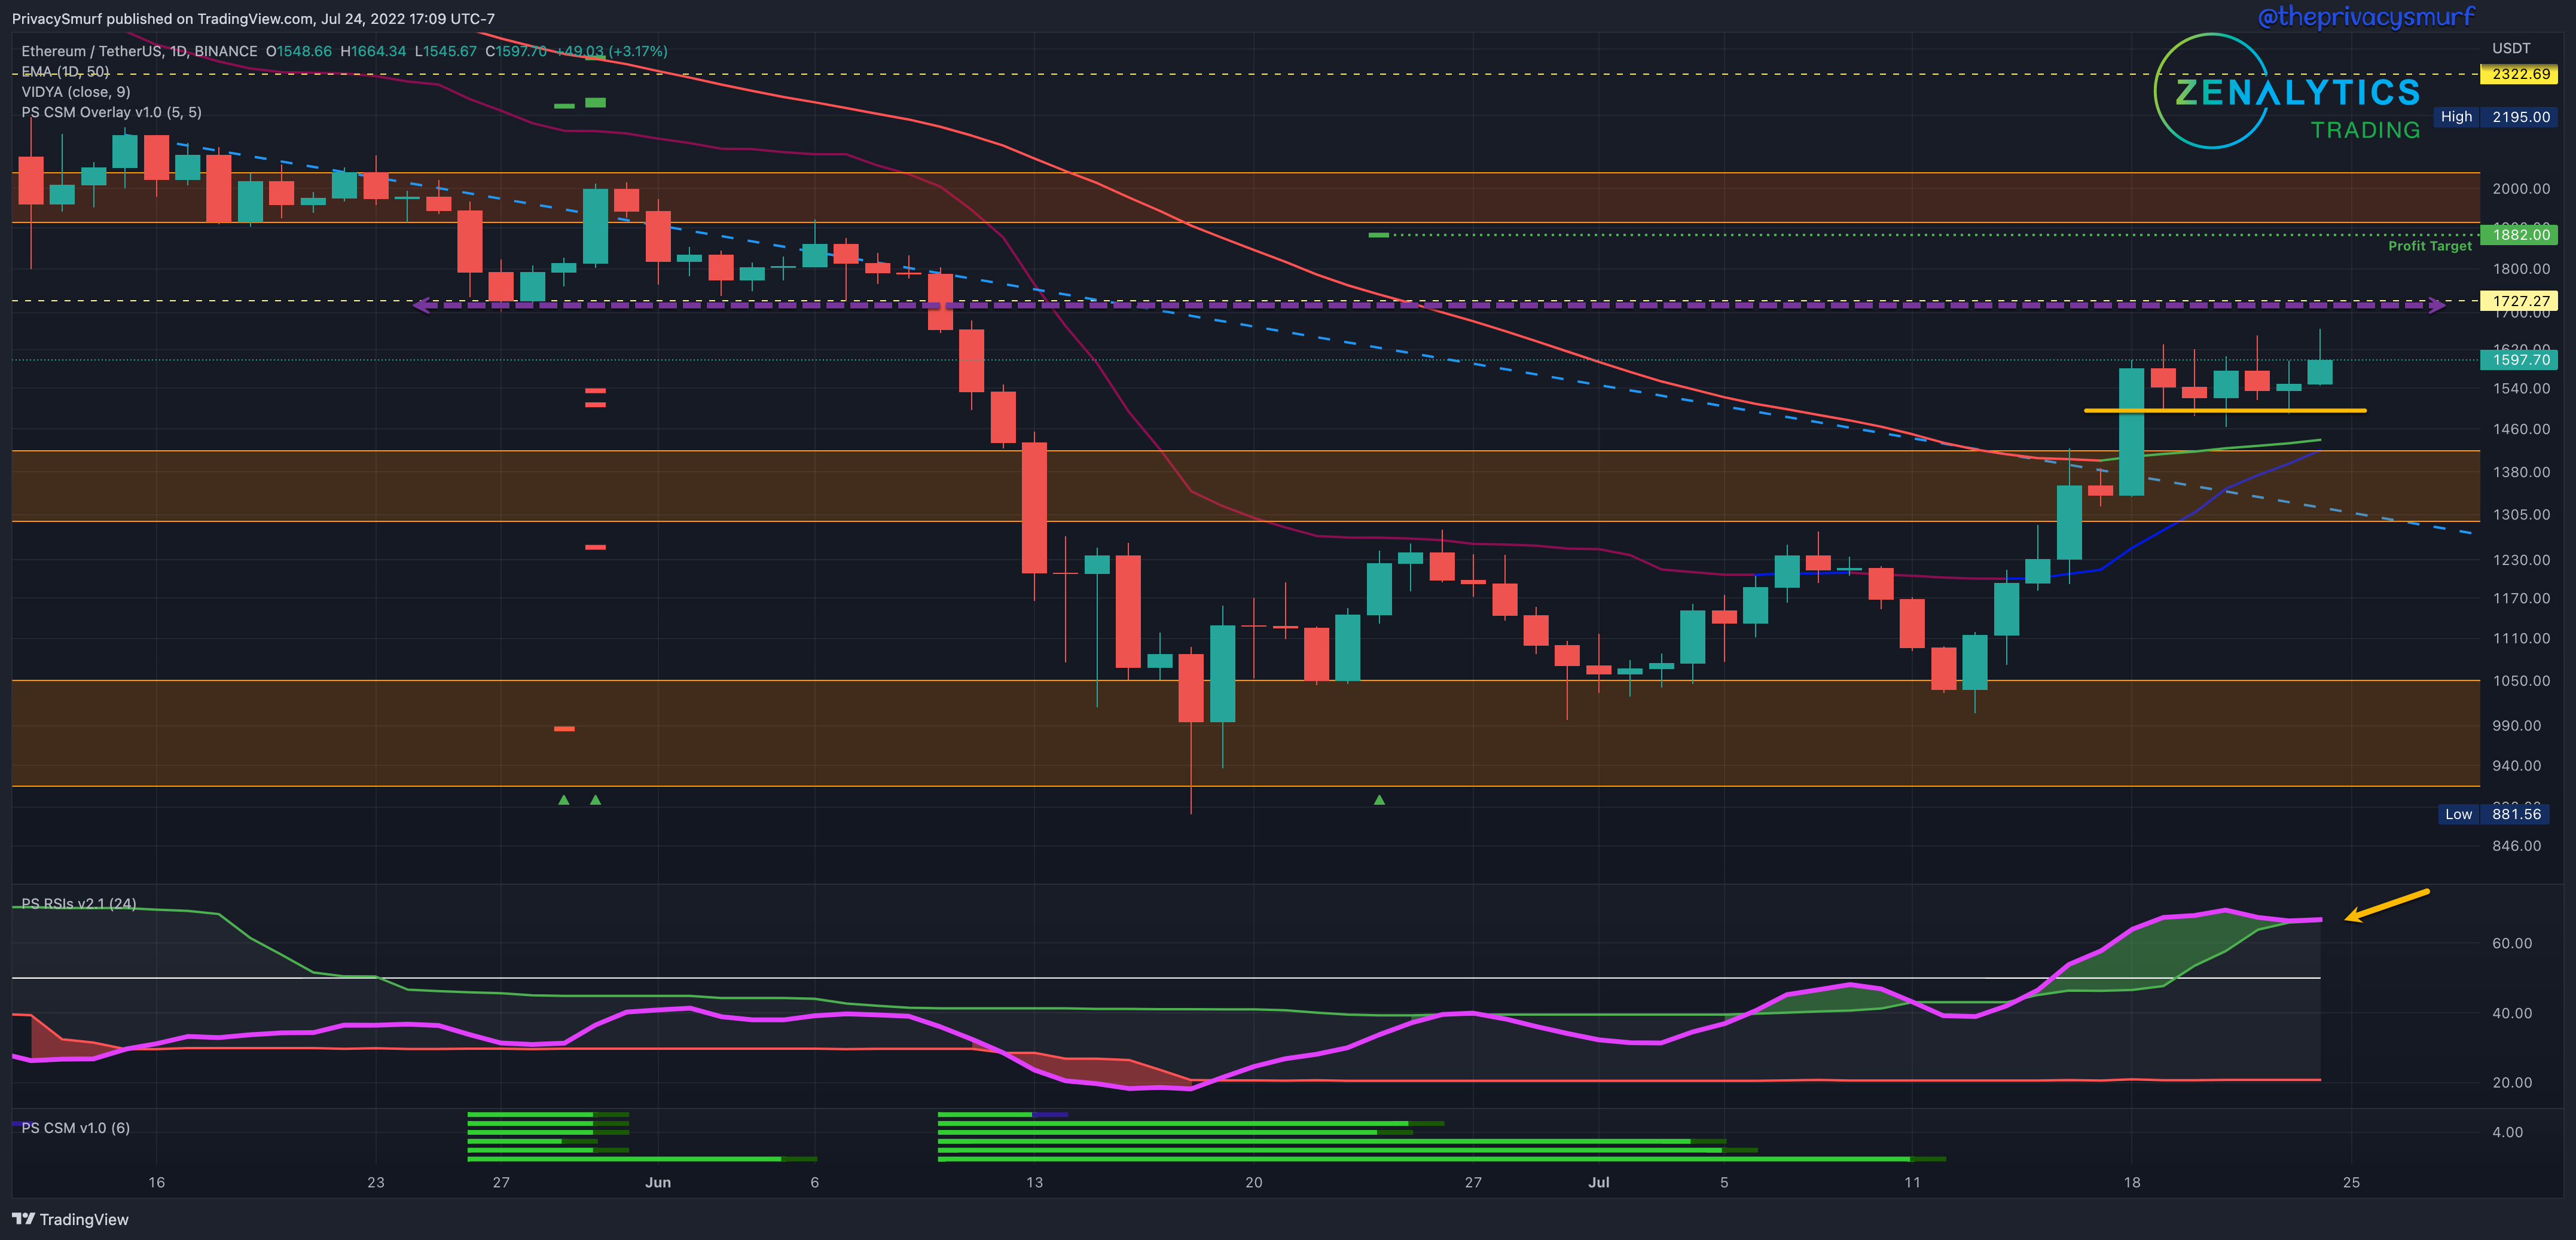
Early in the week, ETH broke above the 50-Day EMA and the top of the historical resistance zone. This is a good sign of strength. ETH is also showing consolidation just above $1500. If the RSI (yellow arrow) curls further back into the bands I’d expect that level to fail and a test of at least the 50-Day EMA or possibly around the descending trendline for support. This might be a good opportunity to make a short to mid term bullish trade if the technicals support that trade idea when visiting these supports. Ideally, closing prices don't extend below $1350. If this is the case then this may drag out the wait to resume bullishness.
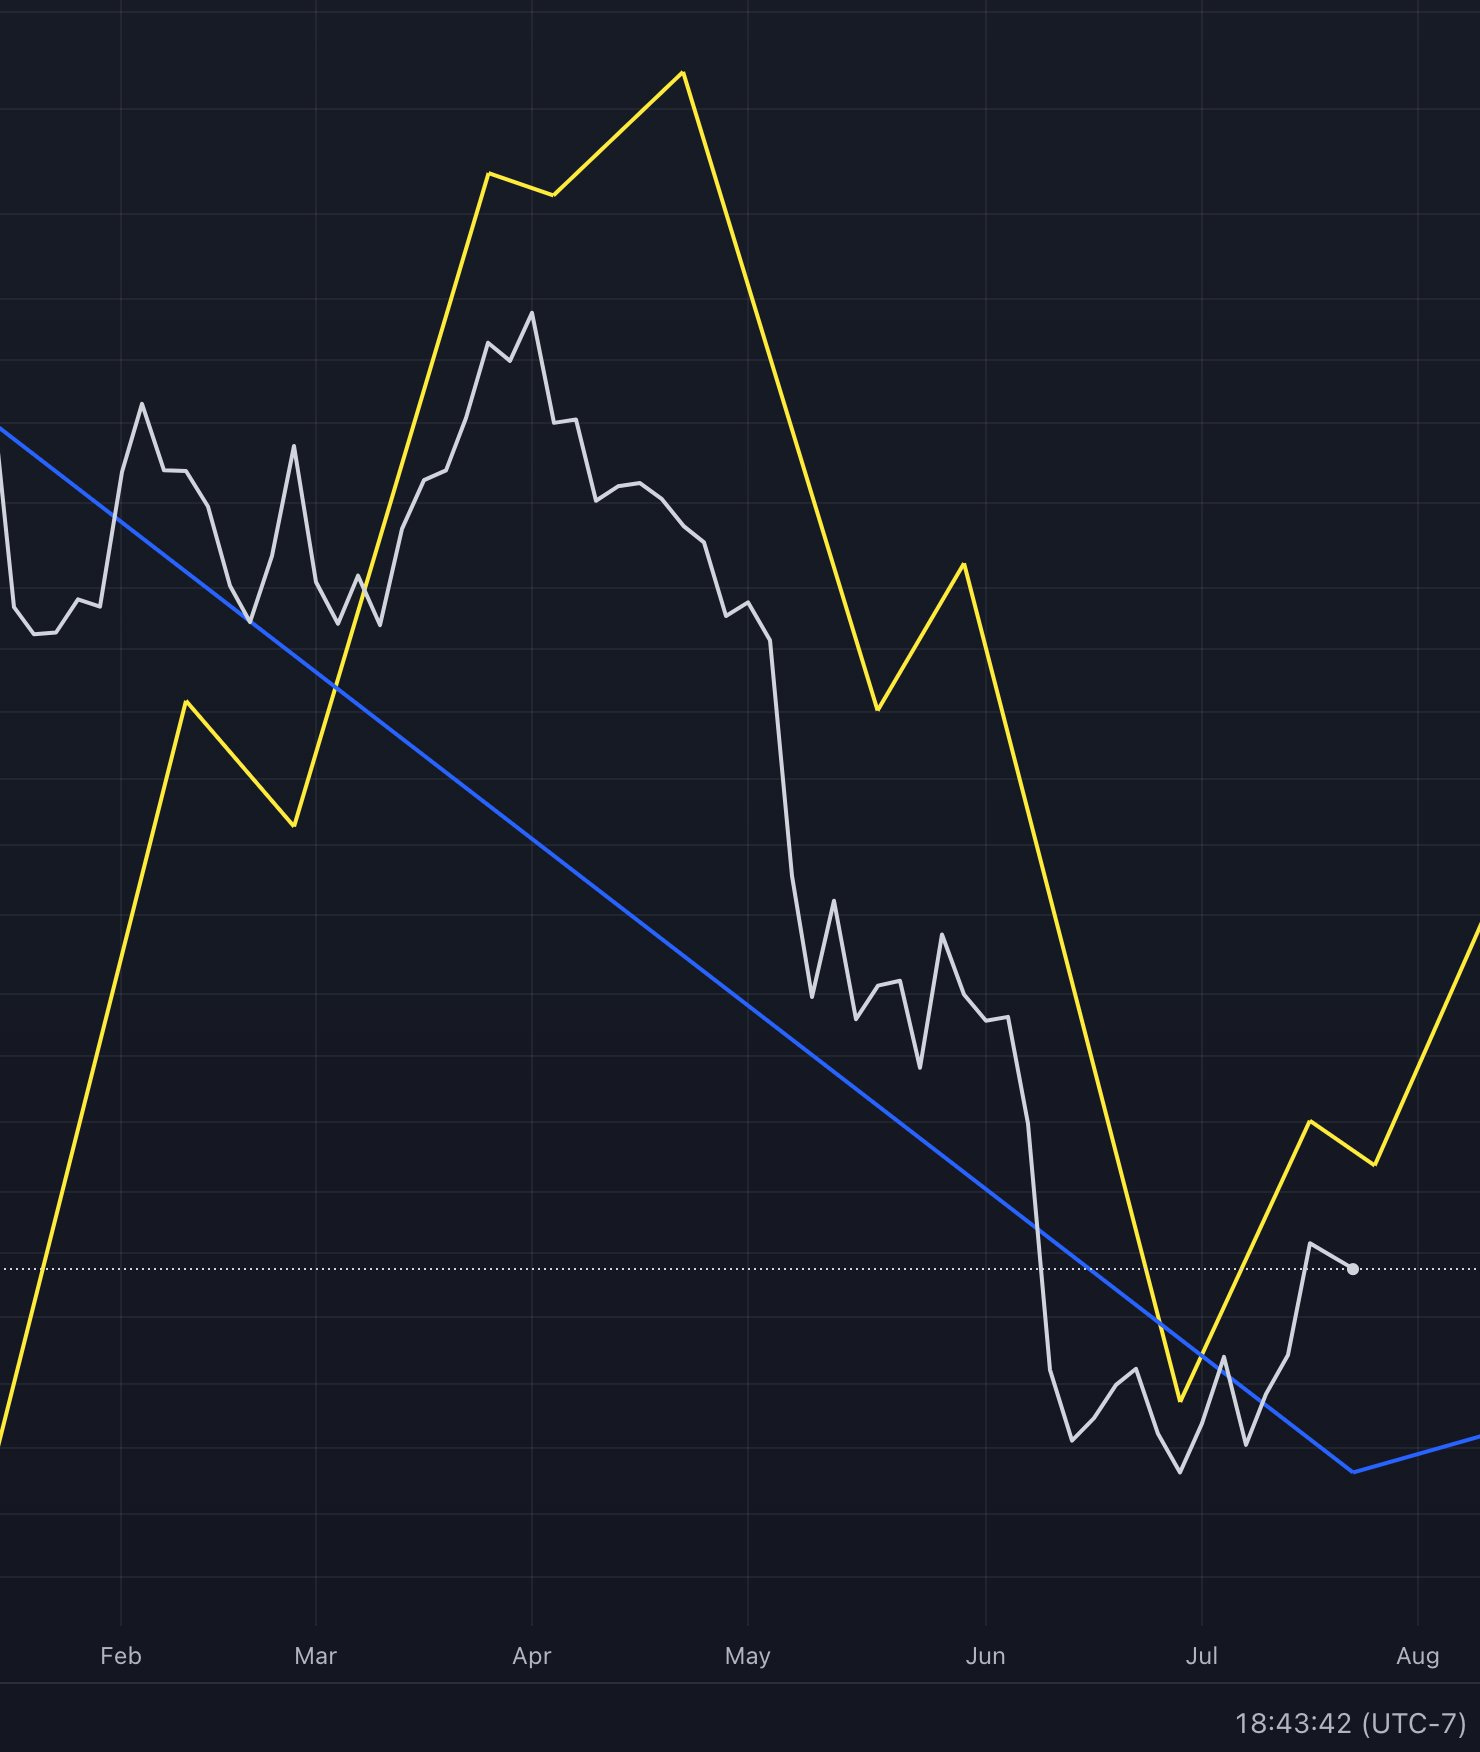
So far, we are tracking well with the cyclical projections from the quarterly forecast. The potential turn near the end of the month and beginning of August will tell how the quarter will finish.
@theprivacysmurf