

Sunday Synopsis #49: King of the Rodeo
Sunday Synopsis #49: King of the Rodeo
Good times to roll on.

Man, it’s been a hot summer. I haven’t been back to SE Texas for a while, but it sure feels like I am back with this heat wave. Good thing there are plenty of lakes up here in the NW to keep cool in. A paddleboard purchase early last month has been paying dividends. What are your fave outdoor activities? Partner and I just booked tickets and reservations to a bunch of national parks for a road trip through Utah in October.
BTC/USDT Weekly Structure
https://www.tradingview.com/chart/4v8qizyI/
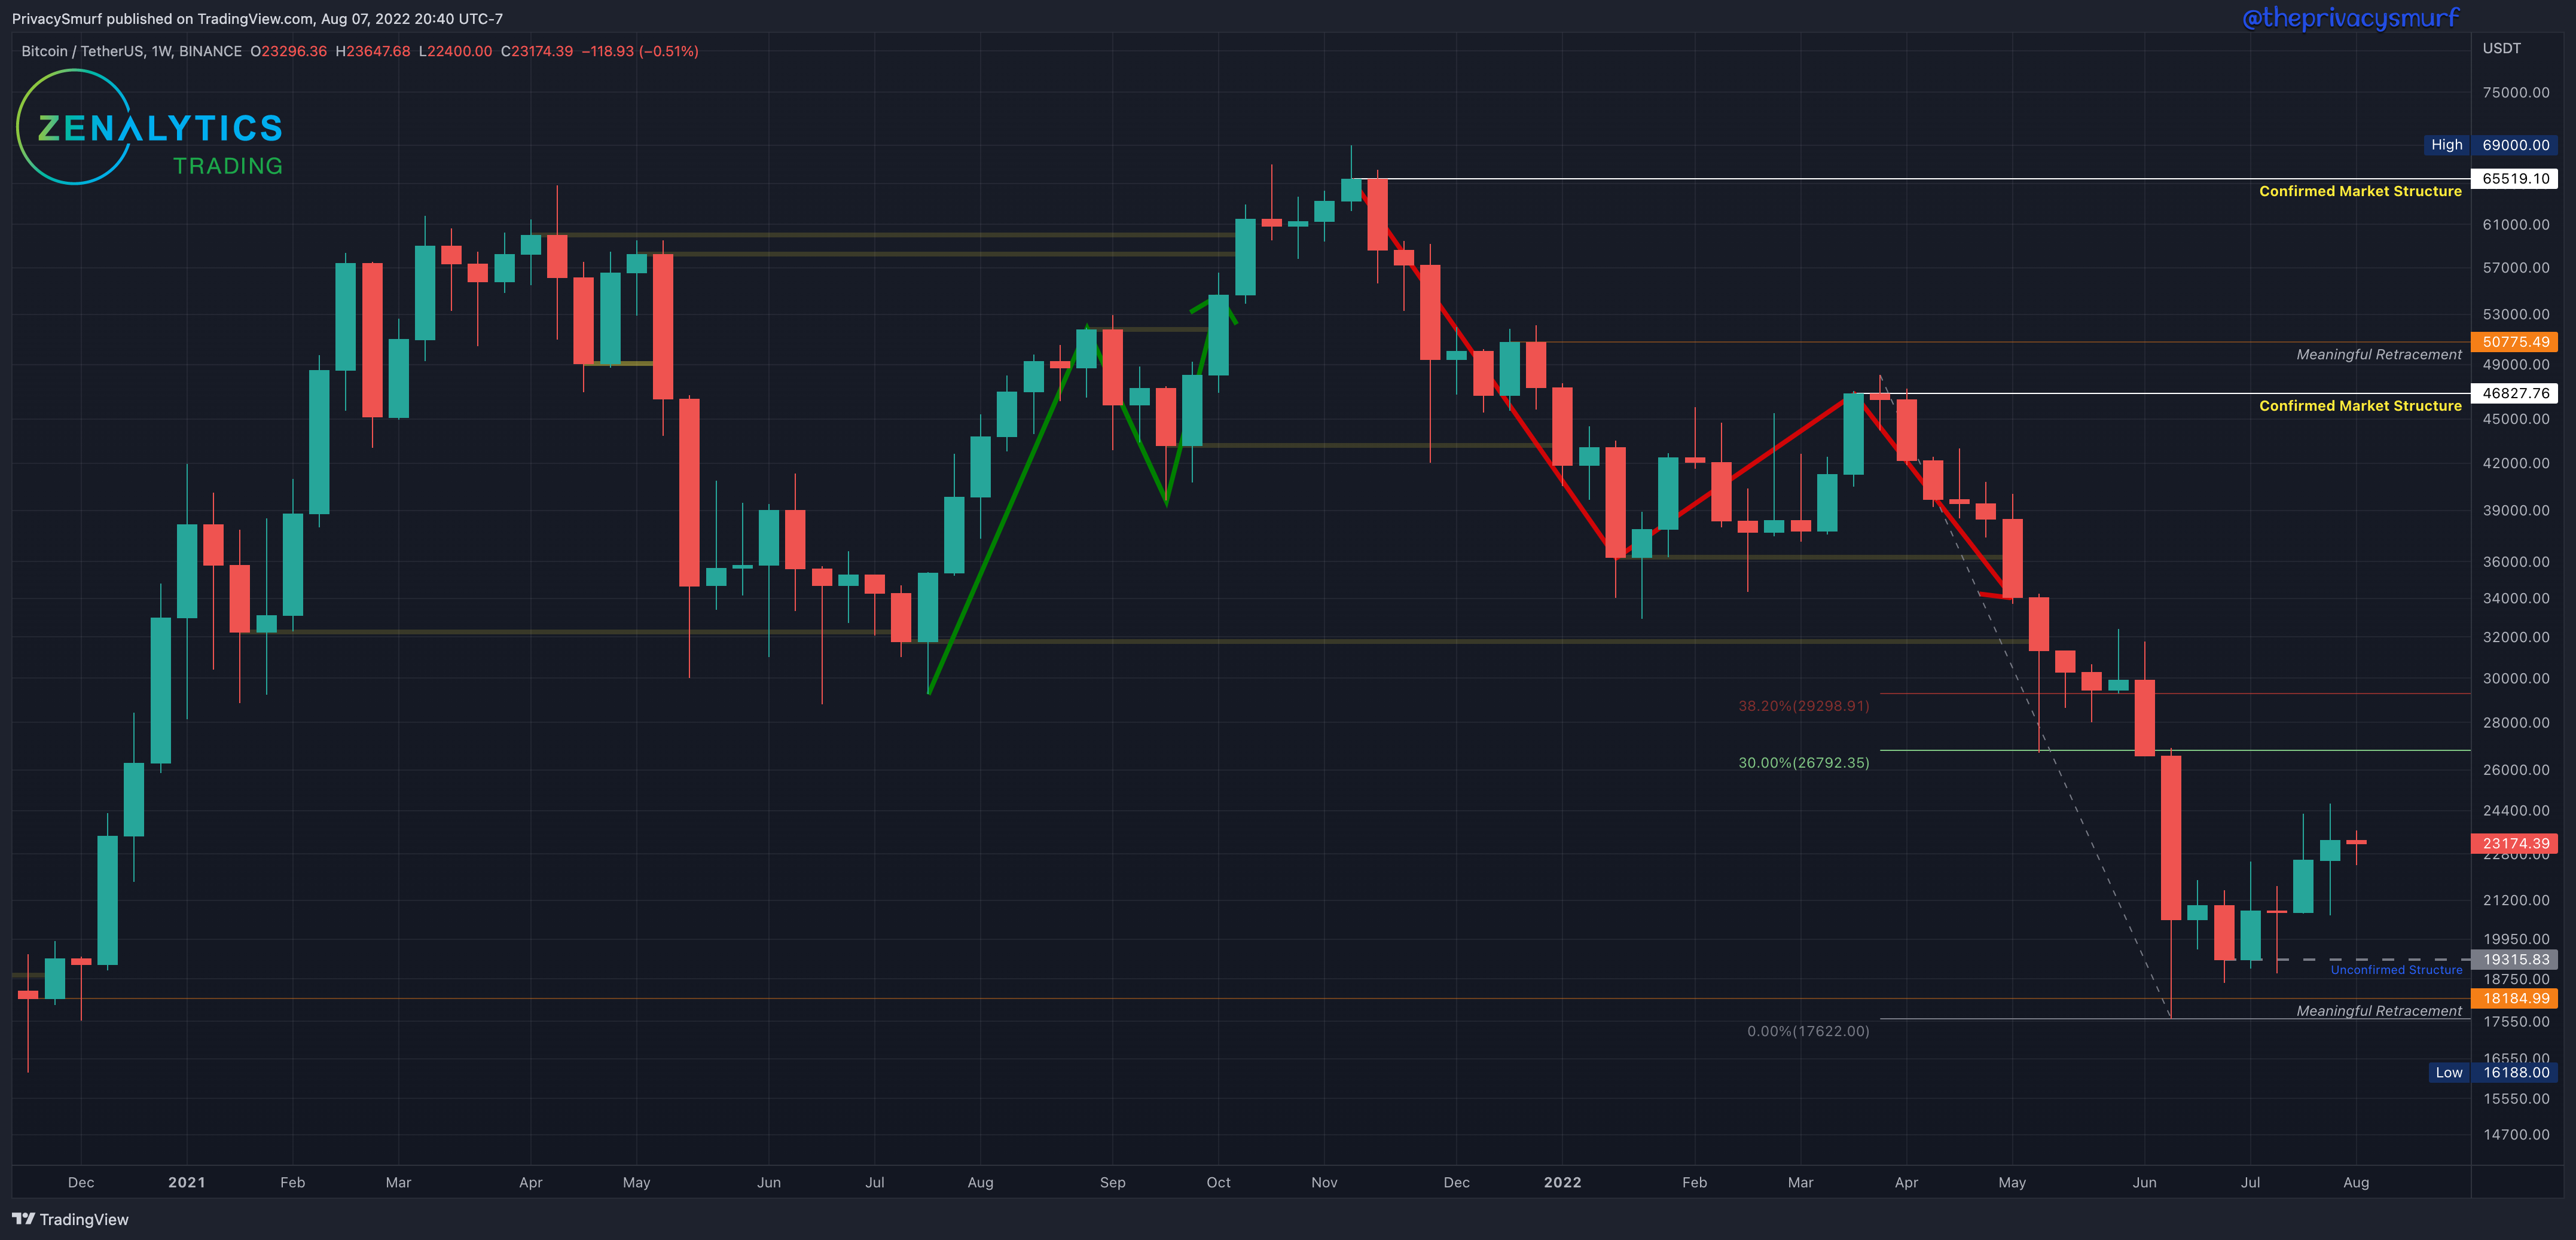
This past week BTC closed bearish otherwise no changes with the long-term picture. With no new lower low, the fib retracement from the highest high of the last ‘Confirmed Market Structure’ resistance remains at the last lowest low at $17622. Since the last posting, there has been no lower low close past $19315, so it remains the ‘Unconfirmed Structure.’ If prices increase from here with a close above $29298, this will confirm the structure as support. The weekly market structure trend is still bearish.
From a long-term investing perspective, there are no moves to be made (for the HODL bags) since the ‘meaningful retracement’ at $18185 from Dec 2021 was been hit and the DCA order was filled. The next lower buy location for me is at $10256 (it is in no way an attempt to time the market or call a bottom but is a location of value). Given current technicals, I don’t expect that to hit soon, but I have a DCA order. From a long-term trading perspective, a buy order (for selling at the next cycle peak) won’t be taken by me for this timeframe until the market shifts back to bullishness. I want to buy strength, not weakness.
BTC/USDT Daily Chart
https://www.tradingview.com/chart/jjSdFW4b/
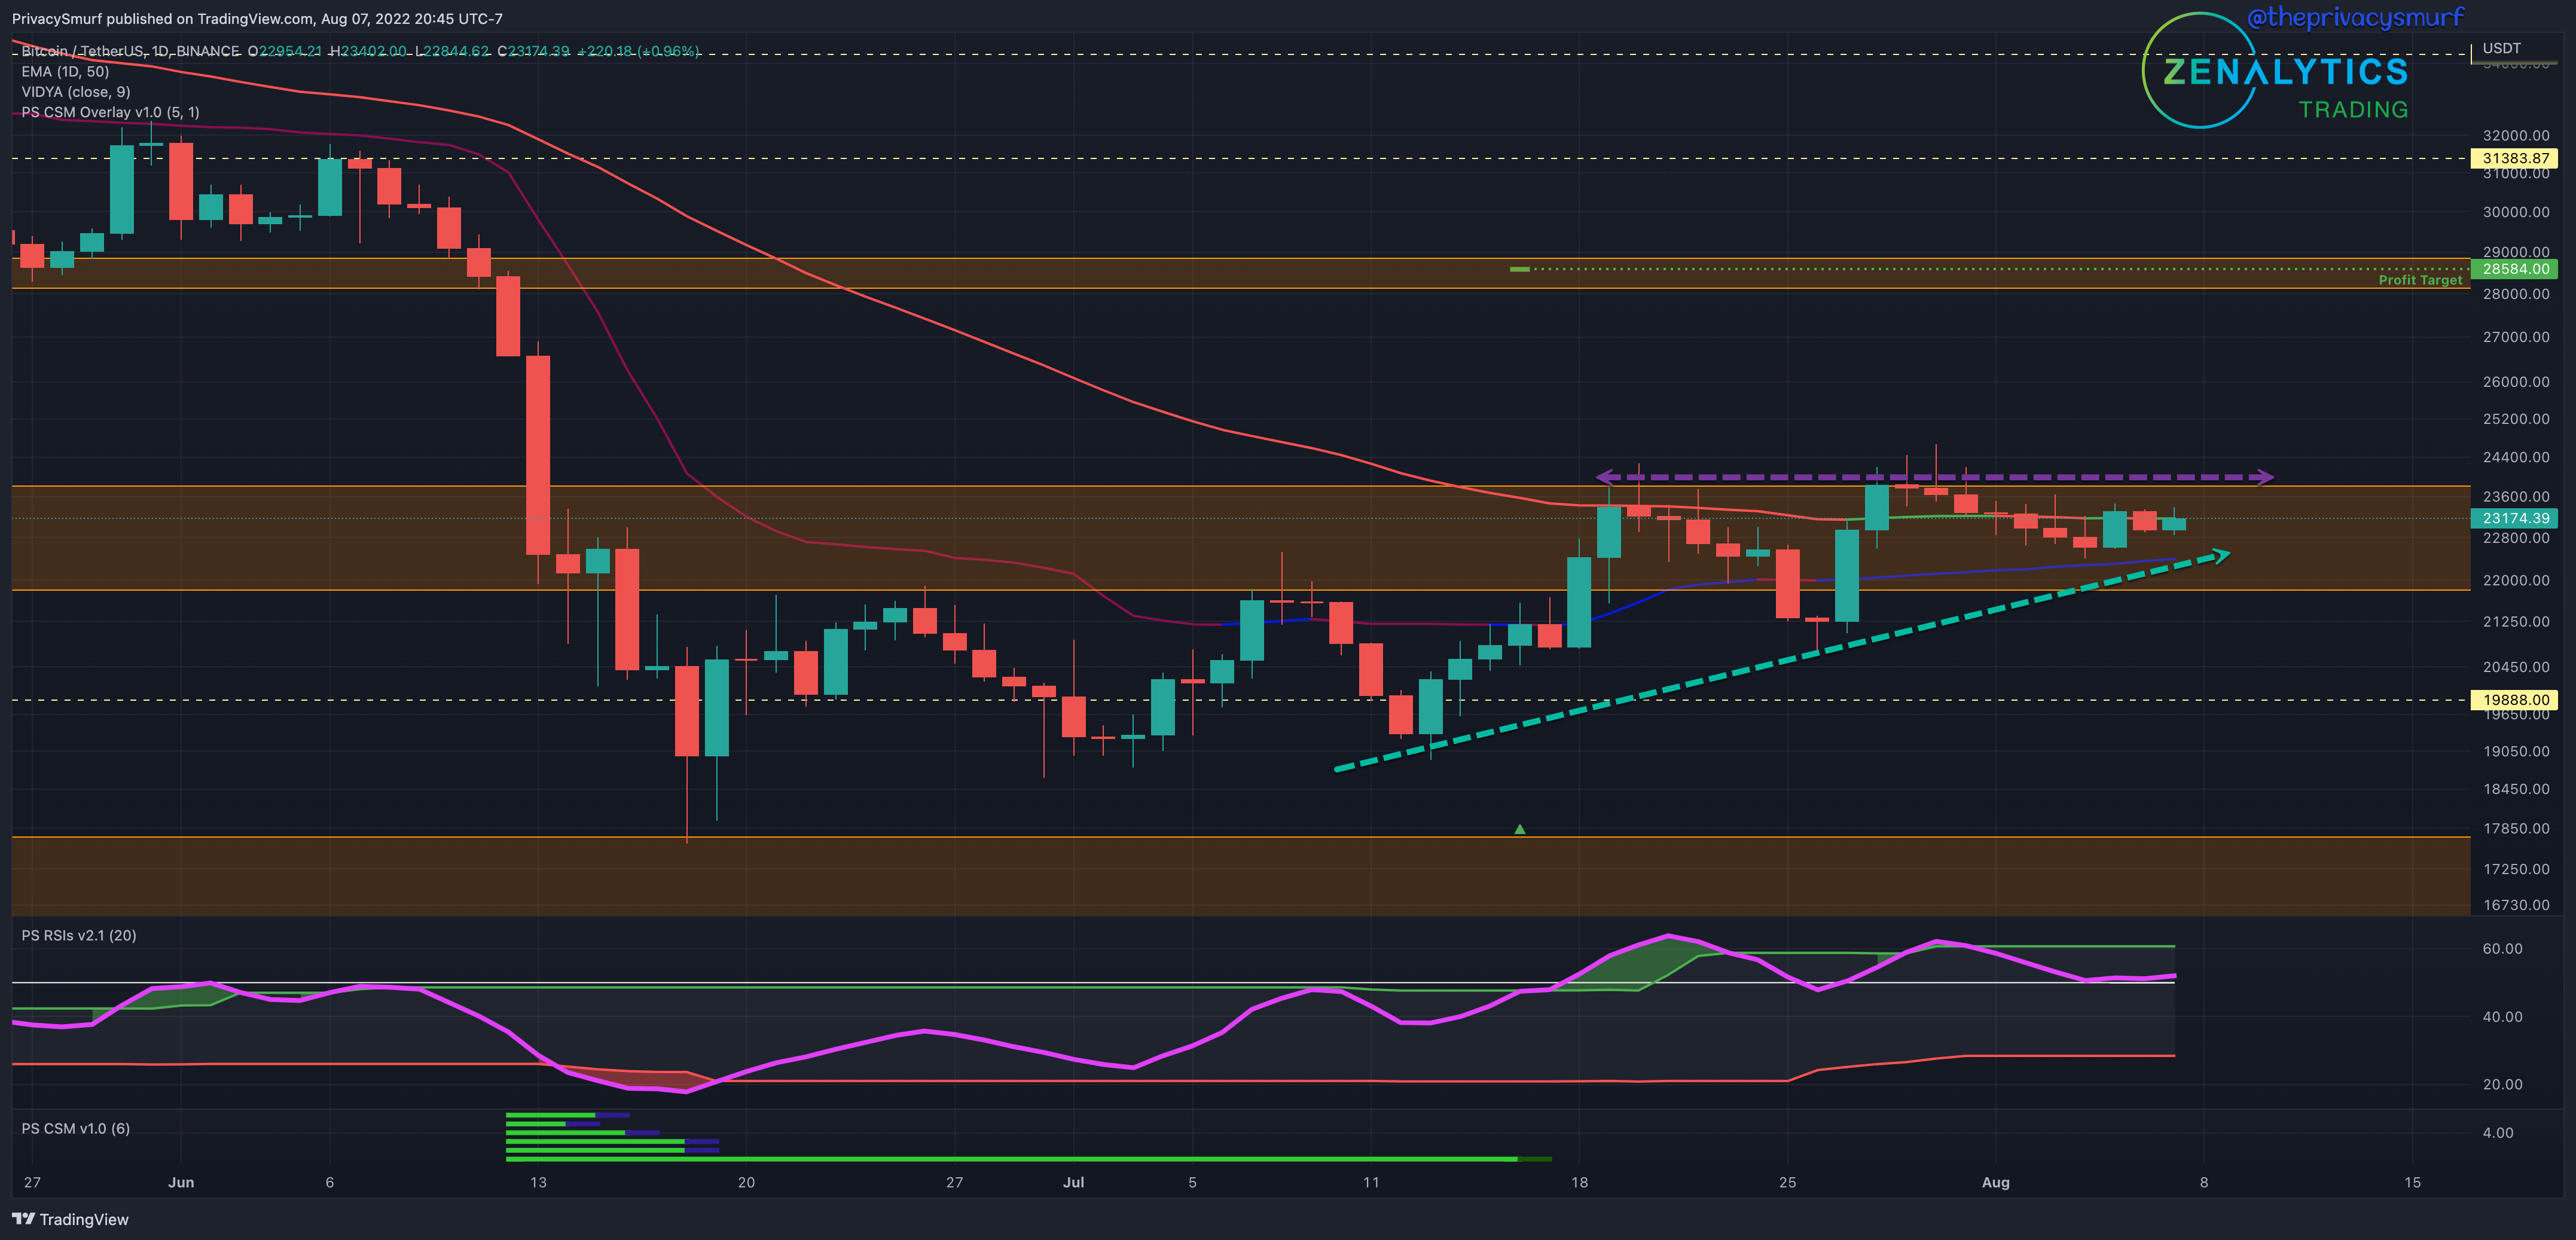
It’s been a slightly boring week for BTC. Price can be seen consolidating in a wedge. This will likely lead to a volatile exit. With the RSI still above the midline, representing bullish pressure on prices, I’d expect it to be a break to the upside. This may not be immediate action, though. There’s not a lot of momentum with BTC at the moment. A bullish break would have to come as a quick pump. Otherwise, there will likely be more chop early in the week. Any downside action, I’d still support the idea of increasing prices and short-term bullishness as long as there’s no daily close under $21k.
Q3 Forecast Update
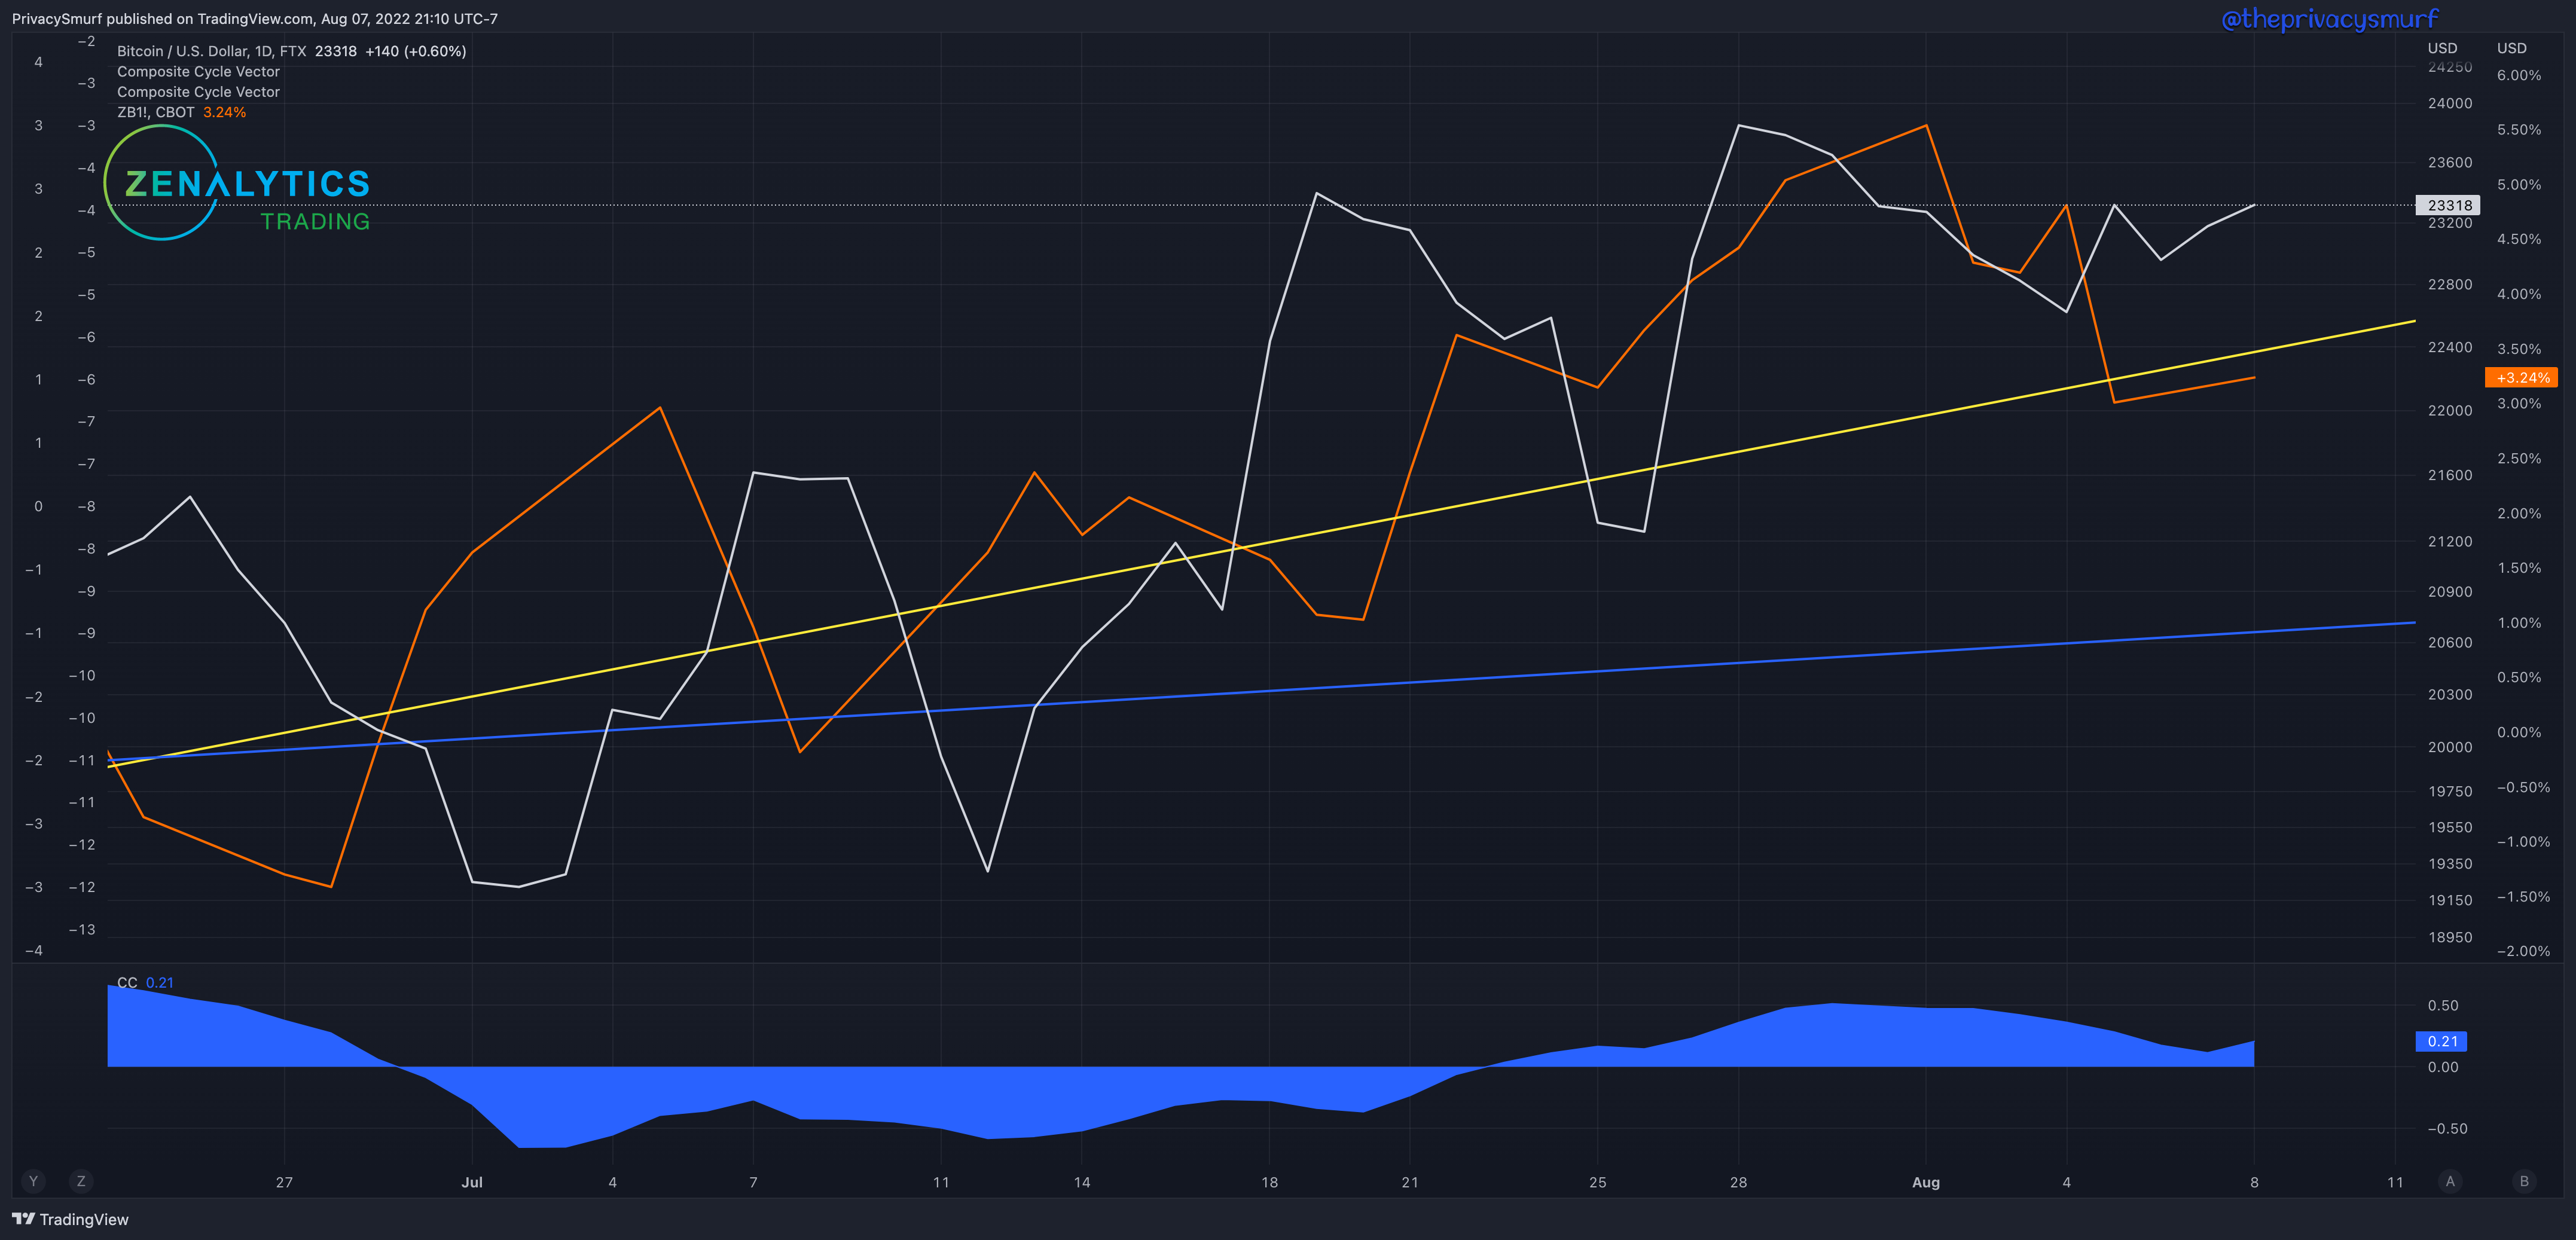
Earlier this month, I provided some projections in the Q3 Forecast, and it’s still on track. I briefly covered some of the relationships between BTC and Bonds, which typically is an inverse relationship since Bonds are considered safe “risk off” assets and BTC largely act as a speculative “risk on” asset. This cycle was interesting because weekly and daily were positively correlated and sold off before Q3. Here’s a snippet:
“…the cycles weekly and daily are at the bottoms for the bonds… If the correlation on the daily flips to bullish BTC would likely follow bonds up… highlights the support of a dead cat regardless of macro market conditions. People can still be buying bonds to be safe while also riding the crypto train… to get back any level of losses…
Below we can see the brief moment in early July when the daily correlation bottomed out and started rising to a positive correlation as both BTC (white) and 30yr bonds (orange) increased in price in line with the daily and weekly cycles (yellow and blue lines).

Here’s that forecast in case you missed it.

ETH/BTC Weekly Structure
https://www.tradingview.com/chart/sacHlXOv/

Since the last posting, we have a new element to add. During the break, a candle had a low pierce the 30% retracement line shown above (green arrow). This, in my estimation, qualifies as a “Meaningful Retracement” and may act as potential support in the future. Since the candle that broke the level is a bullish candle, I will mark the LOW (0.065136) as the “Meaningful Retracement,” and if it was a bearish candle, I would anchor the label on the CLOSE.
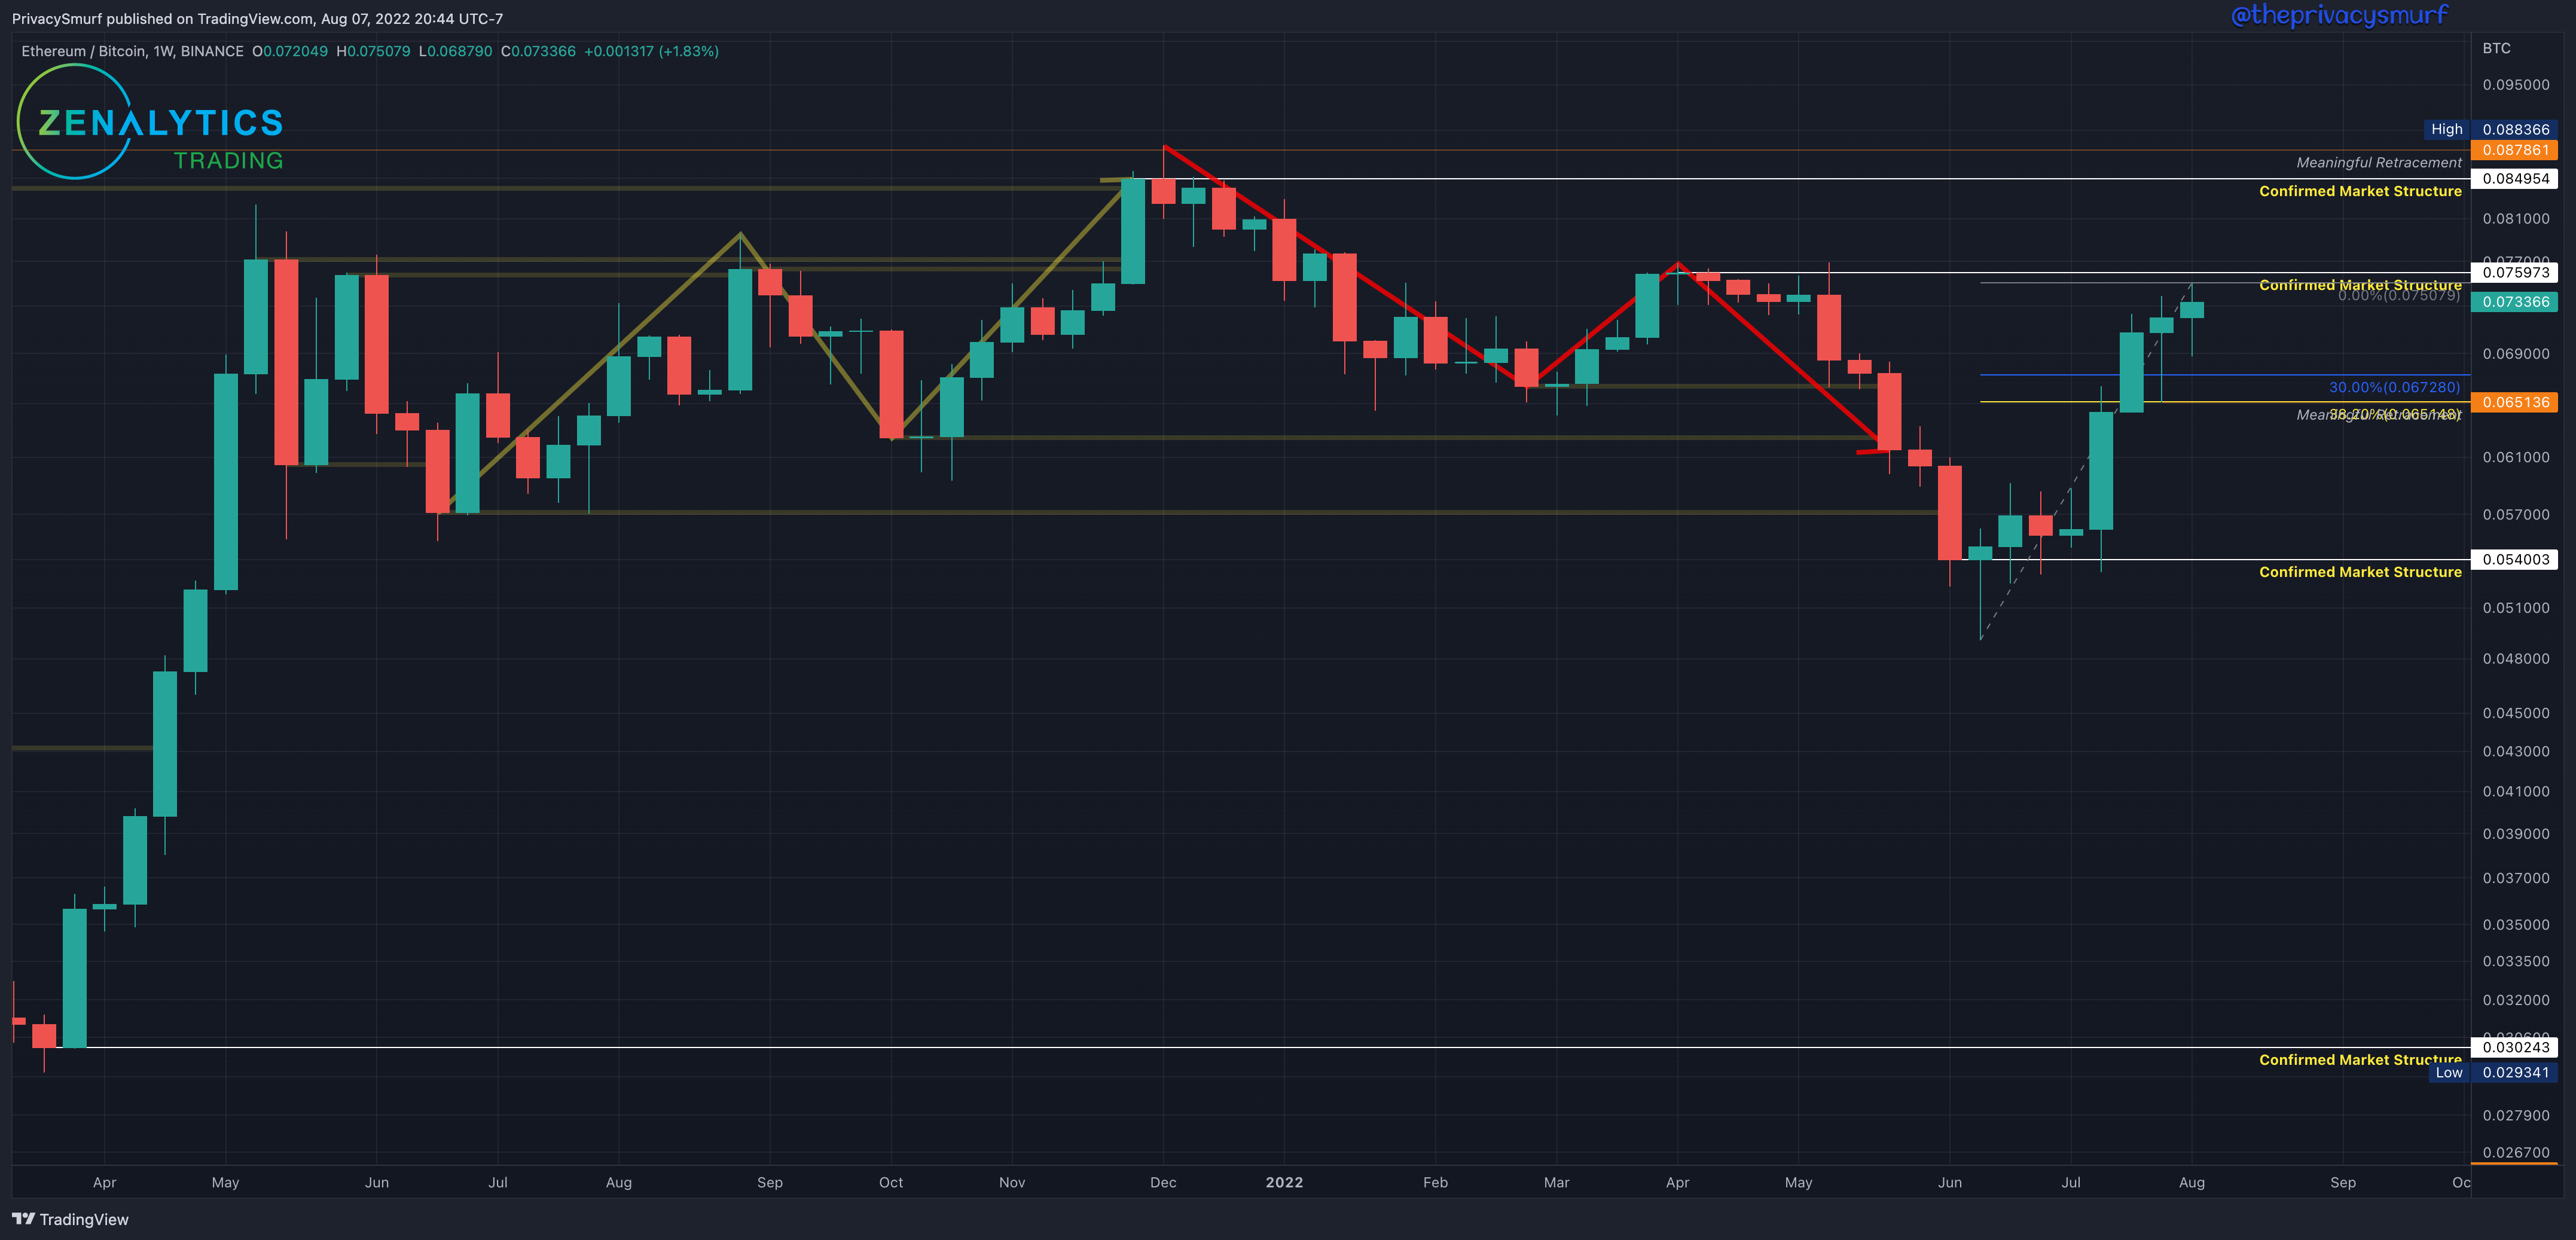
Moving ahead to the current weekly close, there has been a new higher high, so the high anchor of the fib tool extends to the new highest high at 0.075079. If prices decrease from here for two weeks with a close below 0.065148 this will confirm the above structure as resistance. The weekly market structure trend is still bearish despite this bullish price action.
From a long-term investing perspective, I expect that if we fall here and lose value in the ETH/BTC relationship, the new structure at just under 0.054 may act as support. I don't have a long-term DCA buy order there. Still, it may provide an opportunity to buy for long-term hodl positions if that price level was missed prior (and it should in no way be an attempt to time the market or call a bottom, it is a location of value as shown by the amount buying activity there). Given current technicals, **I don’t expect that to be hit in the near term. From a long-term trading perspective, a buy order (for selling at the next cycle peak) won’t be taken by me for this timeframe until the market shifts back to bullishness. This would come with either a breakout of structure at 0.0759 (which is less than ideal as I’d miss the beginning of the trend shift) OR in a few weeks after a retracement where I can buy a bounce/support test (which is a more conservative and ideal move, for me). On a side note, the prior structure support that broke back in mid-May at around the 0.0645 level may act as a resistance in the near term.
There’s an interesting shift coming up cyclically for BTC and that may put ETH on its heels soon as BTC takes the spotlight back.
ETH/BTC Daily Chart
https://www.tradingview.com/chart/gTkSjkj6/
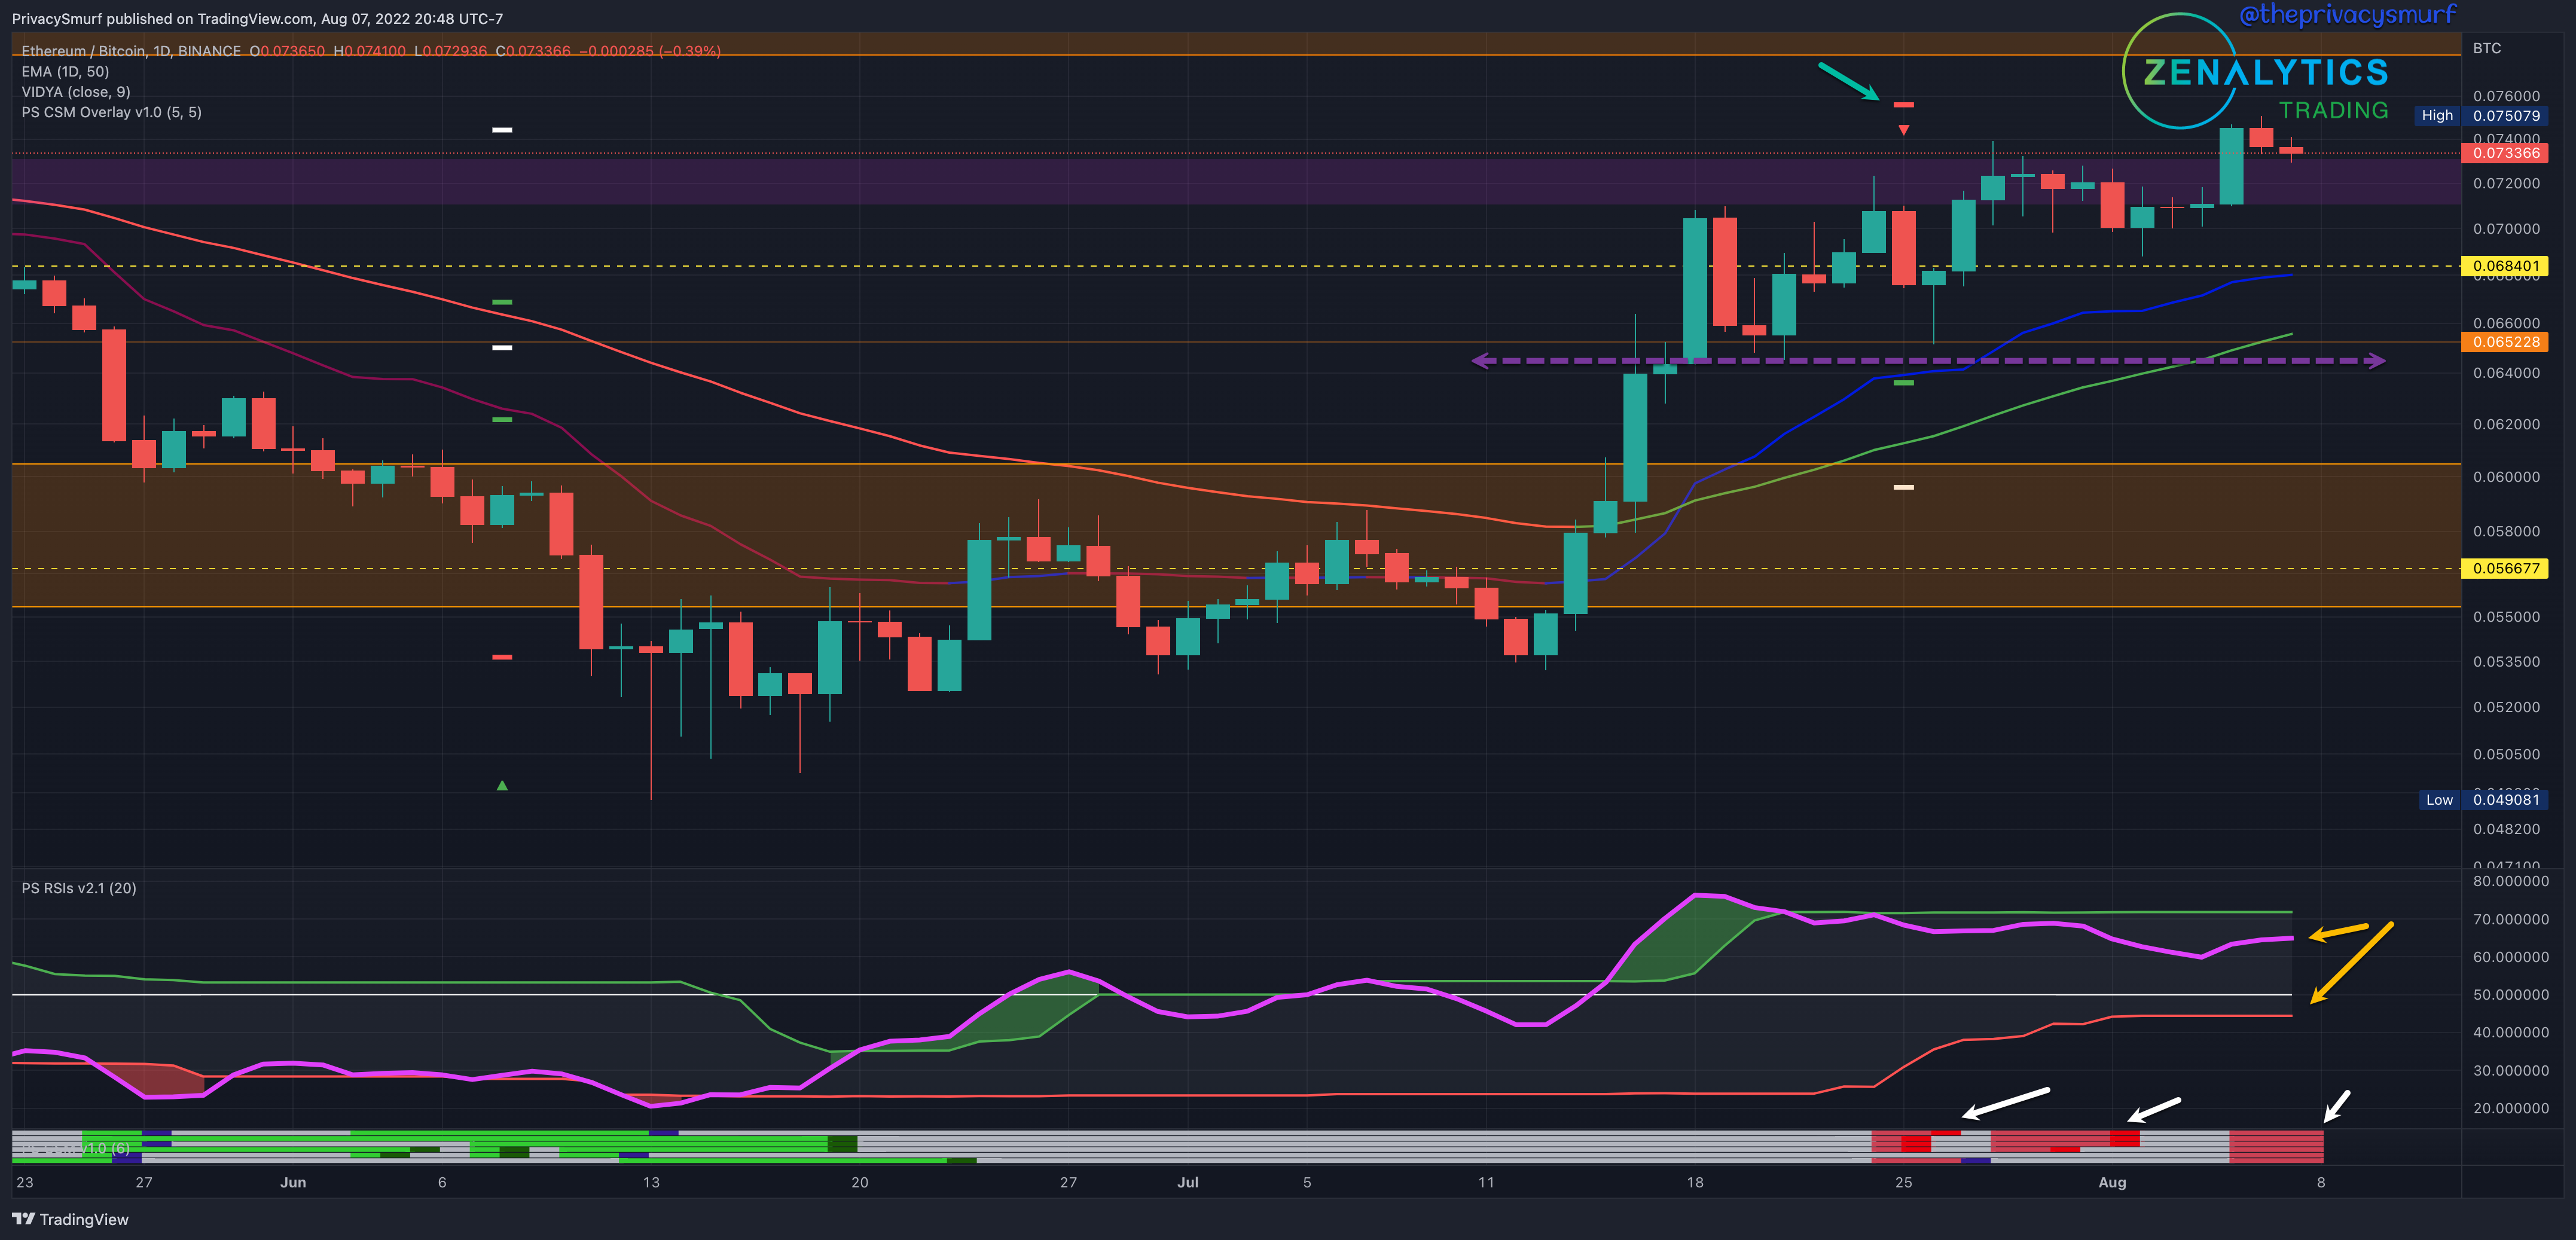
It was another volatile week for the ETH/BTC chart with an eventual break of the trouble area reaching above 0.072. The RSI (yellow arrow) is showing a decrease in the underlying buy bid presenting bearish divergence. The ETH/BTC chart is extending to new highs while the RSI is not matching and is in decline. There have been multiple bearish trade signals from my custom indicator the Correction Strength Meter (white arrows at the bottom of the chart). The bottom adaptive band of the RSI is creeping up towards the midline which supports the possibility of volatile bearish price action if the RSI breaks it to the downside. I’d expect the earliest support to come in above the bearish targets plotted from the Correction Strength Meter at around 0.065. I’d still keep the next level of resistance at the highs of this chart around 0.078 if an exuberant bullish break does come through. In this instance, I would consider it a decent time to consider selling some ETH back into BTC to secure some short-term profits on ETH that had been purchased with BTC around the low 0.052-0.058 range. There’s still time for ETH/BTC to keep gaining but the risk of downside is also increasing.
ETH/USDT Weekly Structure
https://www.tradingview.com/chart/JPTp0aXw/

ETH closed bullish this past week; otherwise, no changes in the long-term picture. With no new lower low, the fib retracement from the highest high of the last ‘Confirmed Market Structure’ resistance remains at the last lowest low at $881. Since the last posting, there has been no new lower low close past $1074, so it remains the ‘Unconfirmed Structure.’ If prices increase from here with a close above $1912, this will confirm the structure as support. The weekly market structure trend is still bearish.
From a long-term investing perspective, there are no moves to be made (for the HODL bags) since the ‘meaningful retracement’ at $1232 from Jan 2021 was hit, and the DCA order was filled. The next lower buy location for me is at the broken structure at $800 from 2021 (it is in no way an attempt to time the market or call a bottom but is a location of value) and $352. Given current technicals, I don’t expect that to hit soon, but I have DCA orders there. From a long-term trading perspective, a buy order (for selling at the next cycle peak) won’t be taken by me for this timeframe until the market shifts back to bullishness. This is a tough call to make as that will require many weeks of waiting while potentially missing much of a move. An earlier cue that I would explore if the chart lacked the technicals could alternatively be taken from the ETH/BTC chart if it changes structure before the ETH/USDT chart.
ETH/USDT Daily Chart
https://www.tradingview.com/chart/xbB6lkZu/
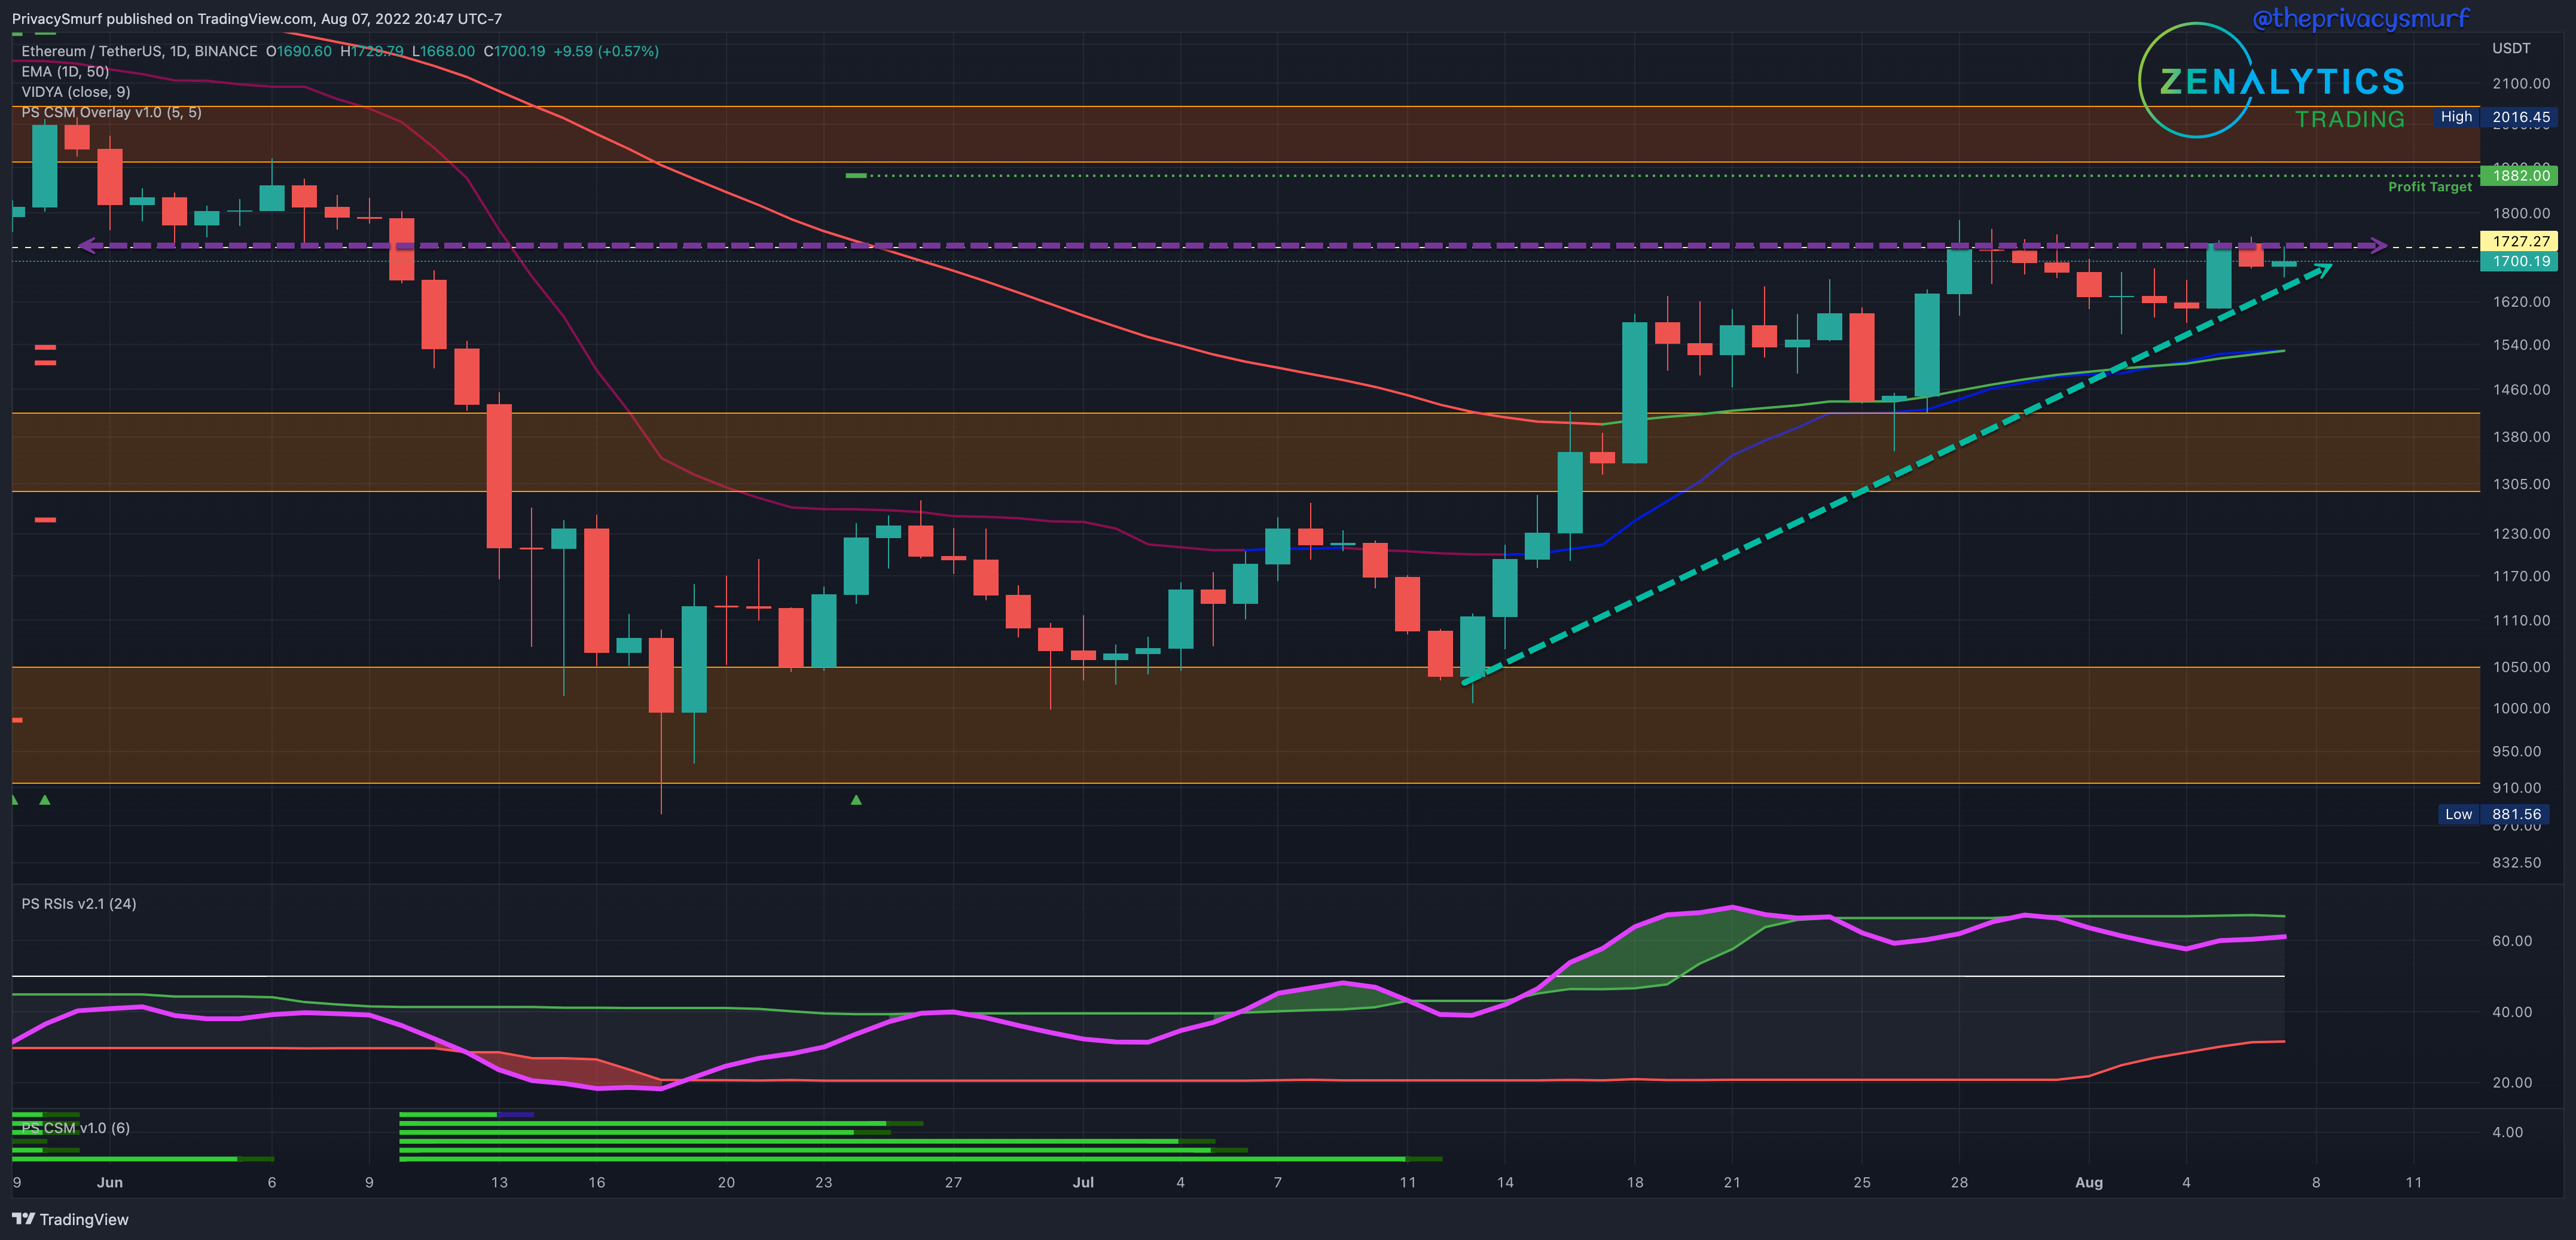
It’s been an up and down week for ETH. Price can be seen consolidating in a wedge at the resistance that was prior support that failed back in Jun. The break of this wedge will likely lead to a volatile exit. With the RSI still above the midline, representing bullish pressure on prices, I’d expect it to be a break to the upside. There’s slightly more momentum here on ETH than with BTC, but breaking up to a new high will throw the chart into bearish divergence. The RSI needs to increase to match with a new high in price. A bullish break this week would likely hit the profit target plotted by my indicator, the CSM, signaled back in late June. Any downside action, I’d still support the idea of increasing prices and short-term bullishness as long as there’s no daily close under $1450.
We still have some bullish and bearish misalignment in daily/weekly cycles so I’m not expecting a lot of short to mid-term trending price action but there should still be some volatility to take advantage of in short-term trading in both directions. I’ll update the intraday trading ranges again Tuesday and it looks like we’ll be adding MATIC to the list. Also, I’ll be releasing the Notion Trading Journal on Tuesday.
@theprivacysmurf
Thanks once again for your analysis. Question on the eth/usdt weekly info, the close above price target is a btc target? If this Is just a typo, what is the eth price target, Thank you