Sunday Synopsis #5: Independence Day Edition
Sunday Synopsis #5: Independence Day Edition
I'm late again, but it's a free country.


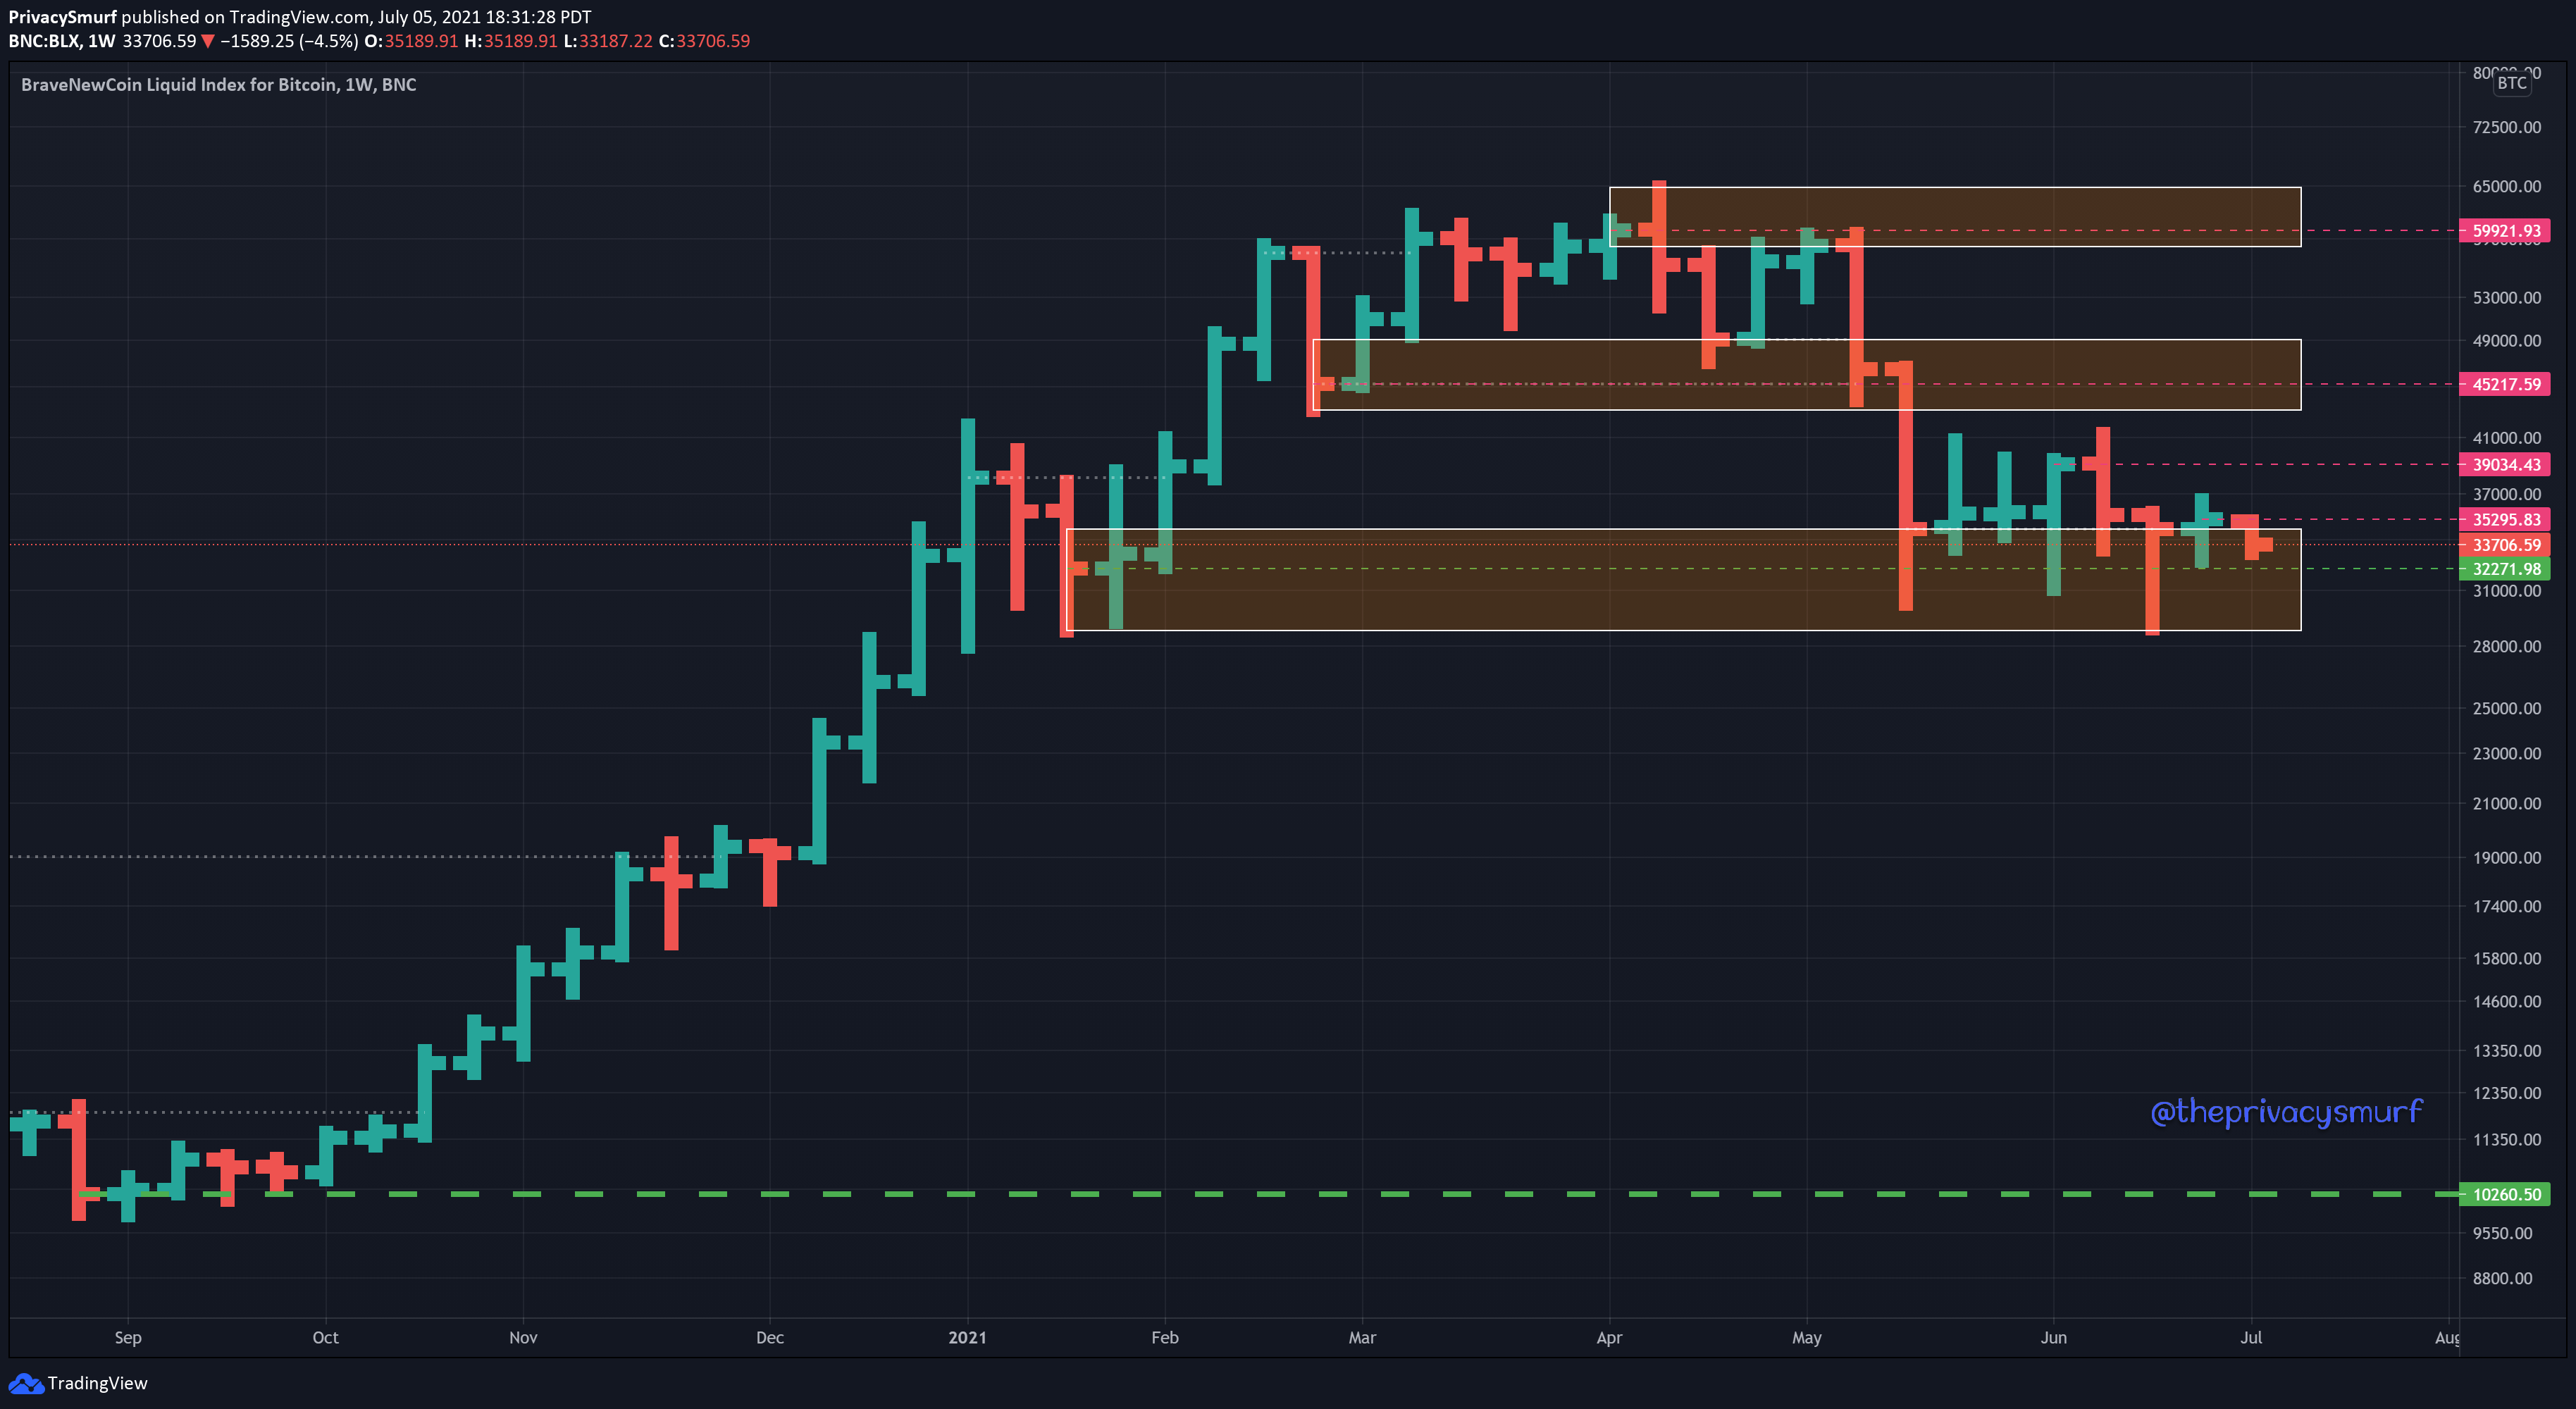
BTC just can’t get its act together. Long-term positions are still in limbo as the weekly close stated above $32271. Bulls are doing everything they can to preserve the bullish trend. These last two weeks the true range has decreased, meaning tighter consolidation, meaning closer to some erratic price action. A weekly close below $32271 and I’d be shoring up positions in profit in preparation for lower potential prices. A weekly close above $39034 and I’m starting to consider some bullish swing trades. A weekly close above $45217 and things may be right in the world again.
Yes… this chart again. Sorry folks. If anything this is a testament to the truth of drawing horizontal support and resistance. These regions have proven to be trouble areas for price consistently. We’ve added a new broken ascending trend line started with the latest trip into the buyer’s area of value on the 26th and added a new descending trendline extending down from the 14th of May. The price is consolidating between the trendline and the closest support. RSI is measuring in line with price so there’s no clear directionality to glean from this. I’ve taken a long position testing out a new trade setup, so I’m wanting a bullish break, but I anticipate resistance still at $35k before moving further up. I’m not concerned with any bearish breakdowns unless we have a daily close under $30720.

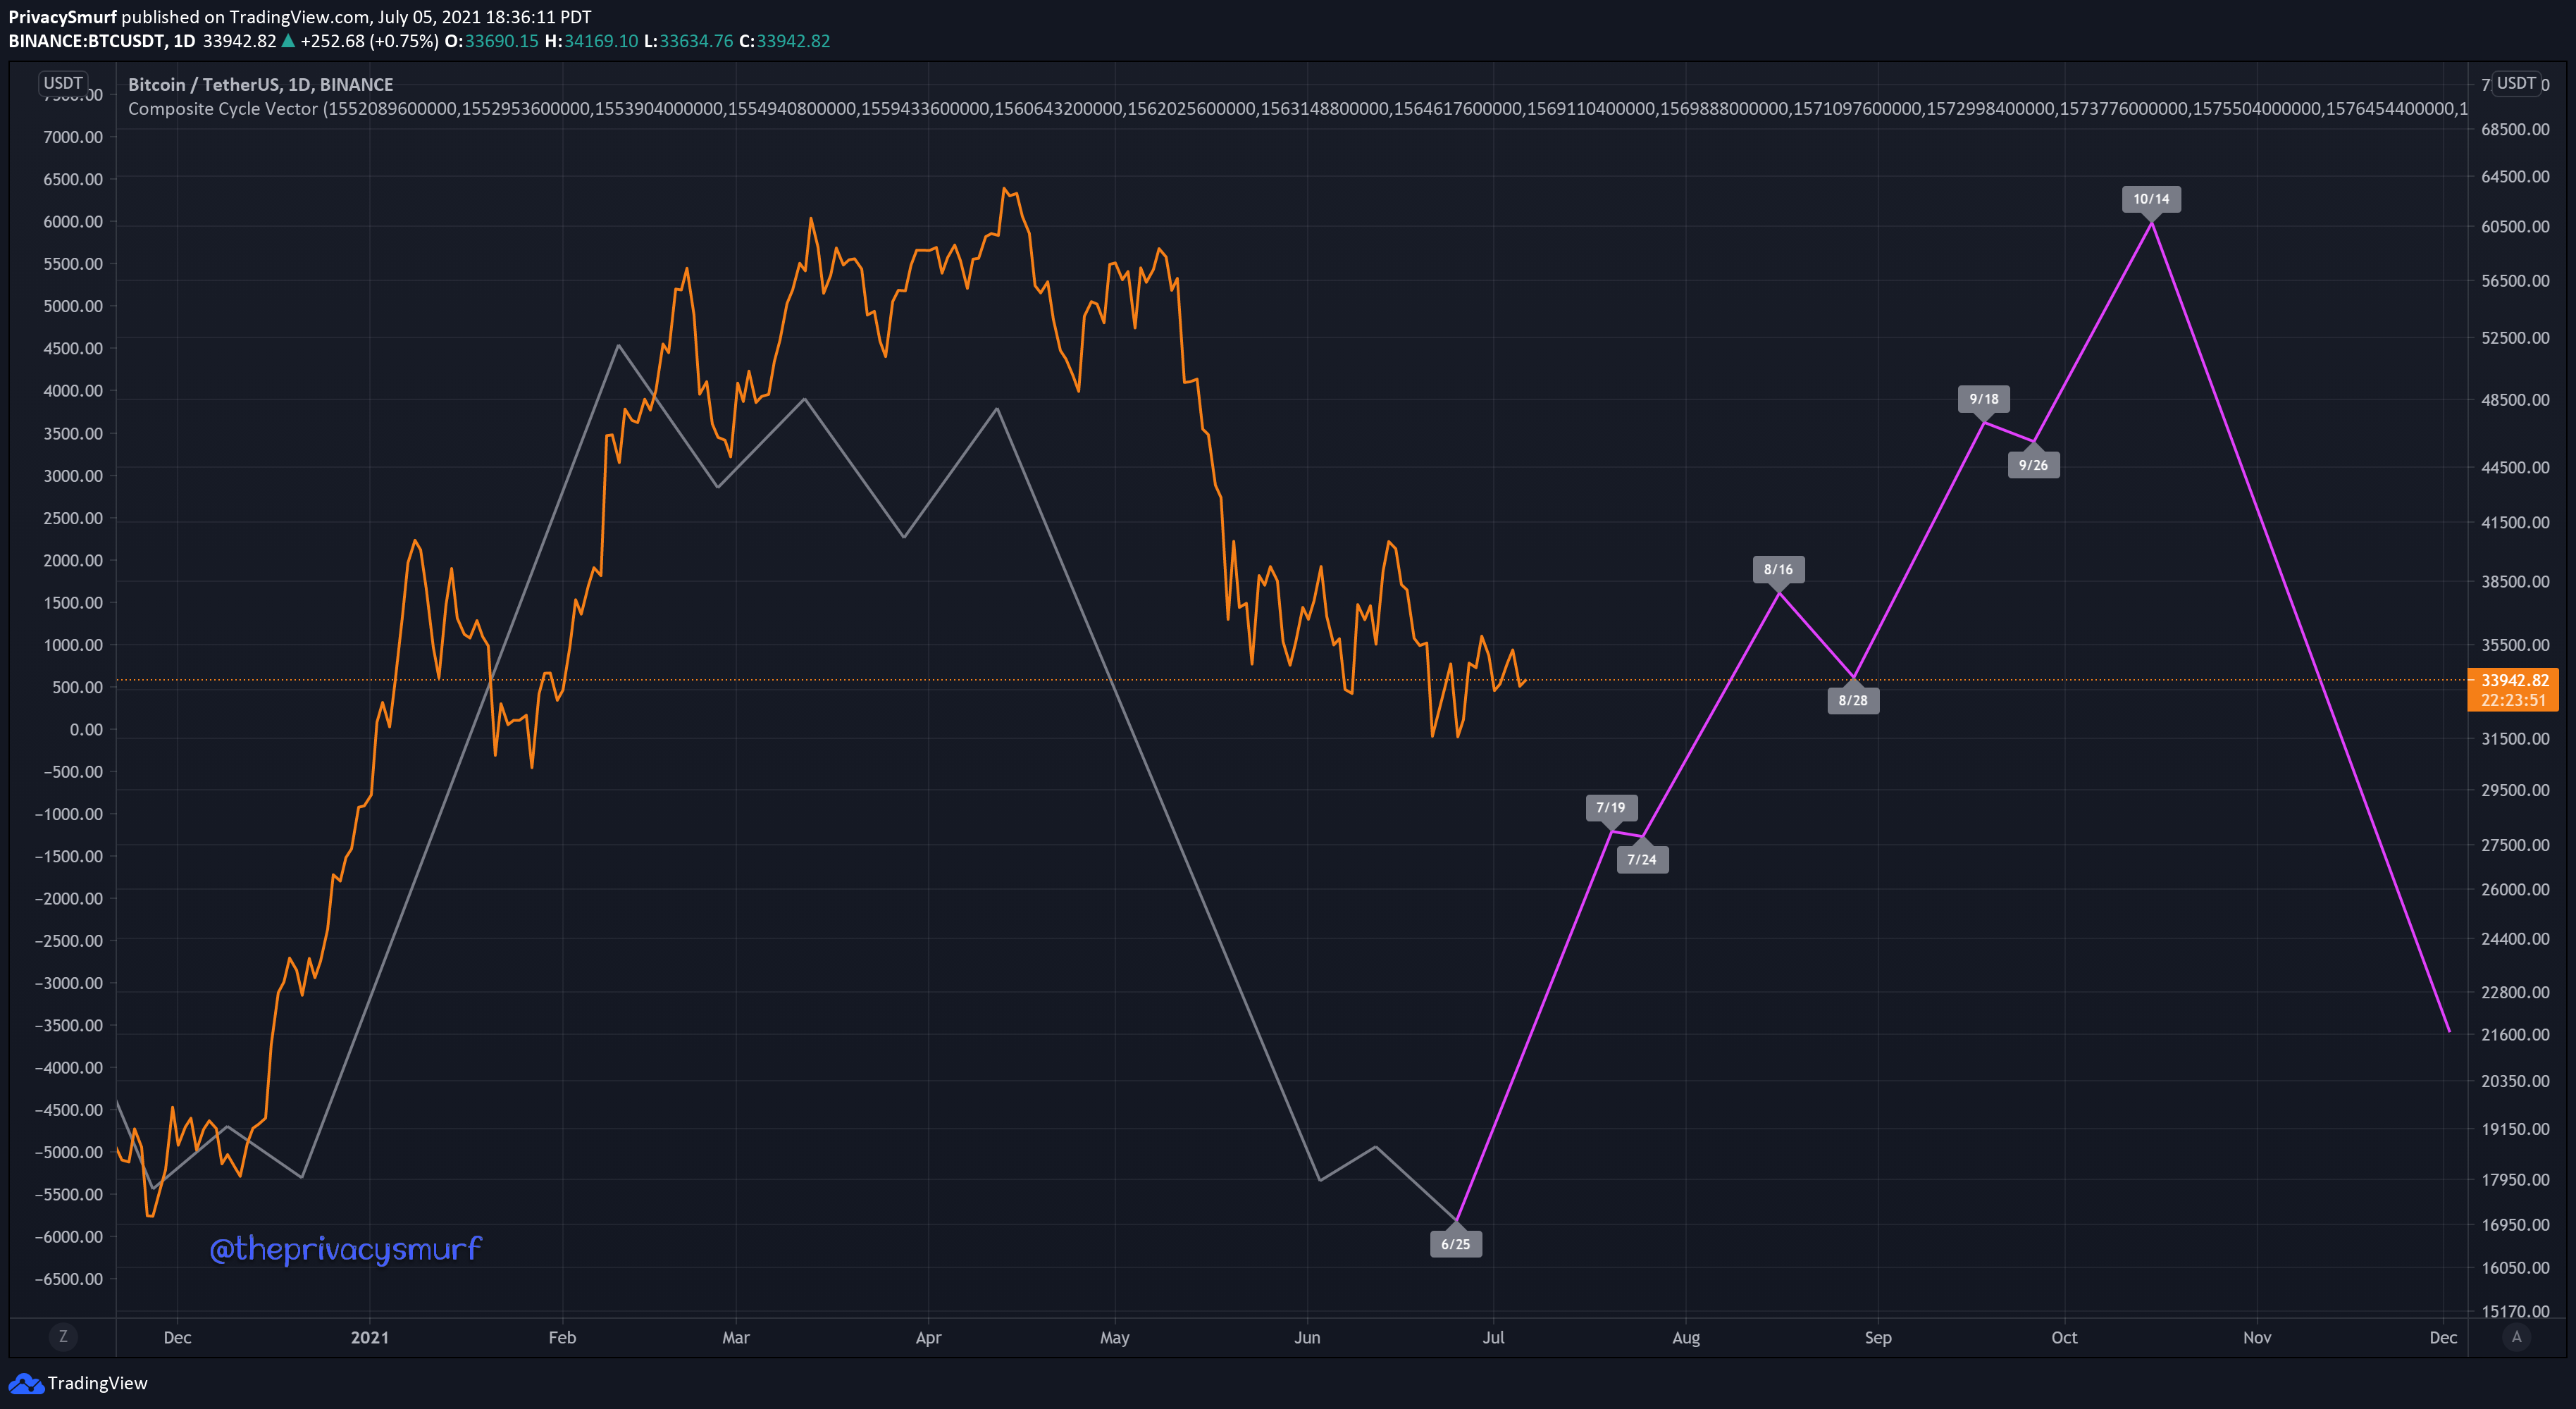
I’ve been doing some extra fiddling to add the cycle data into tradingview. Here’s a quick look at BTC on the daily chart. Remember as I discussed in the cycles post the projection is anchored to the time scale on the bottom. The dates of potential turns in the market are labeled. I’ll update these often because cycles aren’t static and will shift. The dates are useful to get an idea of when to start looking at divergences on the price action oscillators.

There aren’t any clear dominant cycles on ETH right now but there’s still plenty to talk about. The week closed out positive breaking a 3-week downtrend. IT wasn’t a rally enough to be considered bullish yet though. A weekly close above $2711 is still needed. The close at $1982 I anticipate will act as a support as the low dipped below the previous market structure low. Bulls are determined to maintain this price.

The daily chart shows the bearish trend is broken with a series of higher lows and higher high closes. I suspect a period of consolidation will remain though with the 50-Day EMA acting as resistance with added pressure from a descending trendline. The midline of the RSI is currently above the RSI and presents a bearish bias for future prices.

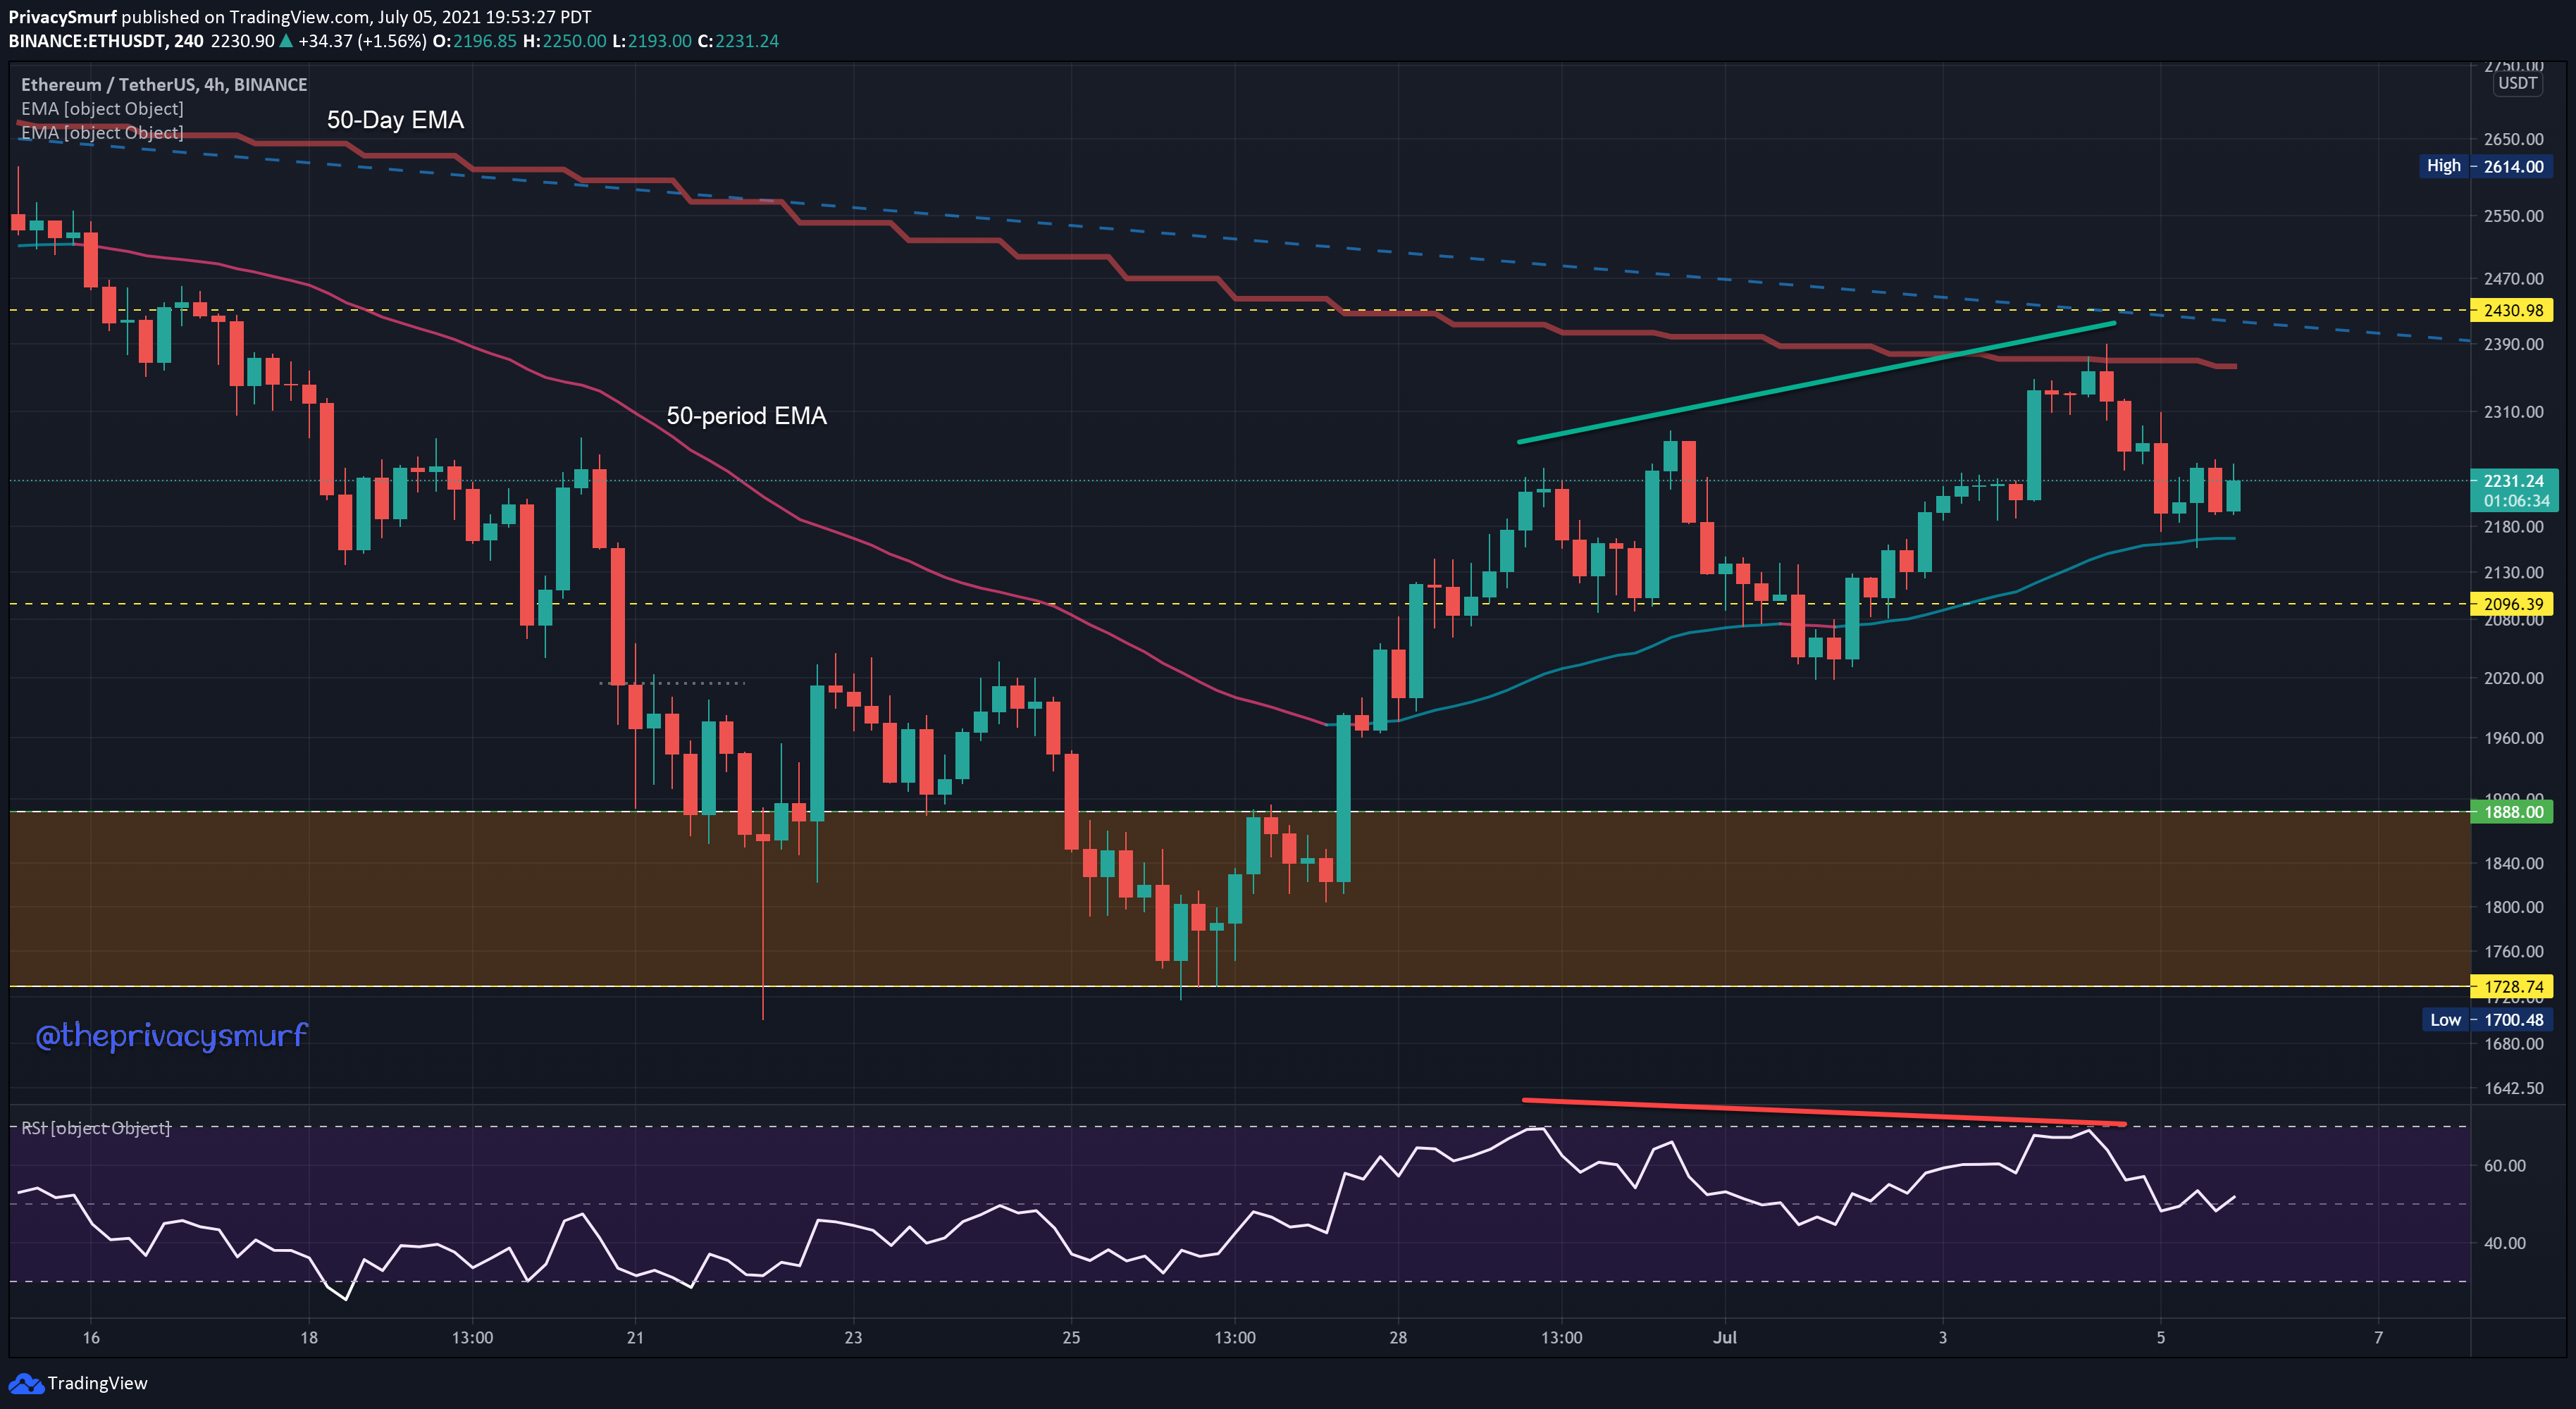
Dropping down the 4HR chart there’s a slight bearish divergence on the RSI with the latest highs in price not being matched with the RSI measurements. The 50-Day EMA and 50-period EMA are currently pinching price and with the bearish divergence and the bearish daily picture I have a bearish bias when it comes to the directionality of price exiting the two EMAs. The support at $2096 may hold up and the price may not get down to $2000 as the bearish divergence is relatively small, but that’s super speculative.

The relative value of ETH to BTC presents an interesting picture. The daily chart looks like a fantastic setup for the future. The chart shows a bullish break of the midline of the RSI, closes above the 50-Day EMA, and testing of resistance around .067 sats. I’d be watching for a test of the 50-Day EMA and potentially the .0604 sat support to look for long positions and buying ETH as it would be increasing in value over BTC, but the cycle picture presents an interesting wrinkle.

Here’s the dominant cycle forecast of ETH/BTC.

Now here’s the dominant cycle forecast of Altcoin Dominance.
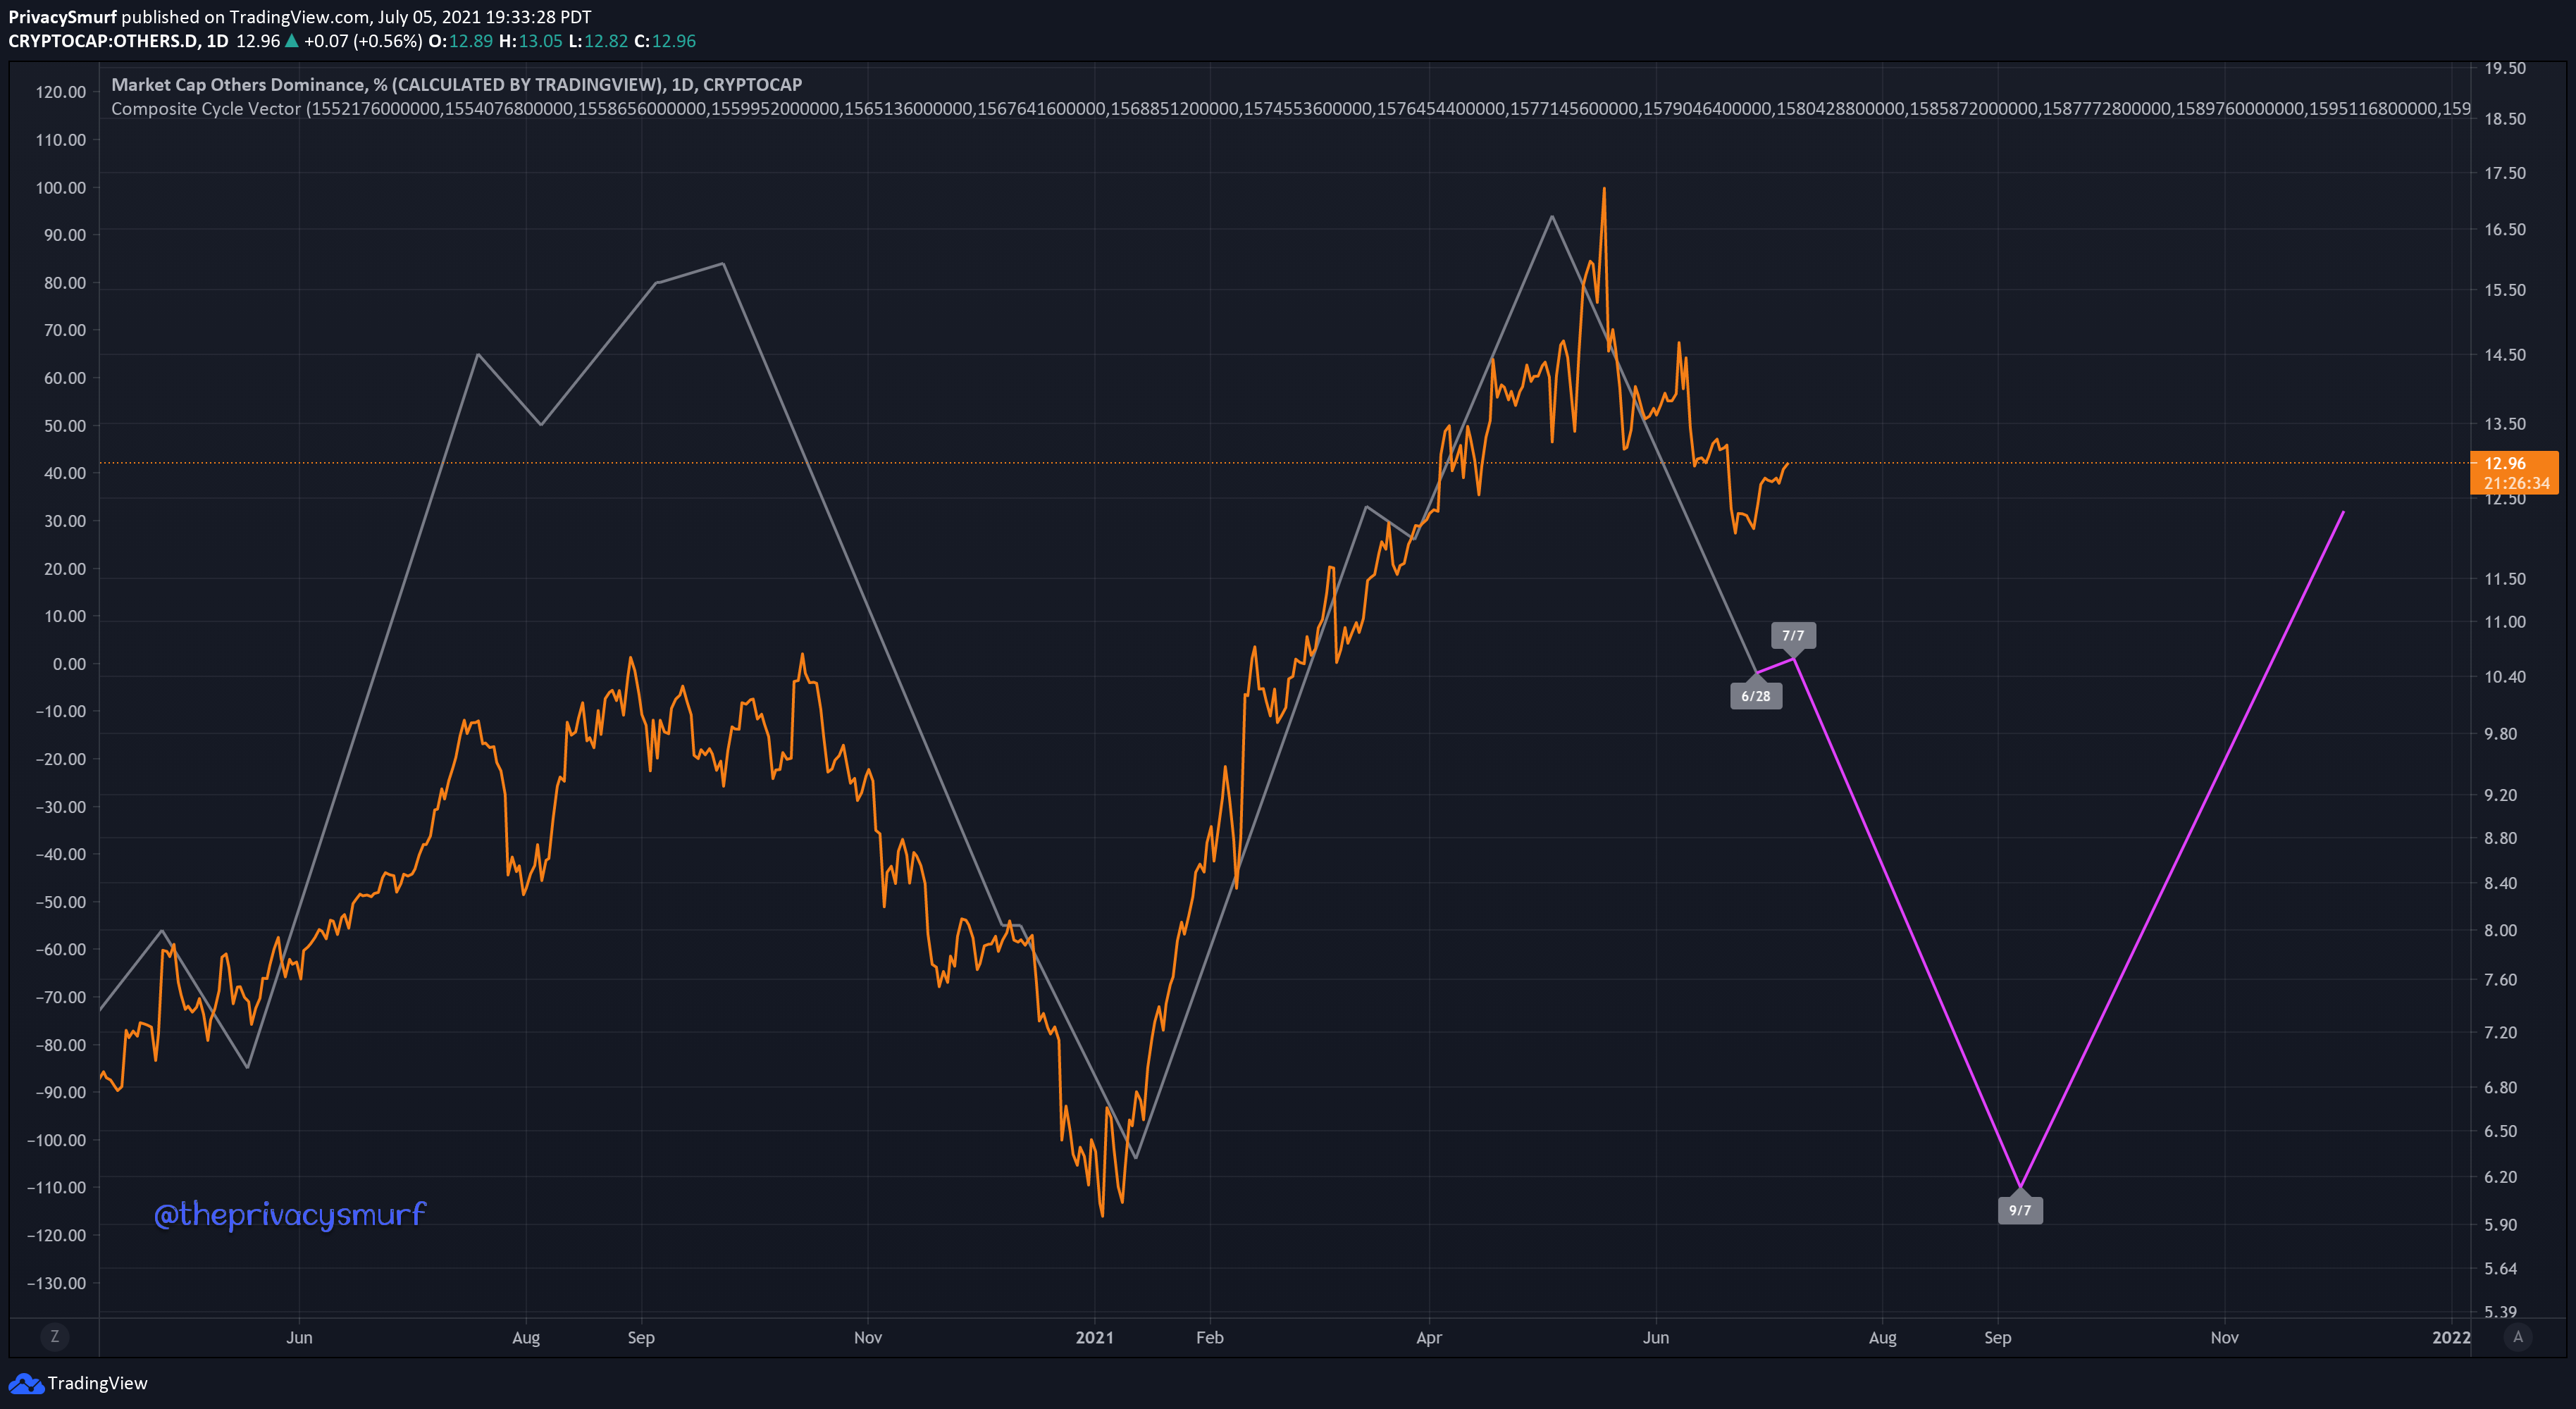
Looking at the top ETH/BTC chart, in my head playing out this potential test of support in the next few days would also coincide with the current peak and decline with the cycle forecast. Both cycles then continue into a longer-term downtrend. While cycle downtrends don’t always mean bearish prices this test of support on ETH/BTC must be watched closely as larger forces may be pushing it down despite this juicy setup. Also, one thing to note is the relationship of ETH/BTC and Altcoin Dominance. The flow of money in space will have Ethereum gaining in value first followed by the increase in value of other altcoins. This is also reflected in the lag of the cycles with ETH/BTC acting first on the rally at the end of the downtrend.
Thanks for putting up with the garbage memes and another late post.
@theprivacysmurf