

Sunday Synopsis #50: Belize
Sunday Synopsis #50: Belize
Even Black Thought says you should 'see the Synopsis'

I enjoy every iteration of Danger Mouse. Team, cartoon, artist.
BTC/USDT Weekly Structure
https://www.tradingview.com/chart/4v8qizyI/

This past week BTC closed bullish. There are no changes with the long-term picture. With no new lower low, the fib retracement from the highest high of the last ‘Confirmed Market Structure’ resistance remains at the last lowest low at $17622. Since the last posting, there has been no lower low close past $19315, so it remains the ‘Unconfirmed Structure.’ If prices increase from here with a close above $29298, this will confirm the structure as support. The weekly market structure trend is still bearish.
From a long-term investing perspective, there are no moves to be made (for the HODL bags) since the ‘meaningful retracement’ at $18185 from Dec 2021 was been hit and the DCA order was filled. The next lower buy location for me is at $10256 (it is in no way an attempt to time the market or call a bottom but is a location of value). Given current technicals, I don’t expect that to hit soon, but I have a DCA order. From a long-term trading perspective, a buy order (for selling at the next cycle peak) won’t be taken by me for this timeframe until the market shifts back to bullishness. I want to buy strength, not weakness.
BTC/USDT Daily Chart
https://www.tradingview.com/chart/jjSdFW4b/
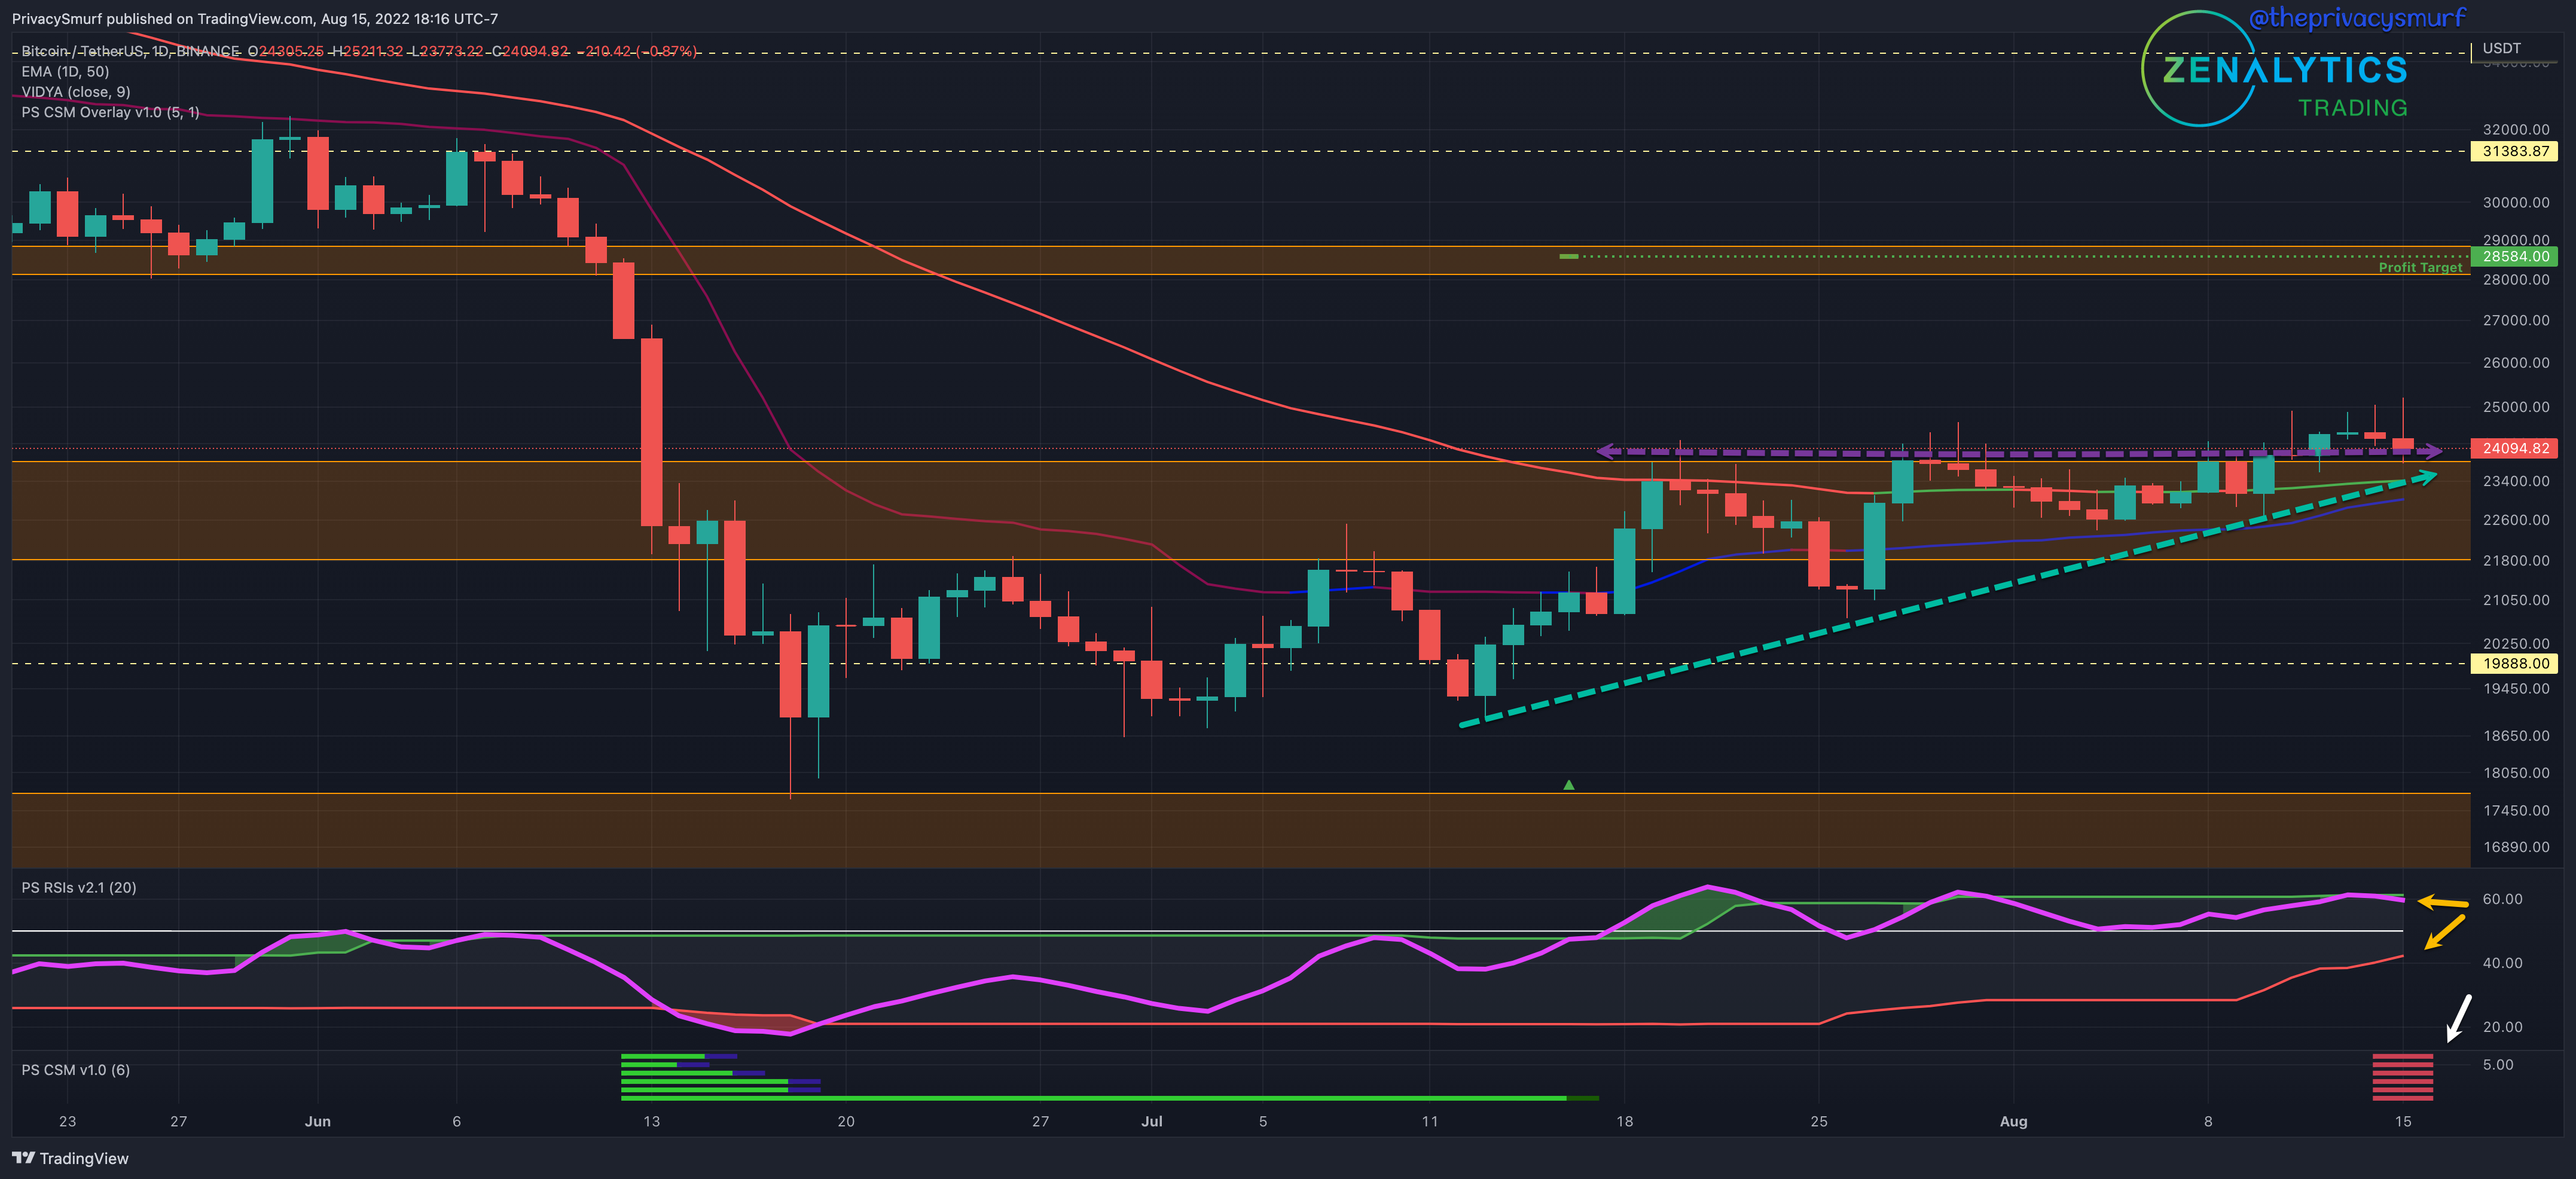
From last week:
“…I’d expect it to be a break to the upside… not a lot of momentum with BTC at the moment.
We did see a bullish breakout from the wedge, but momentum was lacking. Prices are testing the top of the wedge now for support. There is still a bullish influence on prices as the RSI is above the midline, but it has also crossed back under the adaptive top band (top yellow arrow on RSI). This would signal potential exhaustion from the bullish volatility and possibly the establishment of a new range with $25k being the ceiling. If the RSI continues its descent and crosses the midline down and under the bottom adaptive band, this would likely be accompanied by a volatile decline. My custom indicator, the Correction Strength Meter (white arrow), is plotting red on all the oscillators signifying the potential for a bearish reversal as the oscillators diverge from price action. There have been new highs in prices but lower highs on price action oscillators. This gives additional weight to the idea of a bearish break from this wedge. The bullish structure that has been building over the last weeks will start to turn once daily closes come in below $22.6k. If that comes to pass, I’d expect some support around the $21k area. I don’t think the daily bullish trend is ending yet, but I’d consider taking profits on positions from July, given the conditions. There may be an opportunity shortly to buy back into the trend for a swing. Something to watch on intraday timeframes is for bullish divergences when prices start to retrace. If those bullish reversal trade setups trigger, it may provide the timing to get back into the move.
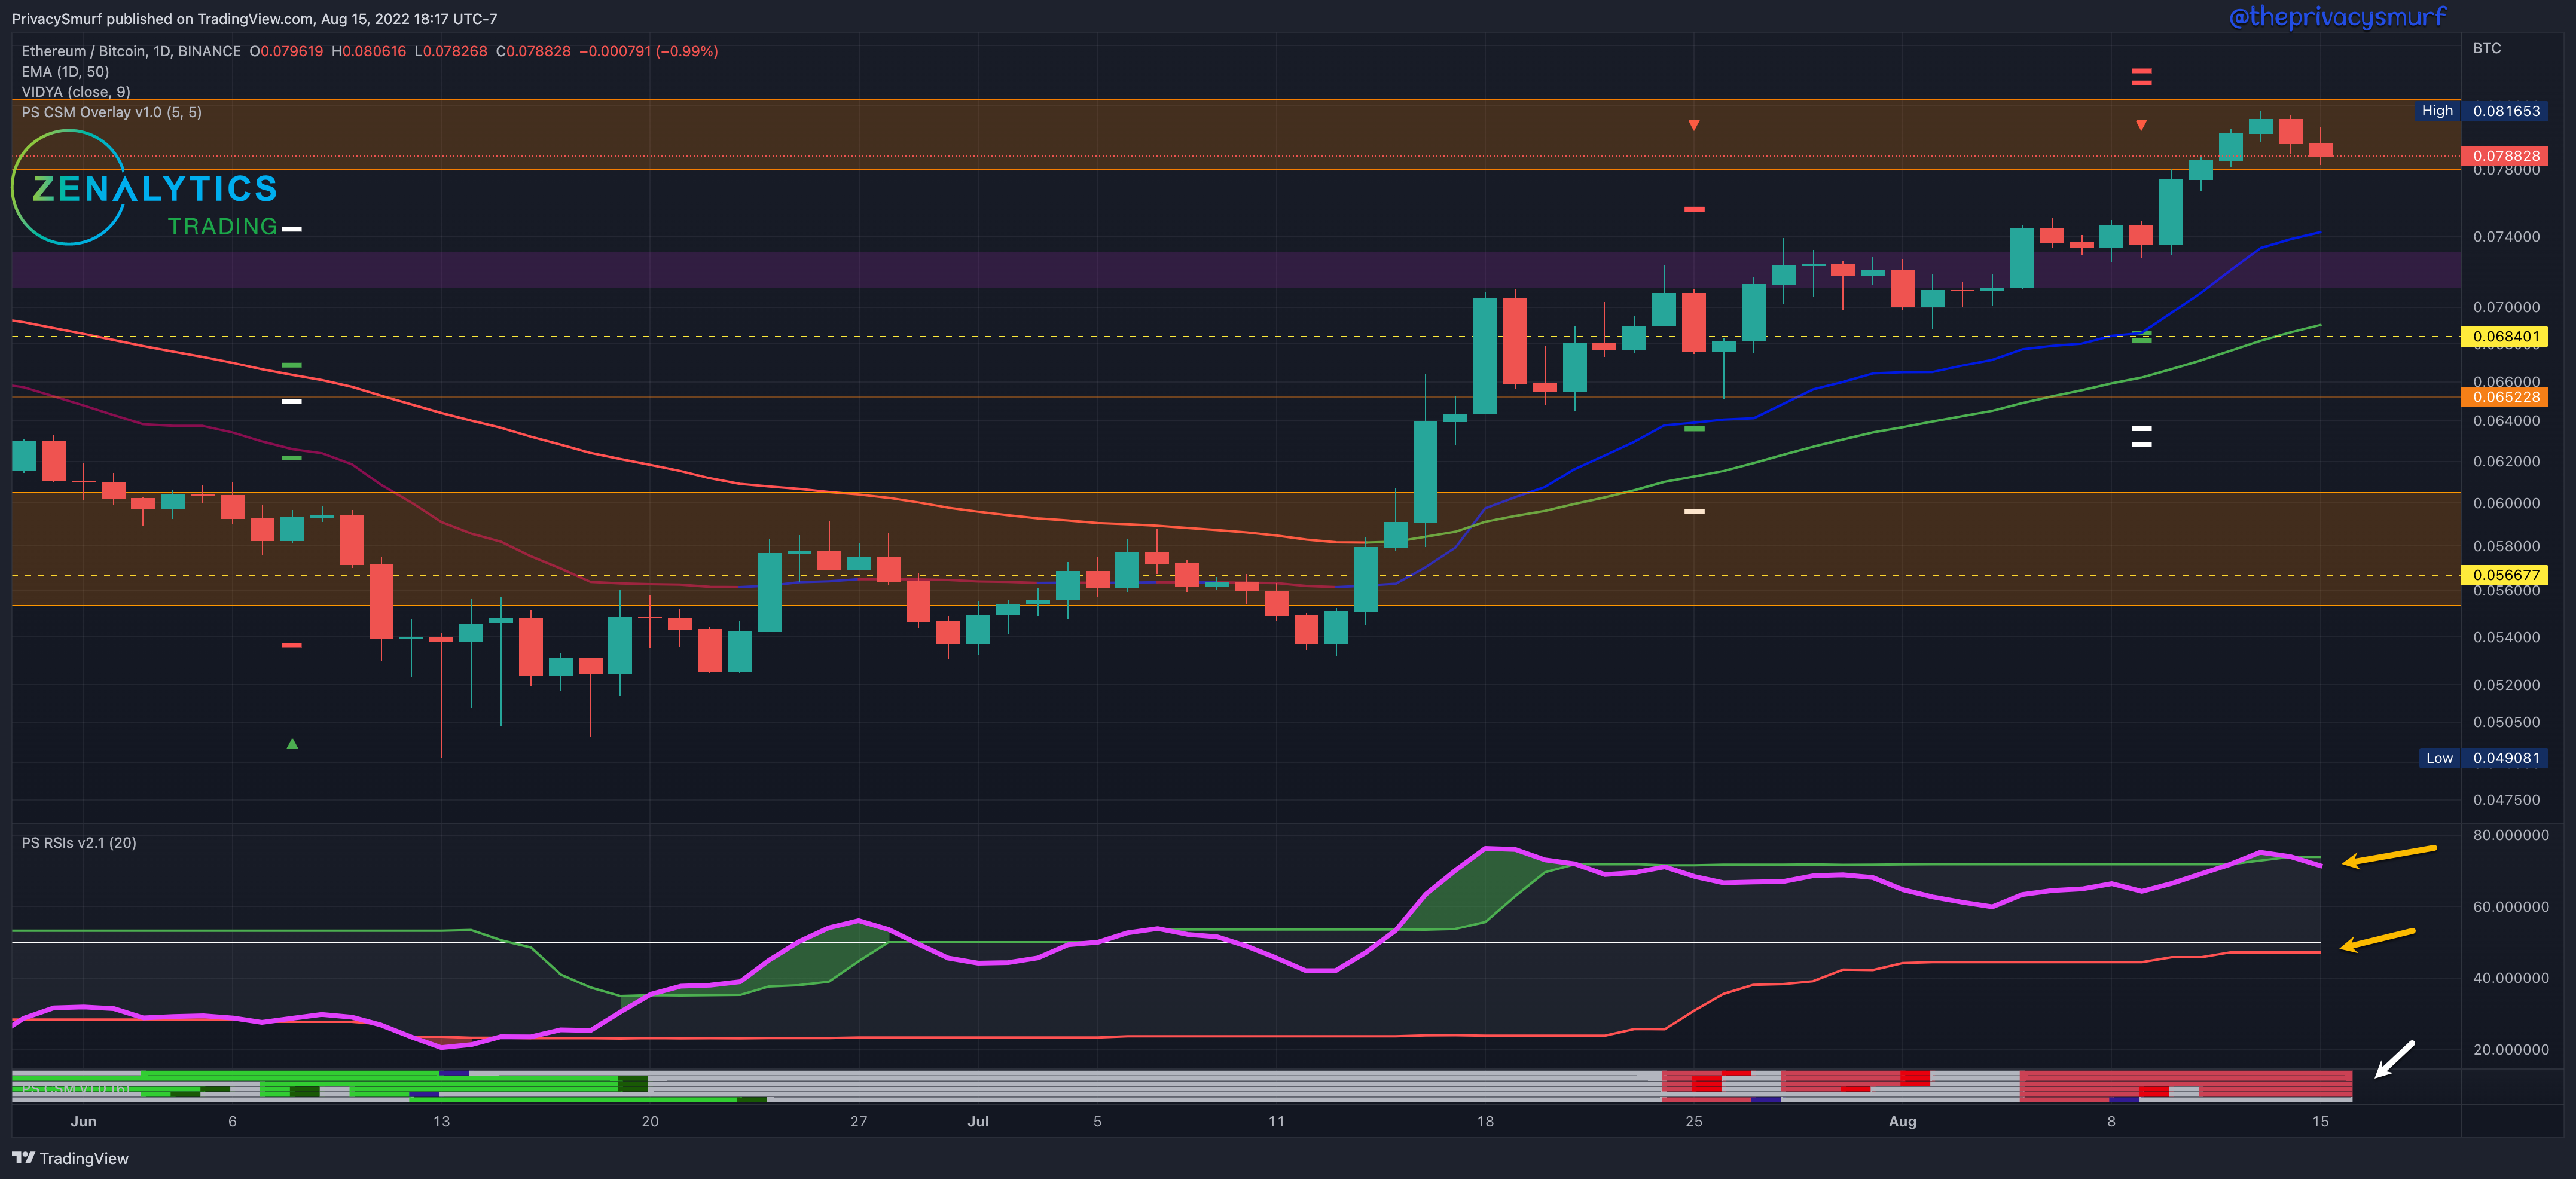
Q3 Forecast Update
Last month, I provided some projections in the Q3 Forecast, and it’s still on track. I covered the relationship between BTC and ETH. The daily cycle forecasted a bottom in mid to late June; a screenshot from the forecast is shown below.

Purchasing some ETH with BTC would have been a very lucrative position, with ETH gaining over 40% on BTC in that time. Below we see the daily cycle shifting to a downward leg and topping out. Bearish divergences on this chart, if they appear, would signal to me to rotate my ETH back to the BTC to secure those profits. Note that the daily cycle (yellow) aligns with the weekly cycle (blue). This often will translate to a stronger bearish influence on price and/or consolidation, some sort of break from the bullish trend
.This can mean a few different things:
BTC takes a bullish leap and gains on ETH.
BTC and ETH stay flat together.
BTC goes down, and ETH goes down more.
It’s difficult to say which it will be by looking at this chart alone, but if you monitor the BTC and ETH charts together, they will give you an idea of what to expect.
Here’s that forecast in case you missed it.

ETH/BTC Weekly Structure
https://www.tradingview.com/chart/sacHlXOv/
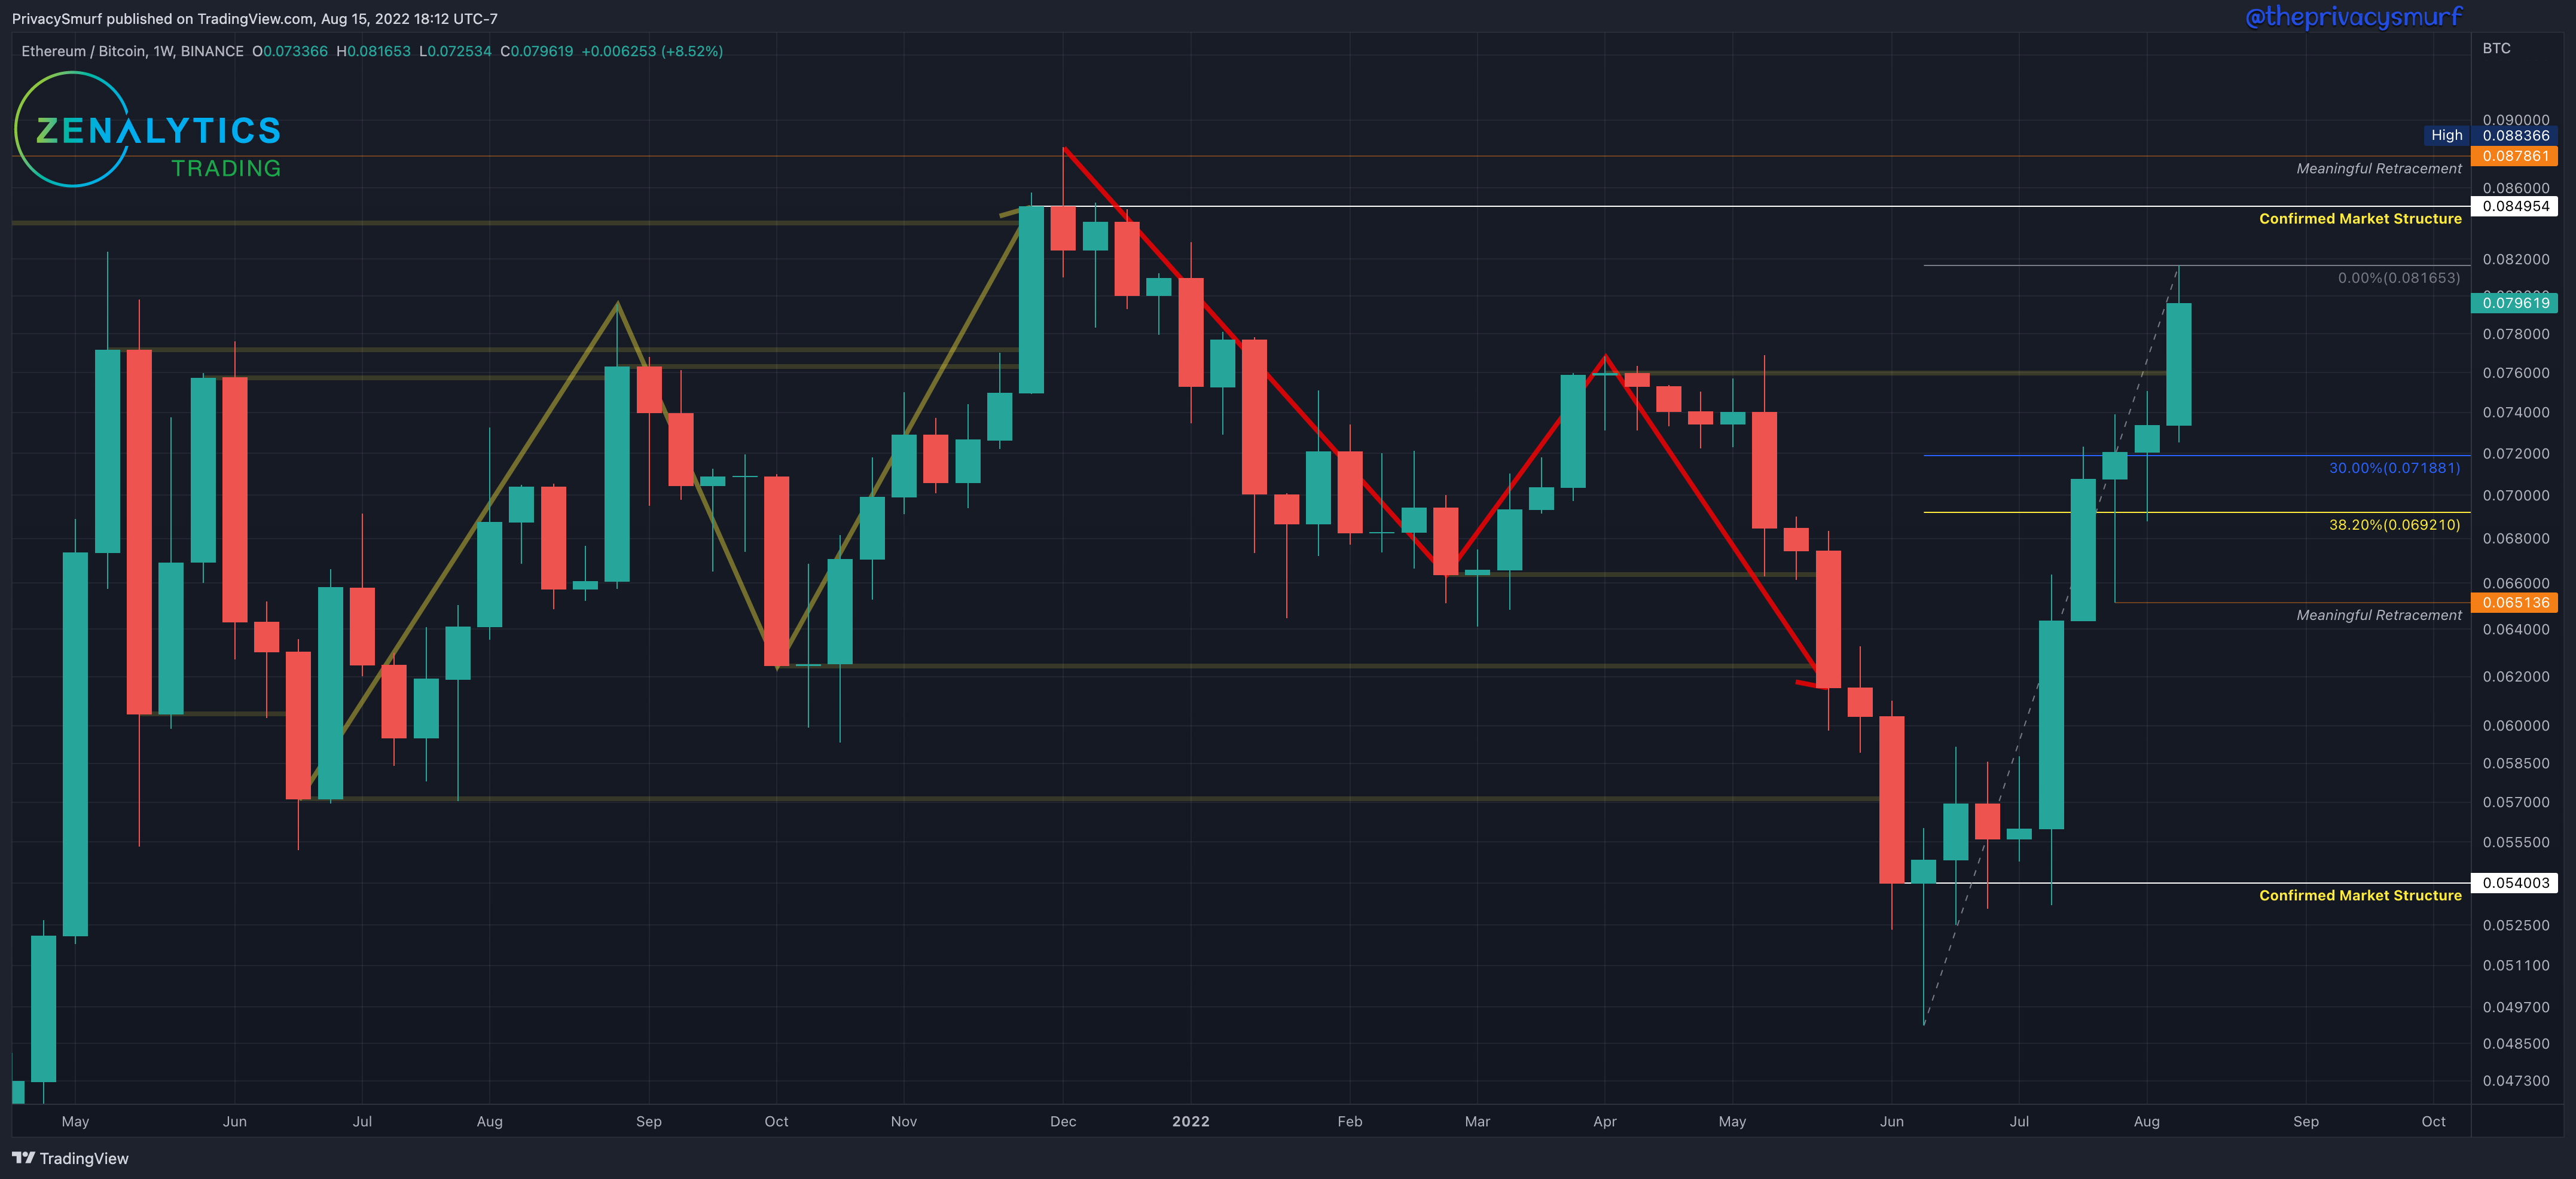
This past week closed bullish again, with ETH gaining heavily on BTC. Since the last posting, there has been a new higher high, so the high anchor of the fib tool extends to the new highest high at 0.081653. If prices decrease from here for two weeks with a close below 0.06921, this will confirm the highest close as market structure resistance. The weekly market structure trend is still bearish despite this bullish price action. If a weekly close comes in above the Confirmed Market Structure resistance at 0.084954, this would be the second resistance broken without any higher low closes, and I would consider the trend bullish. I'm applying this arbitrary yet objective rule to this method to cover instances where there is no zig-zag move of higher highs and higher low pivot points.
From a mid-term trading perspective, the trend is down, and I don’t want to be buying into a bearish trend but considering that we have established a new higher high close, I’m watching on a retracement to consider frontrunning the trend and buying the potential bounce from the incoming higher low. This potential retracement may be what is forecasted in the cyclical trends above. I’d be looking for a potentially risky entry anywhere from 0.066 to 0.074. Any bullish divergence signals on higher intraday timeframes or swing entries in that range may be a great place to buy for the next leg up or at least into the test of the high structure resistance.
From a long-term investing perspective, I expect that if we fall and lose value in the ETH/BTC relationship, the new structure at just under 0.054 ultimately acts as support. I don't have a long-term DCA buy order there at the moment. If we confirm the structure above it, I will add an order at 0.054 again (it is in no way an attempt to time the market or call a bottom, it is a location of value as shown by the amount of buying activity there). Given current technicals, **I don’t expect that to be hit in the near term.
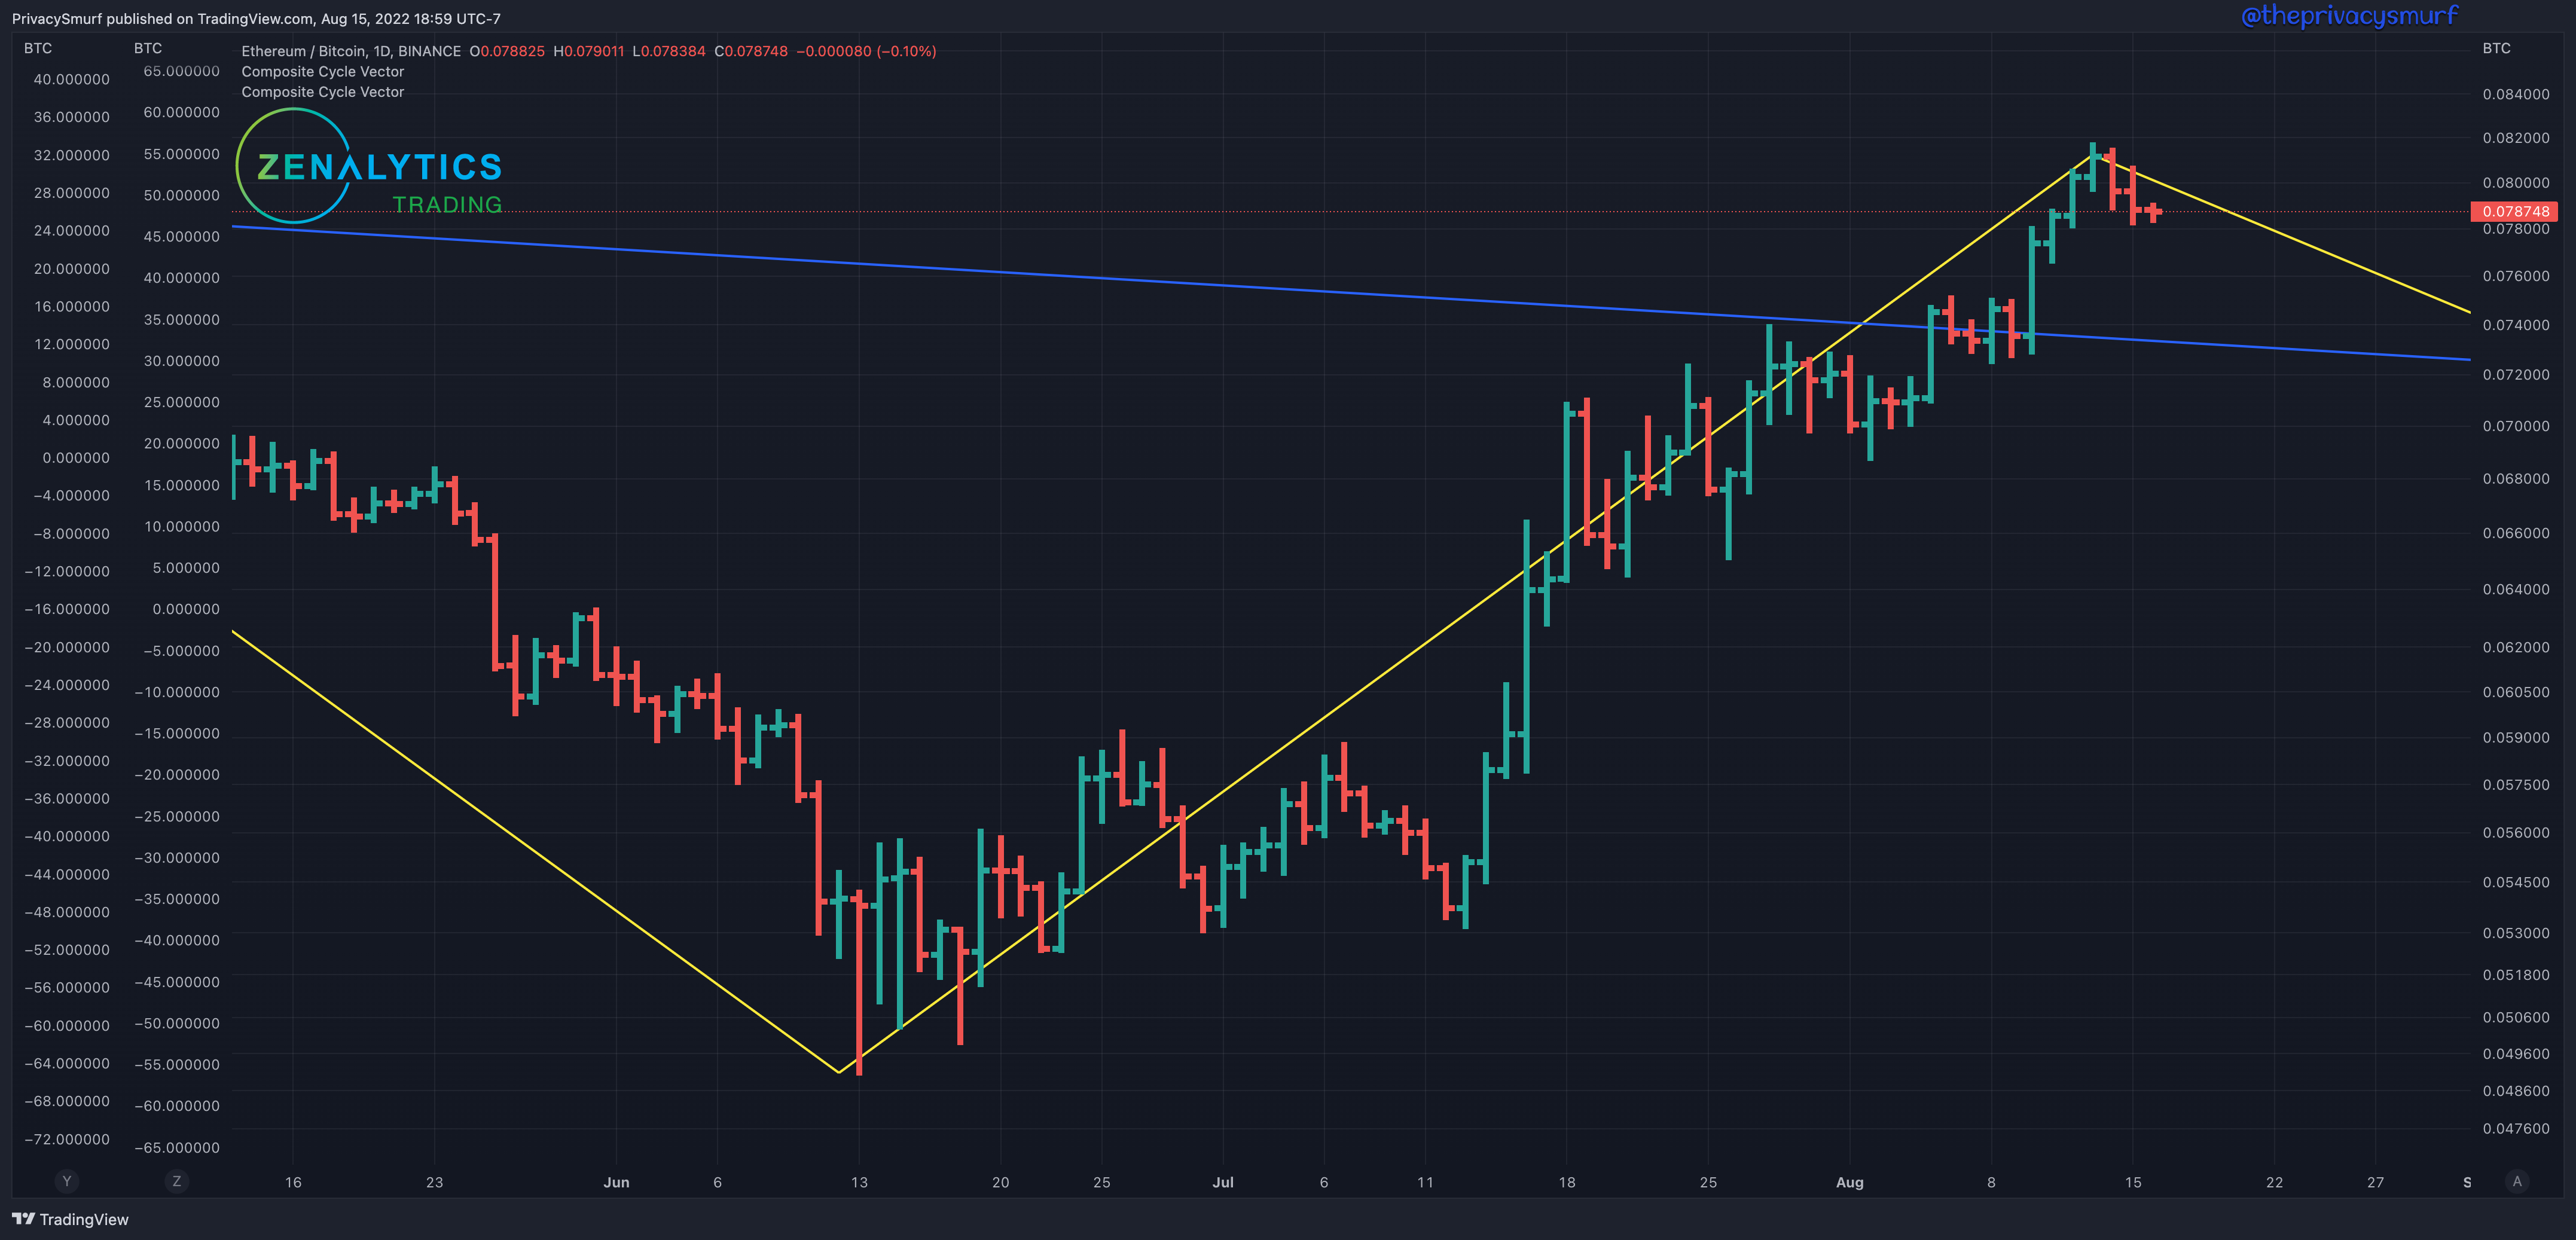
ETH/BTC Daily Chart
https://www.tradingview.com/chart/gTkSjkj6/
From last week:
I’d still keep the next level of resistance at the highs of this chart around 0.078 if an exuberant bullish break does come through… still time for ETH/BTC to keep gaining but the risk of downside is also increasing.
We have many of the same elements in existence this week. The RSI did increase during the week(yellow arrow) but failed to set a new higher high maintaining the bearish divergences. There remain multiple bearish trade signals from my custom indicator the Correction Strength Meter (white arrows at the bottom of the chart). The bottom adaptive band of the RSI continues up towards the midline which supports the possibility of volatile bearish price action if the RSI breaks it to the downside. It’s only a matter of time for the retracement and may be what is forecasted in the cyclical trends above. I’d expect support to come in above the bearish targets plotted from the Correction Strength Meter, around 0.068. I’d be wary of any bounce from the zone around 0.072, but the price may hang up there as there is plenty of historical resistance there before the recent bullish breakout. Now is the time to be cautious of ETH relative to BTC.
If, for some reason, ETH breaks the high ceiling and invalidates the bearish divergences, then a risky breakout trade may be warranted, but that’s not presented in the technicals at the moment.
ETH/USDT Weekly Structure
https://www.tradingview.com/chart/JPTp0aXw/
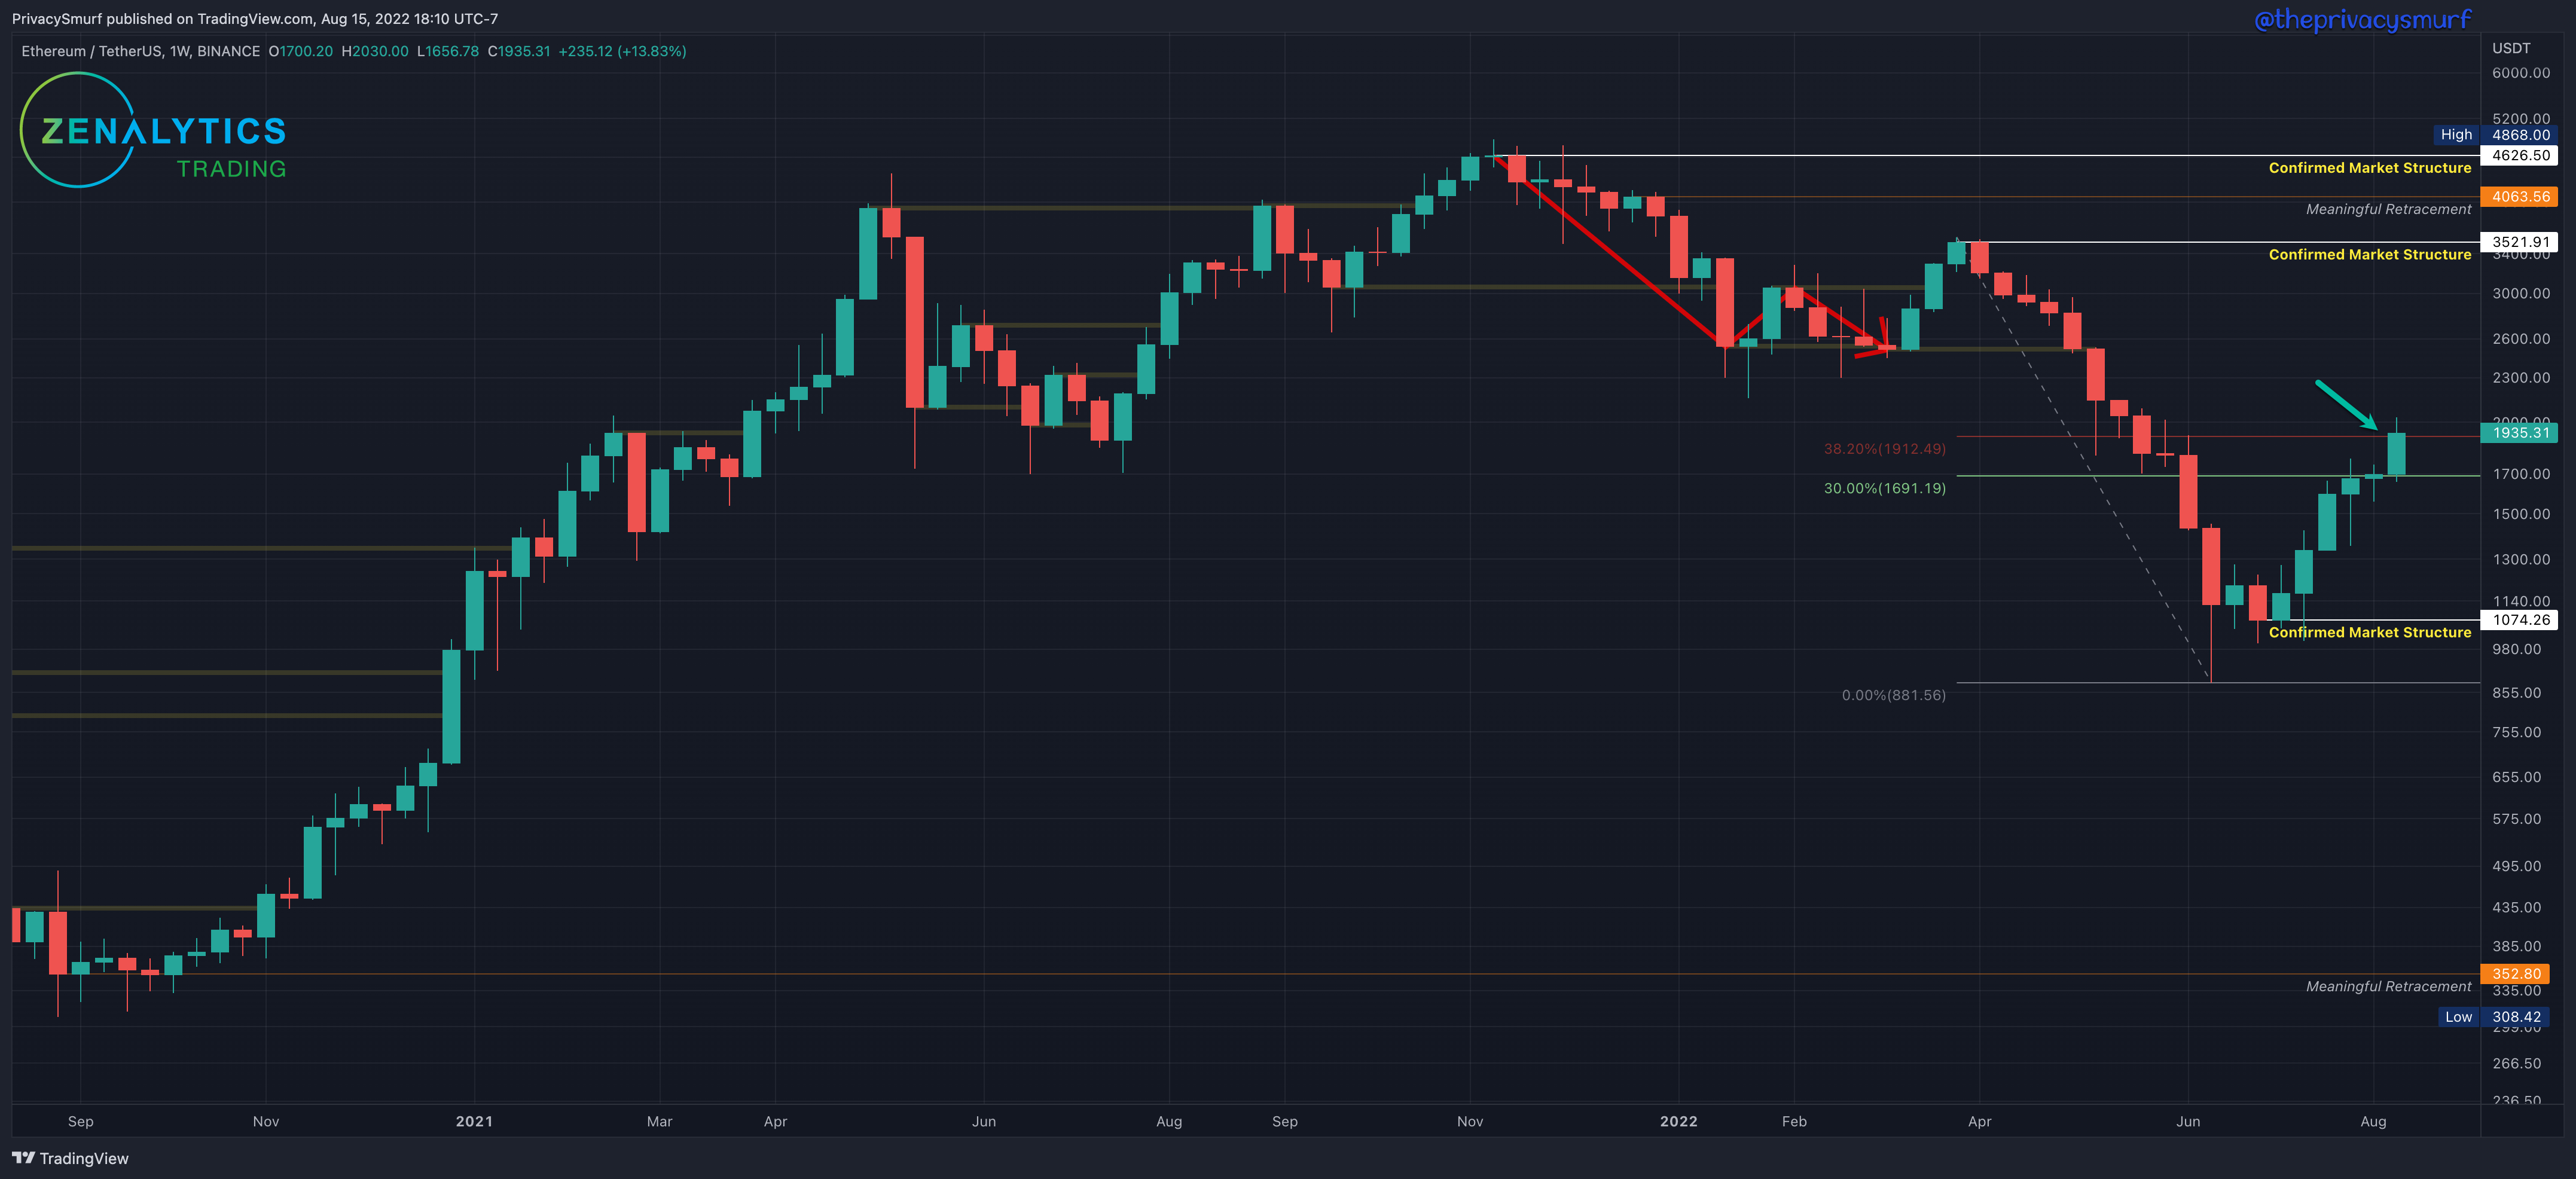
ETH closed bullish this past week and closed above the 38.2% retracement point from the lowest low at $881. This confirms the lowest close at $1074 as Market Structure support. Now we shift the fib retracement anchor to measure from the lowest low of the downward left to the most recent highest high. This can be seen below.
Anchored from the lowest low to the highest high at $1935, prices must decrease for 2 weeks and close below $1591 to confirm a market structure resistance.
From a long-term investing perspective, there are no moves to be made (for the HODL bags) since the ‘meaningful retracement’ at $1232 from Jan 2021 was hit, and the DCA order was filled. The next lower buy location for me is at the broken structure at $800 from 2021 (it is in no way an attempt to time the market or call a bottom but is a location of value) and $352. Given current technicals, I don’t expect that to hit soon, but I have DCA orders there. If structure support is confirmed above $1074 I will place a new DCA order at $1074.
From a long-term trading perspective, a buy order (for selling at the next cycle peak) won’t be taken by me for this timeframe until the market shifts back to bullishness. This is a tough call to make as that will require many weeks of waiting while potentially missing much of a move. I’ve discussed above how I’d navigate taking a position in ETH, given there are no great signals here yet.
ETH/USDT Daily Chart
https://www.tradingview.com/chart/xbB6lkZu/
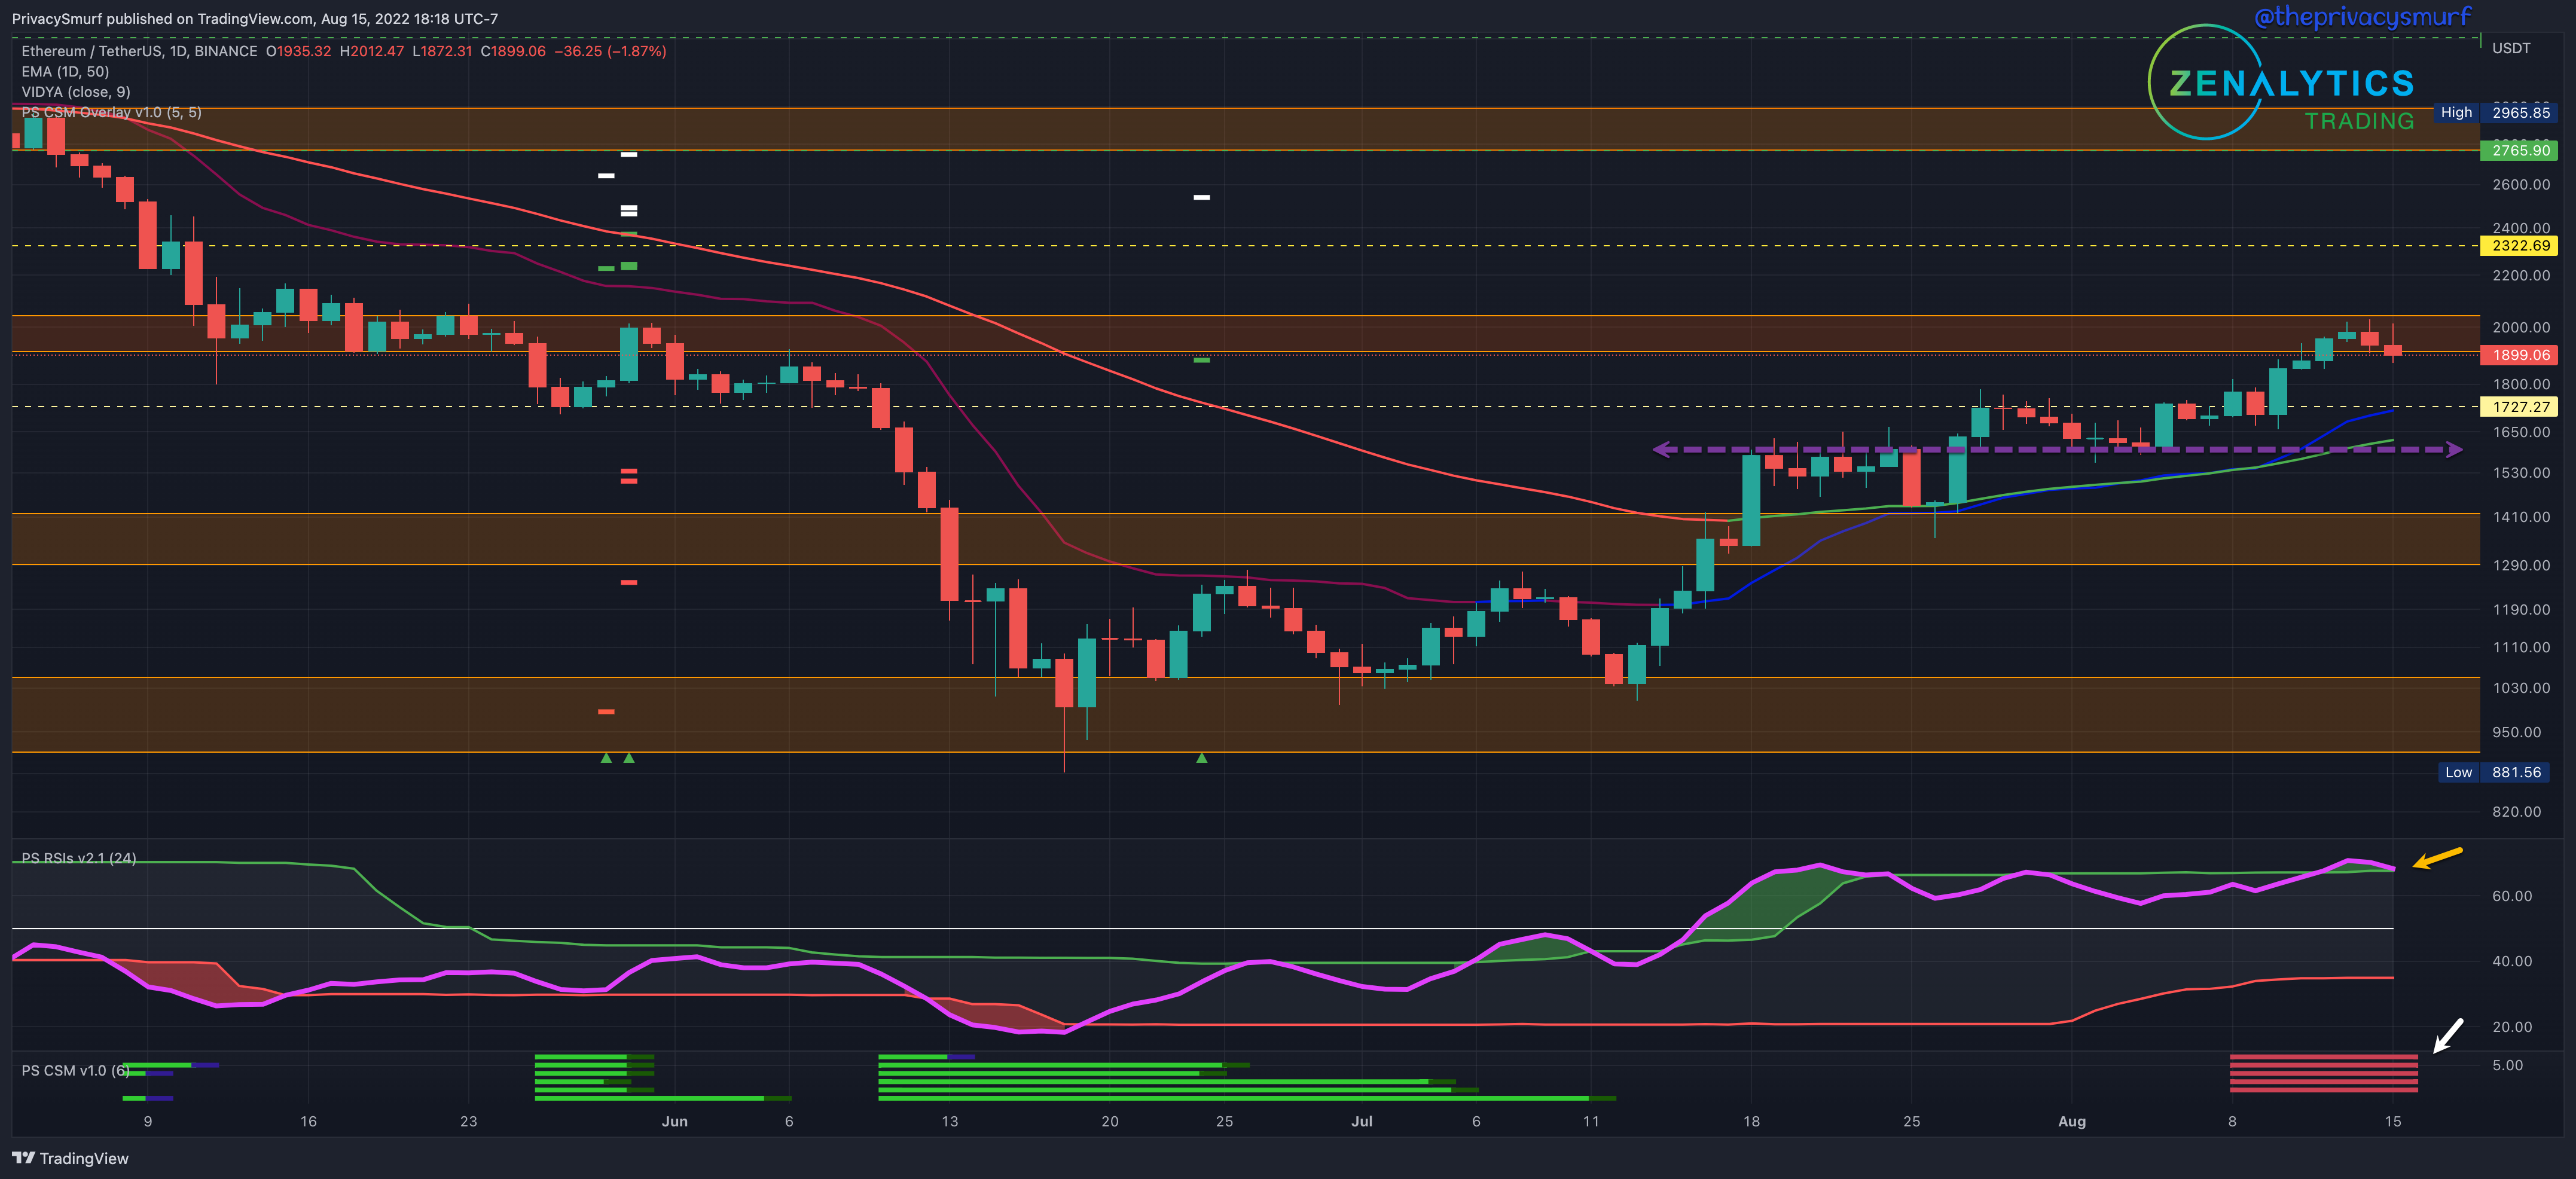
From last week:
Price…consolidating in a wedge... expect it to be a break to the upside… breaking up to a new high will throw the chart into bearish divergence… break this week would likely hit the profit target plotted by my indicator, the CSM, signaled back in late June.
Last week’s synopsis was on point in all regards. ETH hit the first profit target, the high ceiling has held as resistance, and the CSM is plotting bearish divergences at the bottom of the chart with all the red bars(white arrow). The RSI (yellow arrow) is curling back into the top band, which signals potential exhaustion from the bullish volatility and possibly establishing a new range with the current ceiling holding. The bottom band of the RSI still has some room to go before it is up near the midline, so I’m not expecting a lot of downside volatility at the moment. The bullish structure that has been building over the last weeks will start to turn once daily closes come in below $1600. If that comes to pass, I’d expect some support around the $1400 area. I don’t think the daily bullish trend is ending yet, but I’d consider taking profits on positions from July, given the conditions. There may be an opportunity shortly to buy back into the trend for a swing. Something to watch on intraday timeframes is for bullish divergences when prices start to retrace. If those bullish reversal trade setups trigger, it may provide the timing to get back into the move.
I got a little tied up with dog sitting and didn't have my computer with me to finish up my work on the trading journal or post yesterday, but I’ll get that posted this week. Have a good one.
@theprivacysmurf