

Sunday Synopsis #51: No one loves me and neither do I
Sunday Synopsis #51: No one loves me and neither do I
But you will.

I don’t feel good about missing so many posts, but it’s all for a reason. Besides, there wasn't anything good to say anyways. :-p Hope you come to understand.
BTC/USDT Weekly Structure
https://www.tradingview.com/chart/4v8qizyI/
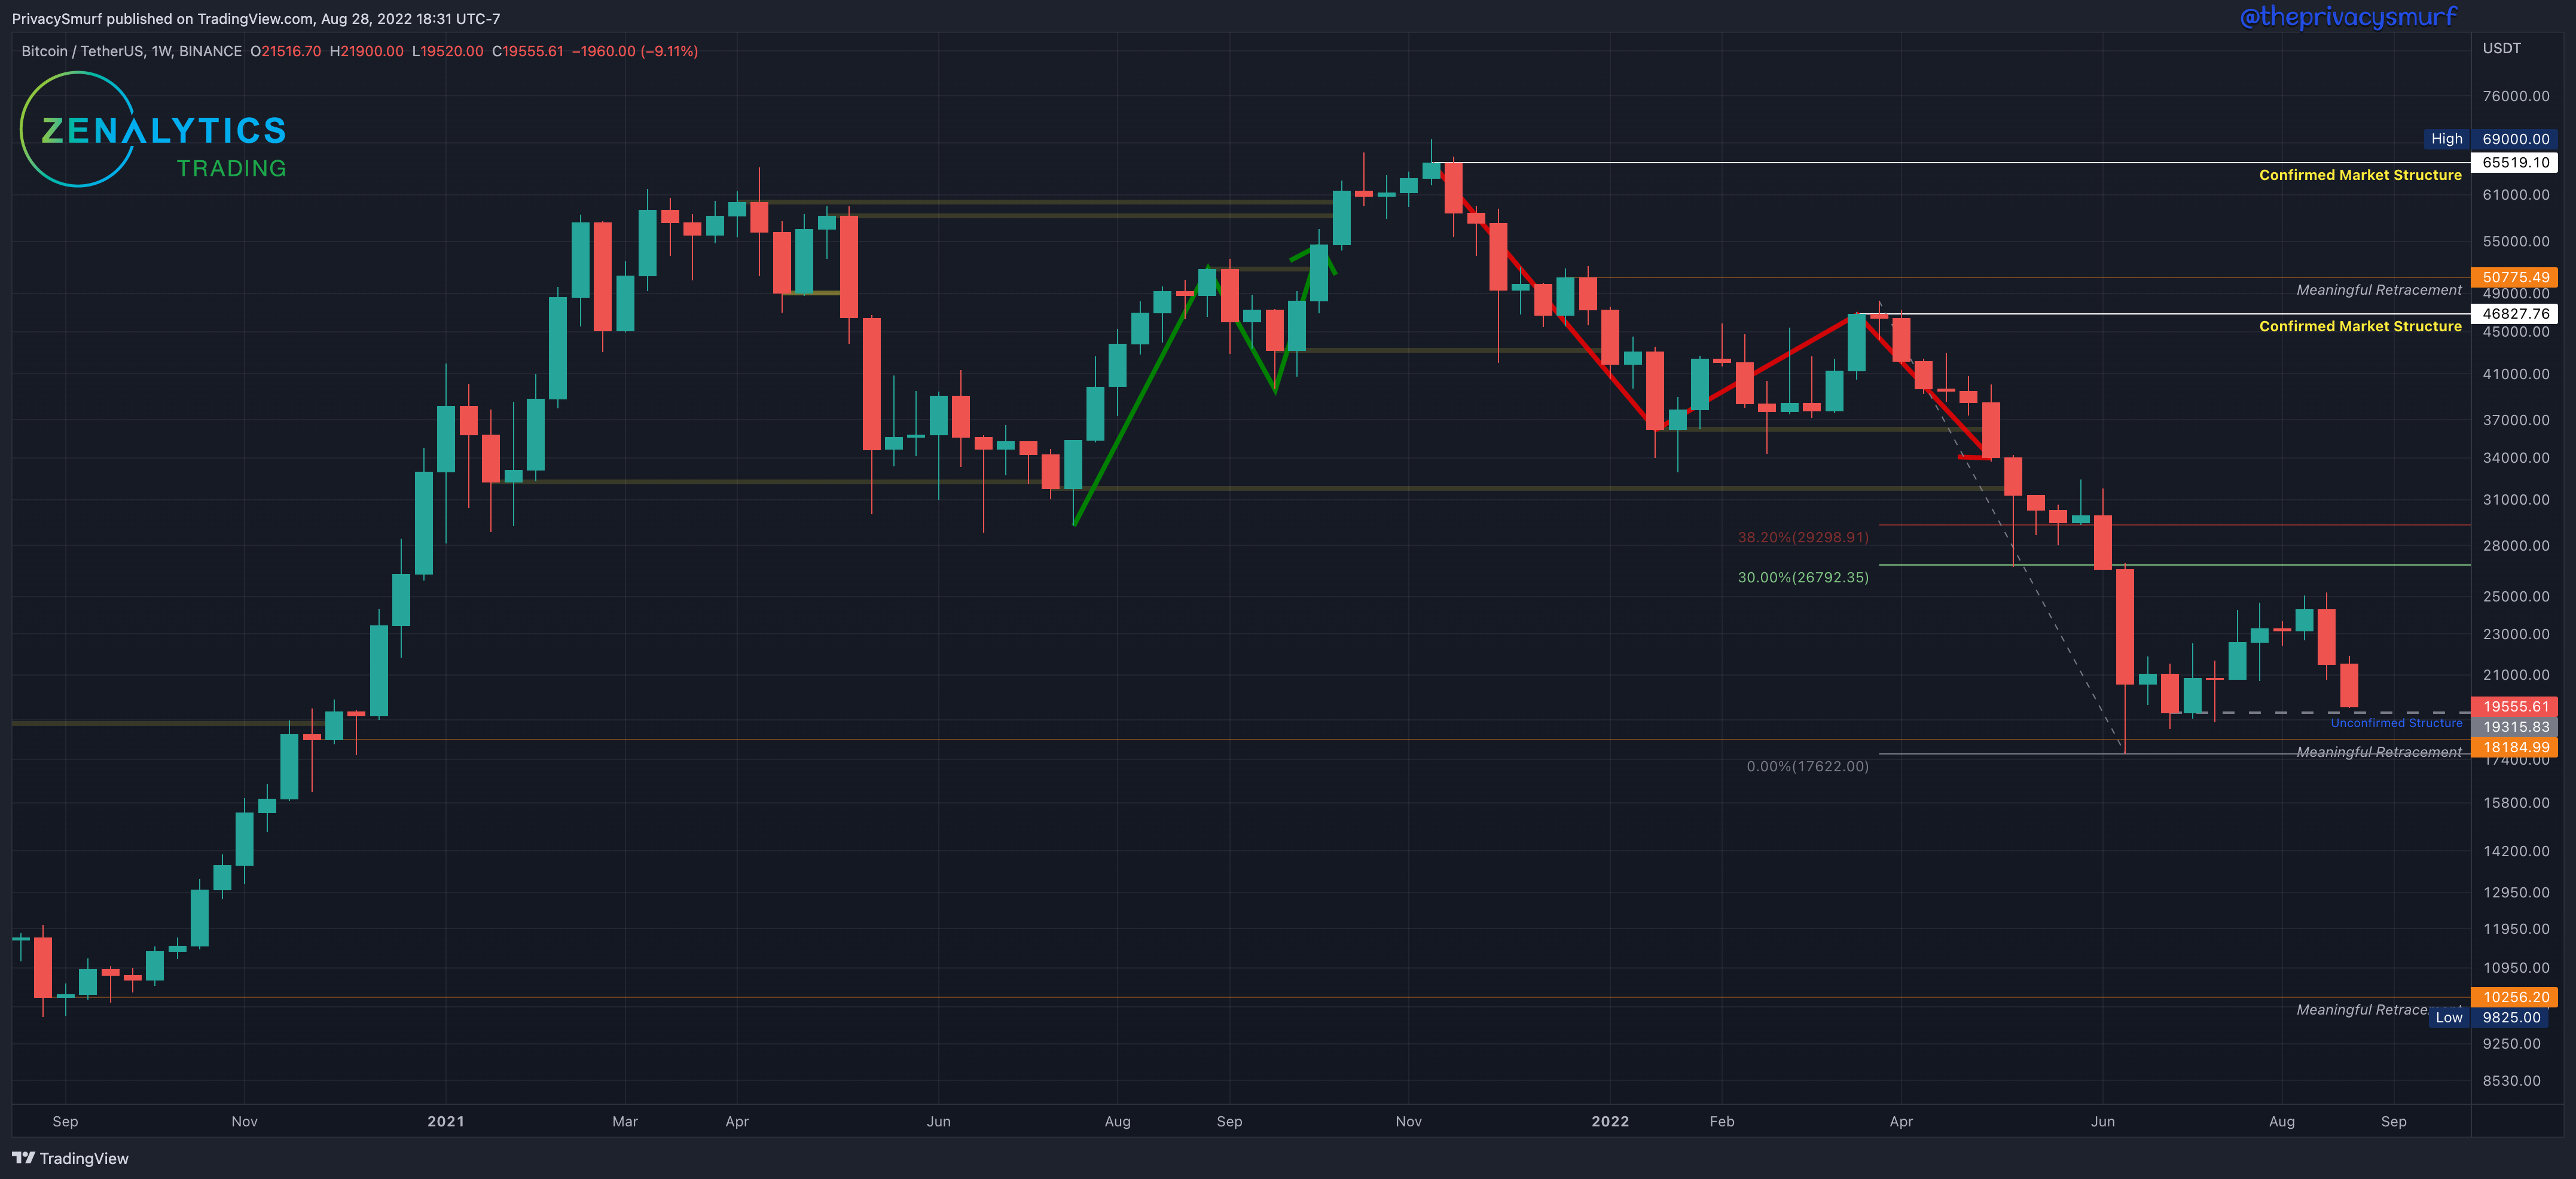
Since my last post, we’ve had bearish closes, yet there are still no changes to the long-term picture. With no new lower low, the fib retracement from the highest high of the last ‘Confirmed Market Structure’ resistance remains at the last lowest low at $17622. Since the last posting, there has been no lower low close past $19315, so it remains the ‘Unconfirmed Structure’ although another red week will likely lower that price level. If prices increase from here with a close above $29298, this will confirm the structure as support. The weekly market structure trend is still bearish.
From a long-term investing perspective, there are no moves to be made (for the HODL bags) since the ‘meaningful retracement’ at $18185 from Dec 2021 was been hit and the DCA order was filled. The next lower buy location for me is at $10256 (it is in no way an attempt to time the market or call a bottom but is a location of value). Given current technicals, I don’t expect that to hit soon, but I have a DCA order. From a long-term trading perspective, a buy order (for selling at the next cycle peak) won’t be taken by me for this timeframe until the market shifts back to bullishness. I want to buy strength, not weakness.
BTC/USDT Daily Chart
https://www.tradingview.com/chart/jjSdFW4b/
From last week:
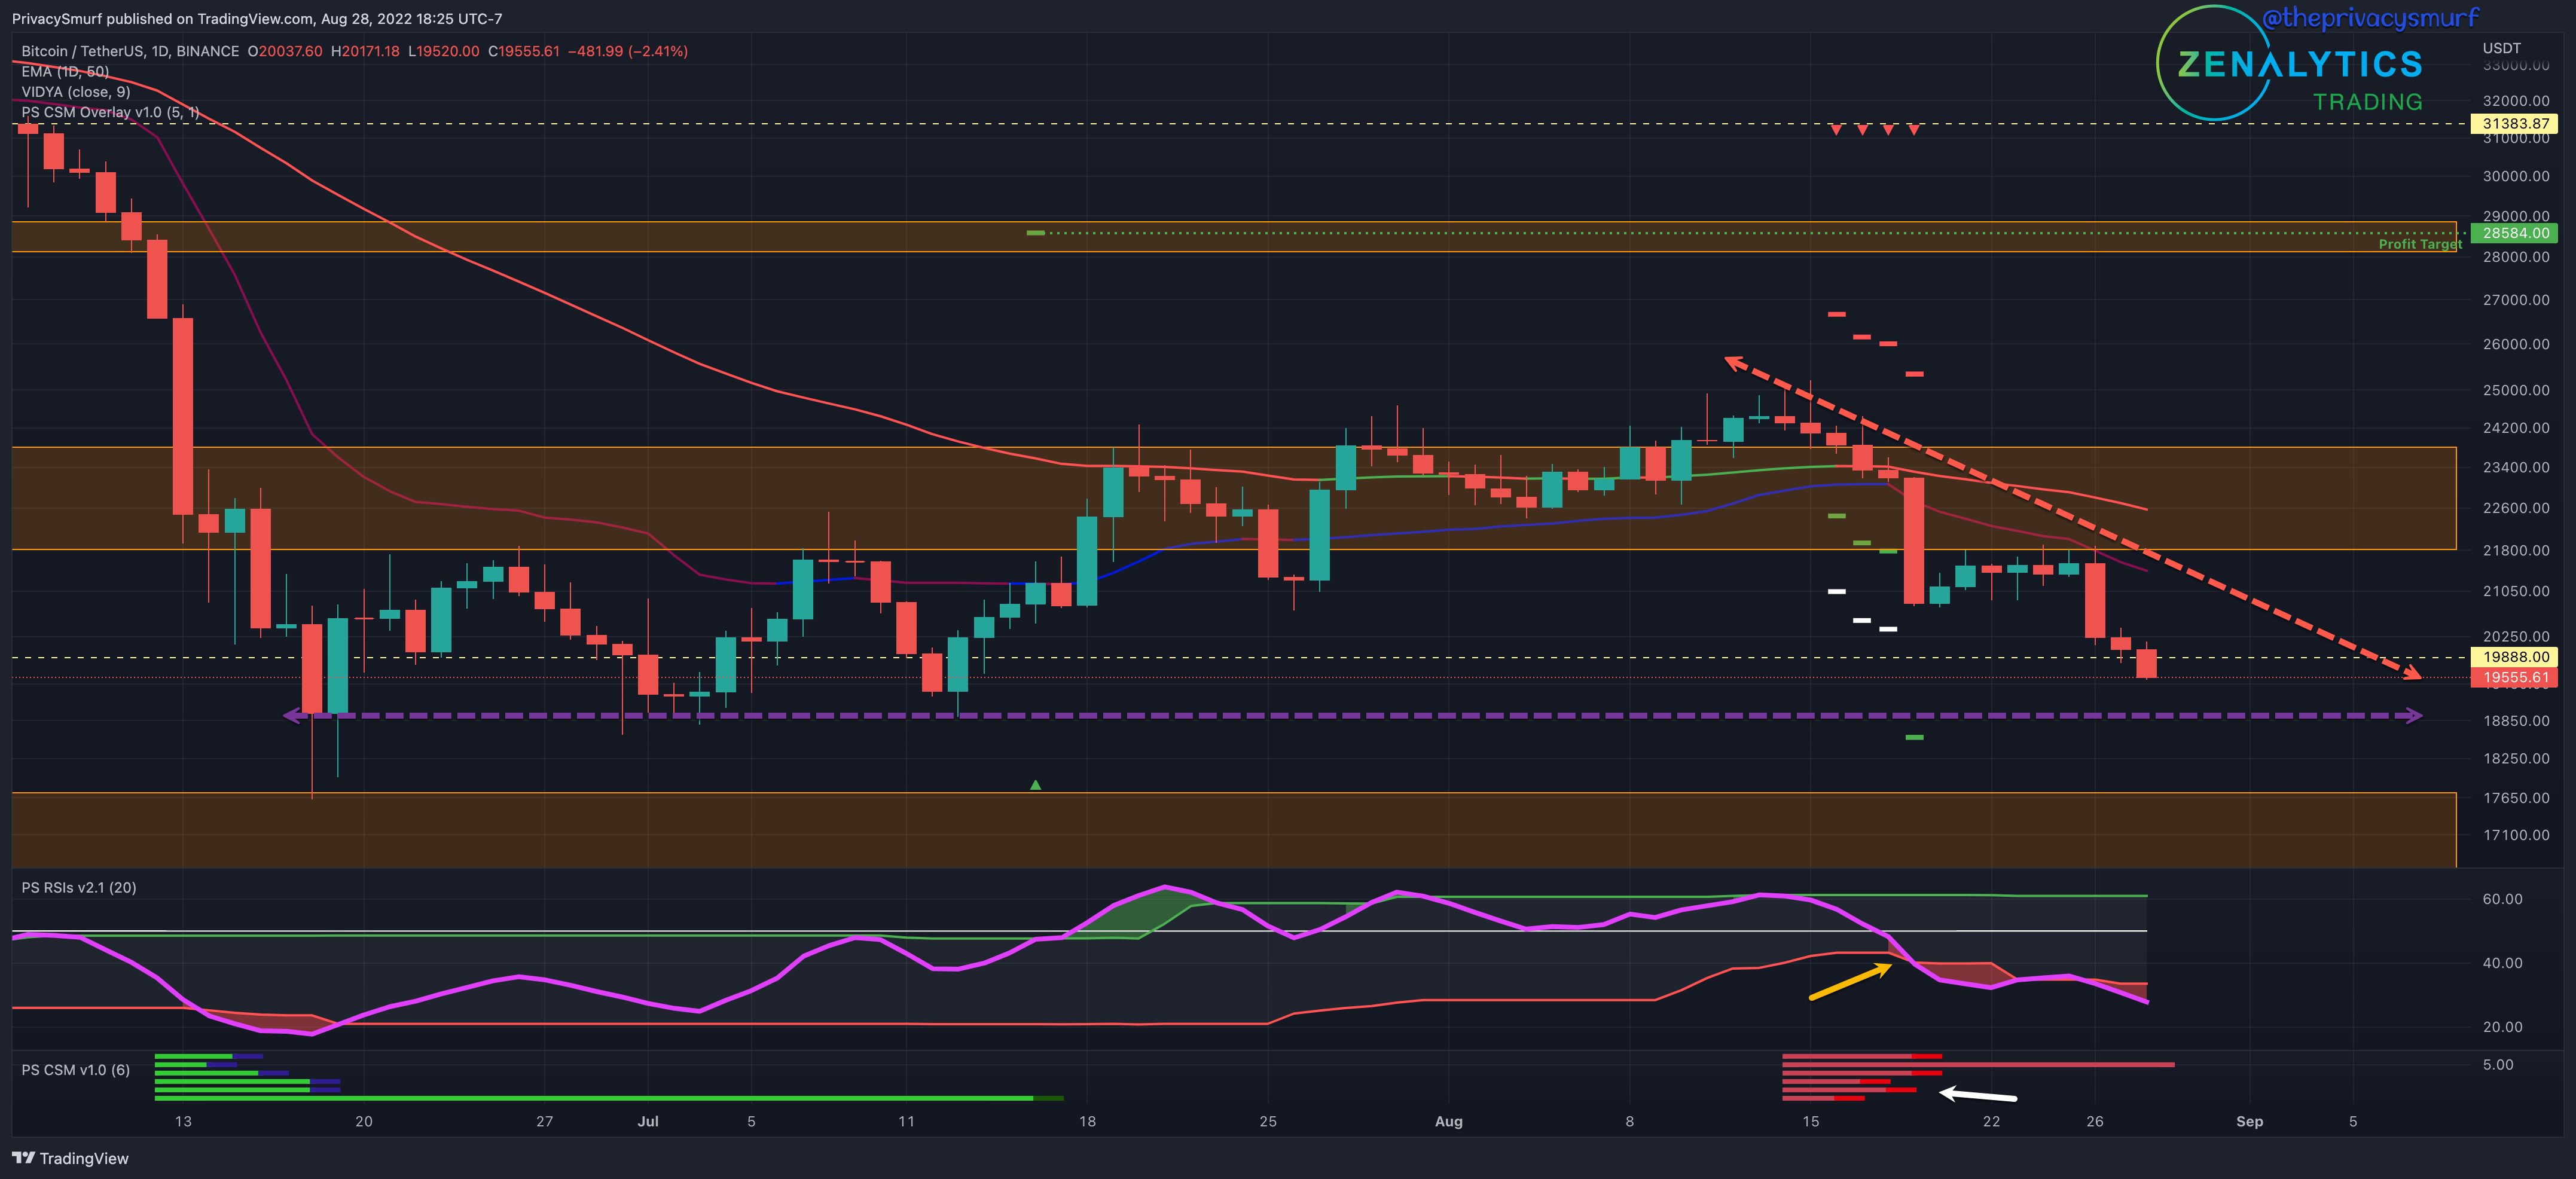
“… If the RSI continues its descent… this would likely be accompanied by a volatile decline. My custom indicator… is plotting red on all the oscillators signifying the potential for a bearish reversal… gives additional weight to the idea of a bearish break… consider taking profits on positions from July...”
Bitcoin continues to paint red as if there was a sale on it at the hardware store. The hard-earned bullish structure built slowly over July and August has been thrown out the window, with the majority of losses coming in 2 individual days. A descending trend line (red dashed arrow line) could be drawn from the peak in mid-August. This line may meet the most recent lowest close (purple dashed arrow line). This wedging structure may create some point of consolidation and volatile break, but compression is still some days away. Looking at current technicals, the RSI (yellow arrow) has broken below the midline and bottom adaptive band, suggesting the floor is still not found yet and further potential downside. I’d be looking for the RSI to at least move back in between the bands before I entertain the idea of stability in price fluctuations. My custom indicator, the Correction Strength Meter at the bottom of the chart (white arrow), signaled multiple bearish trade conditions, all of which hit initial targets with a secondary bearish target remaining underneath the lower potential support. A wick down to hit that isn’t outside of reasonable expectations. Something to keep in mind, as we haven’t been down to these low price levels in a while, it’s likely that there are some buy orders there to be filled to give some bounces, but at the moment, I’m not expecting too much in the way of a bullish return just yet given the technicals.
On a side note, even if we hit new lows under $19k, the RSI is measuring low enough that it will NOT be plotting bullish divergence by the methodologies I follow, so that doesn’t give me a lot of good feelings about the end-of-Q3 prospects.
Q3 Forecast Update
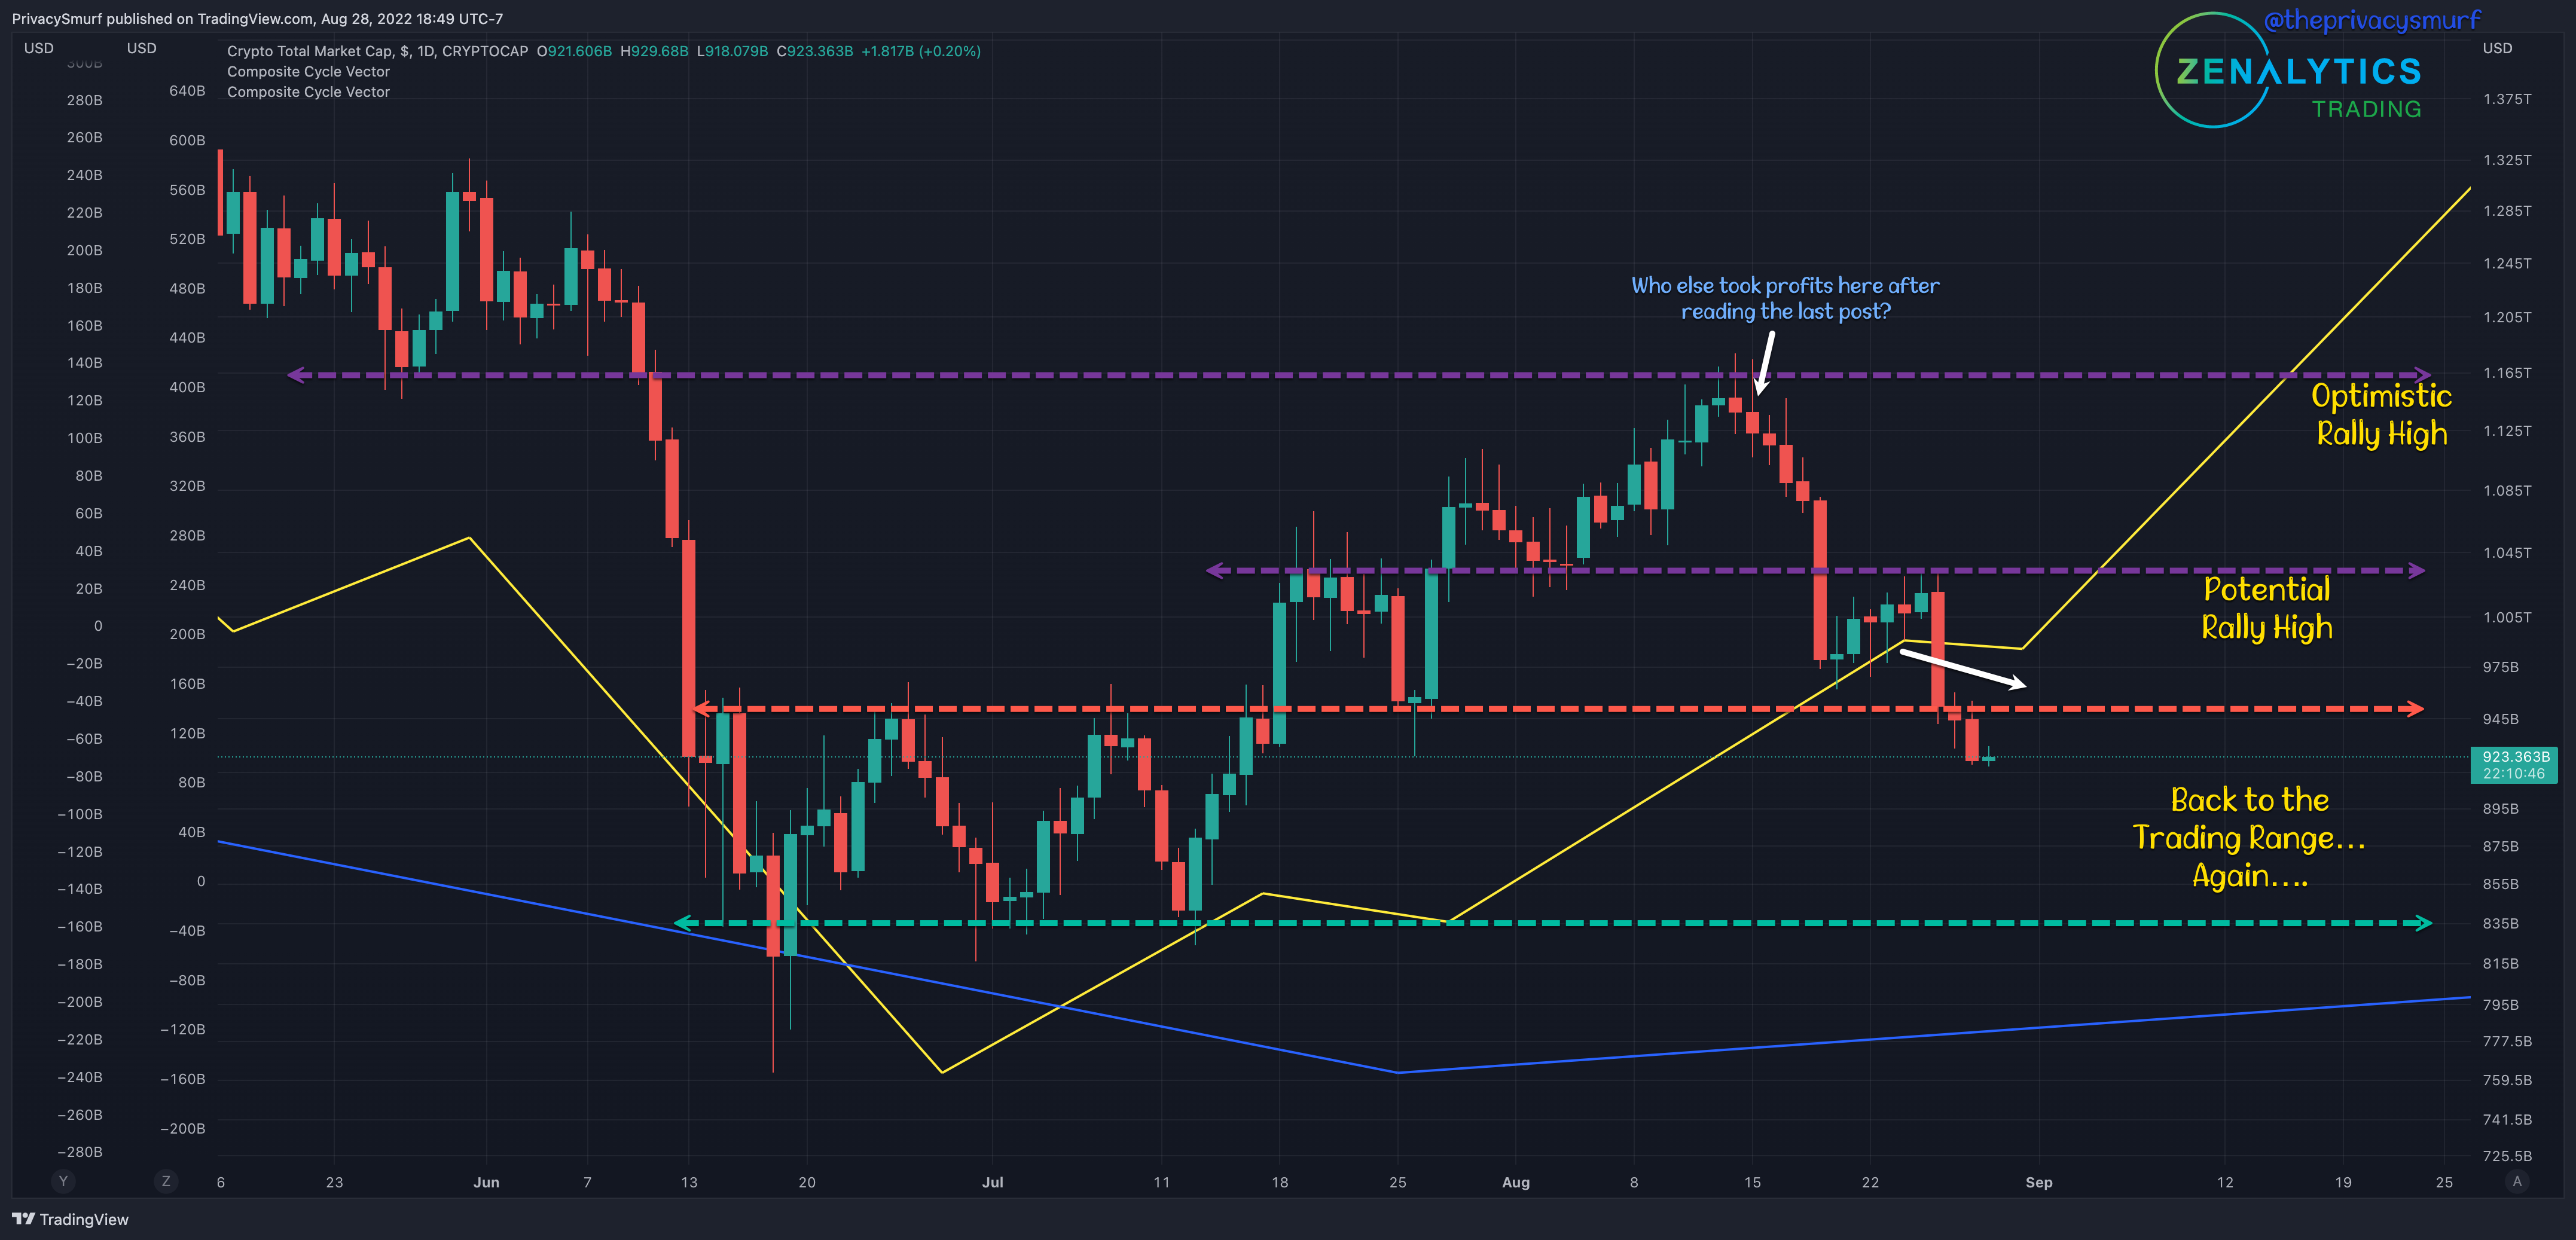
These moments are the challenging ones to deal with. Below is the modeling from the Total Market Cap. Something every analyst must hold close to is that all models are simplifications, and simplifications can be dangerous. We see here a similar departure from the models like in Q2. Here, however, price action and oscillators were screaming in opposition to the models hence the suggestions last post regarding taking profits. While this leg of the cycle has seen a price decline, it is still in a positive position, and the most recent selloff also aligns with a minor downward cyclical leg (white arrow above the last few days of price action). In various models, this down leg extends into early September. Something to consider taking recent price action into account, as we recently lost the support from late July and are in a daily bearish trend of lower highs and lower lows one must entertain the possibility of ranging at the same lower levels from June and July to consolidate and rebuild confidence in the market. Below I’ve labeled the potential areas of this forecasted Q3 bear market rally peak. This is PURE speculation and should be taken with the biggest grain of salt. Price action will always dictate my actions, and this type of rumination on hypotheticals is just for fun and to flex my creative muscles.
Here’s that forecast in case you missed it.

Unpopular Opinion Warning:
Something I’ve commented on before in writing and tweets and in personal zoom calls/youtube/whatever video is the debate of news vs. TA. As a technician primarily working on forecasting, I’m always going to lean towards (correct) TA leading and news lagging. Also, in my opinion, determining the attribution of events is a fool's errand. The time spent figuring out a potential cause is time not spent looking at the things that don’t change, are right in front of you, and can’t tell you any other story besides what people are doing before, during, and after some event (price action). I’m not concerned with WHY something happened or happens if I can identify leading troublesome technical conditions and backtest consistent patterns/signals. The cause is ultimately irrelevant to my portfolio/trading account. The whys will always change or be something we may never be able to prove/replicate/identify. Price action is always there, so why not focus on that instead? Sure I enjoy the speculation as much as the next person in the market, but it’s the last part of any work I do if I even do it.
Measured intraday cycles projected ahead of time for the peaking of the price cycle before Powell opened his mouth (white arrows and cycle timing projection on price chart). Way before any speech, the bottom band (white up arrow under) of the RSI moved up close to the midline showing the floor of relative volatility creeping closer and closer to price. During these moments, I become very wary of long positions, and the bottom band was breached before announcements suggested a volatile downside. My indicator, the Correction Strength Meter (white arrow at bottom of the chart), also began plotting bearish corrections possibilities ahead of time.
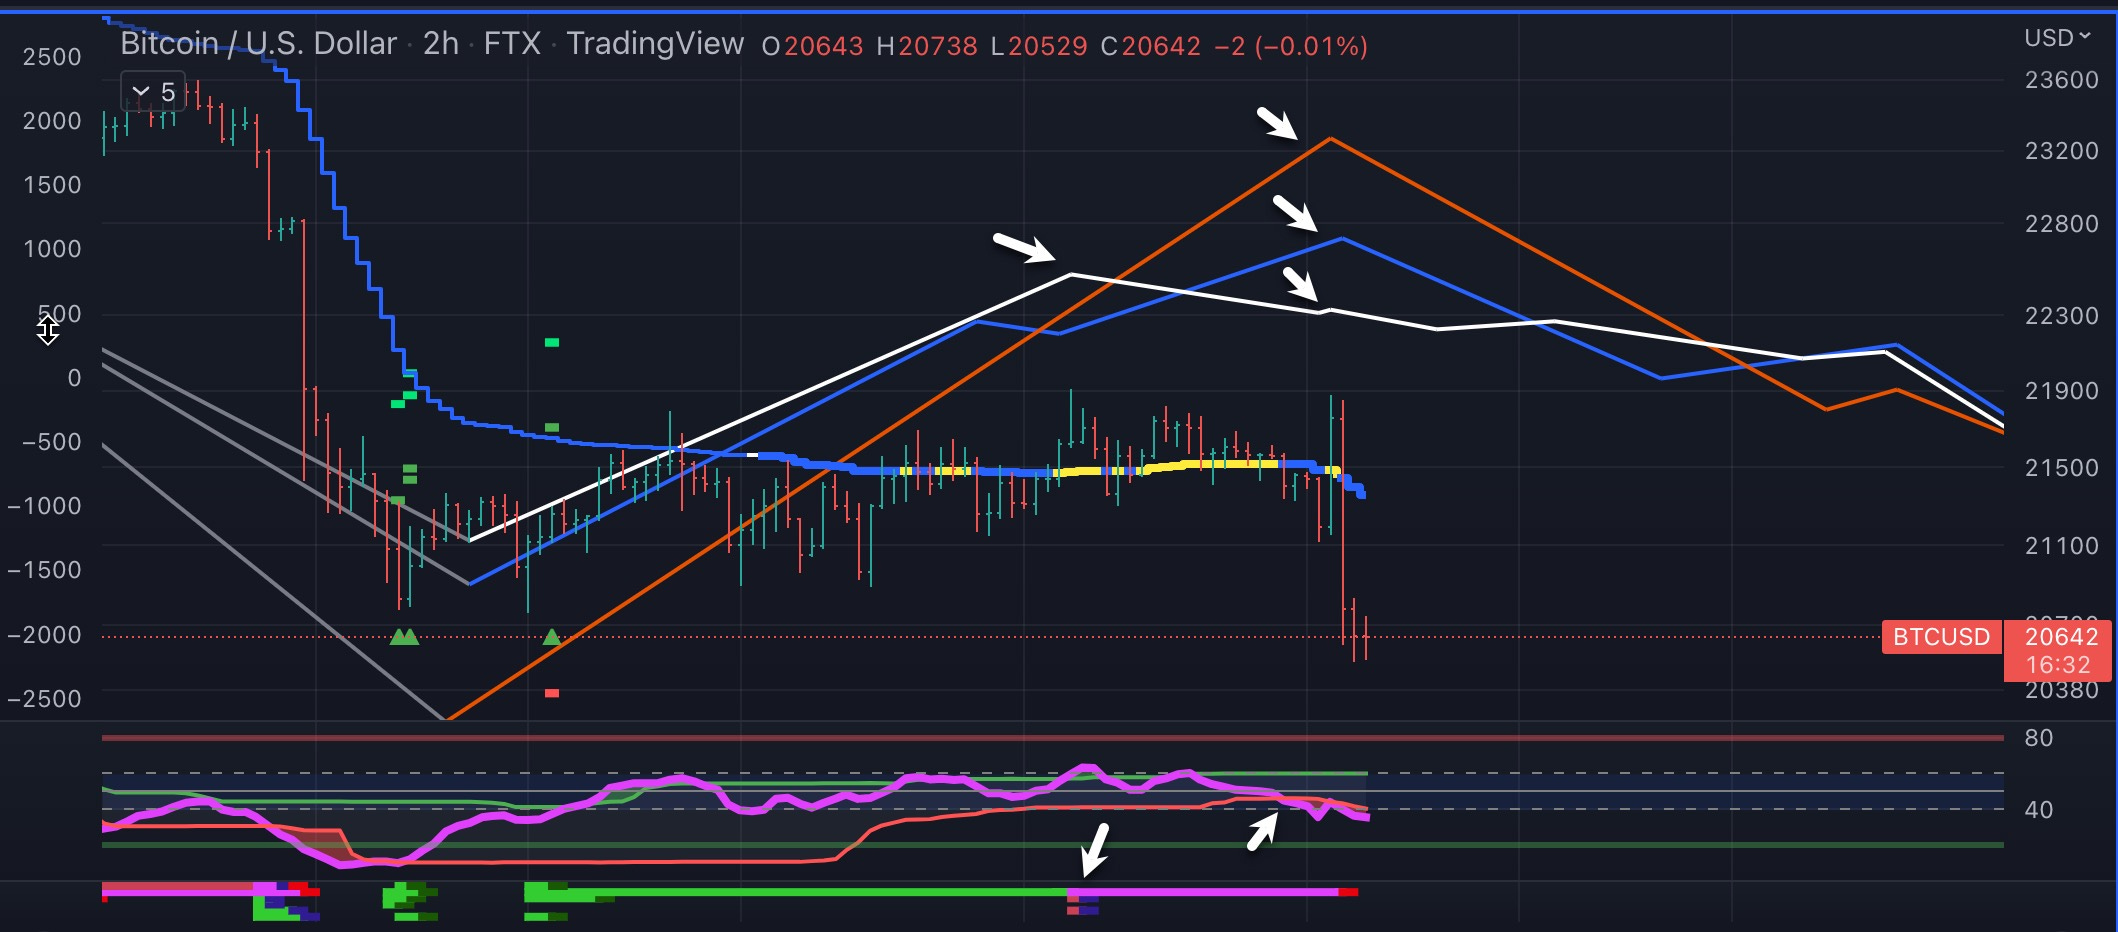
News and current events will add impulse to moves, but those moves can be identified ahead of time if you are looking in the right places. There’s no need to wait if you watch price/technicals and can accept the risk and volatility.
ETH/BTC Weekly Structure
https://www.tradingview.com/chart/sacHlXOv/
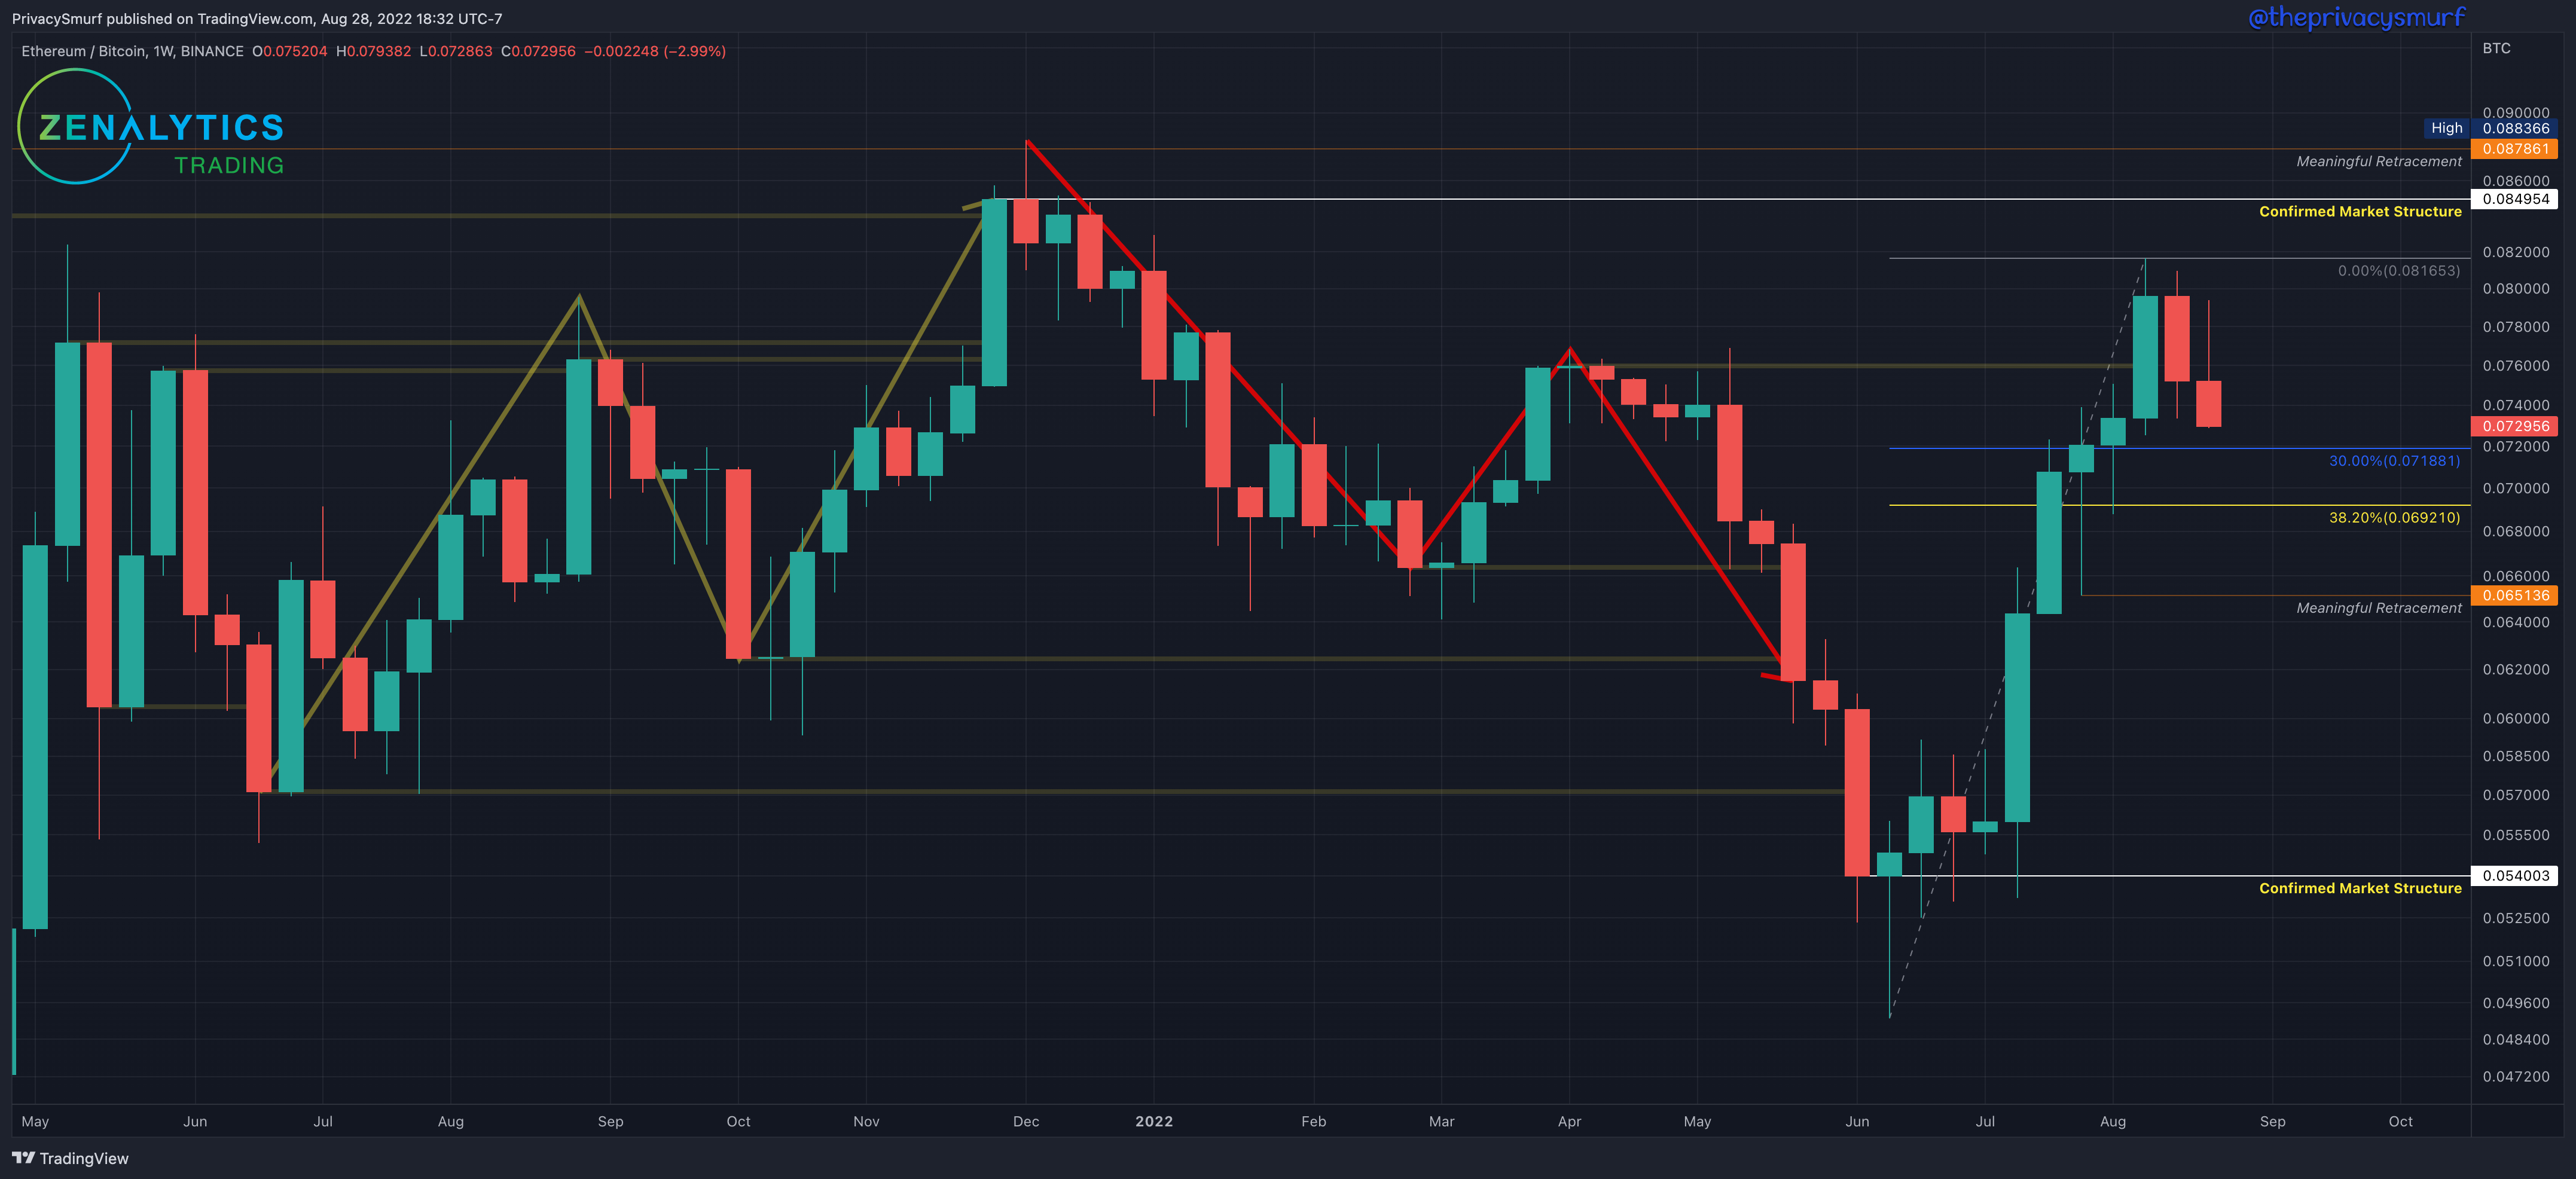
Along with BTC, ETH took a plunge over the last two weeks. If prices continue to decrease from here with a close below 0.06921, this will confirm the highest close as market structure resistance. The weekly market structure trend is still bearish despite this bullish price action. If a weekly close comes in above the Confirmed Market Structure resistance at 0.084954, this would be the second resistance broken without any higher low closes, and I would consider the trend bullish. I'm applying this arbitrary yet objective rule to this method to cover instances where there is no zig-zag move of higher highs and higher low pivot points.
From a mid-term trading perspective, the trend is down, and I don’t want to be buying into a bearish trend but considering that we have established a new higher high close, I’m watching on a retracement to consider frontrunning the trend and buying the potential bounce from the incoming higher low. This potential retracement may be what is forecasted in the cyclical trends above. I’d be looking for a potentially risky entry anywhere from 0.066 to 0.074. Any bullish divergence signals on higher intraday timeframes or swing entries in that range may be a great place to buy for the next leg up or at least into the test of the high structure resistance.
From a long-term investing perspective, I expect that if we fall and lose value in the ETH/BTC relationship, the new structure at just under 0.054 ultimately acts as support. I don't have a long-term DCA buy order there at the moment. If we confirm the structure above it, I will add an order at 0.054 again (it is in no way an attempt to time the market or call a bottom, it is a location of value as shown by the amount of buying activity there). Given current technicals, **I don’t expect that to be hit in the near term.
ETH/BTC Daily Chart
https://www.tradingview.com/chart/gTkSjkj6/
From last week:
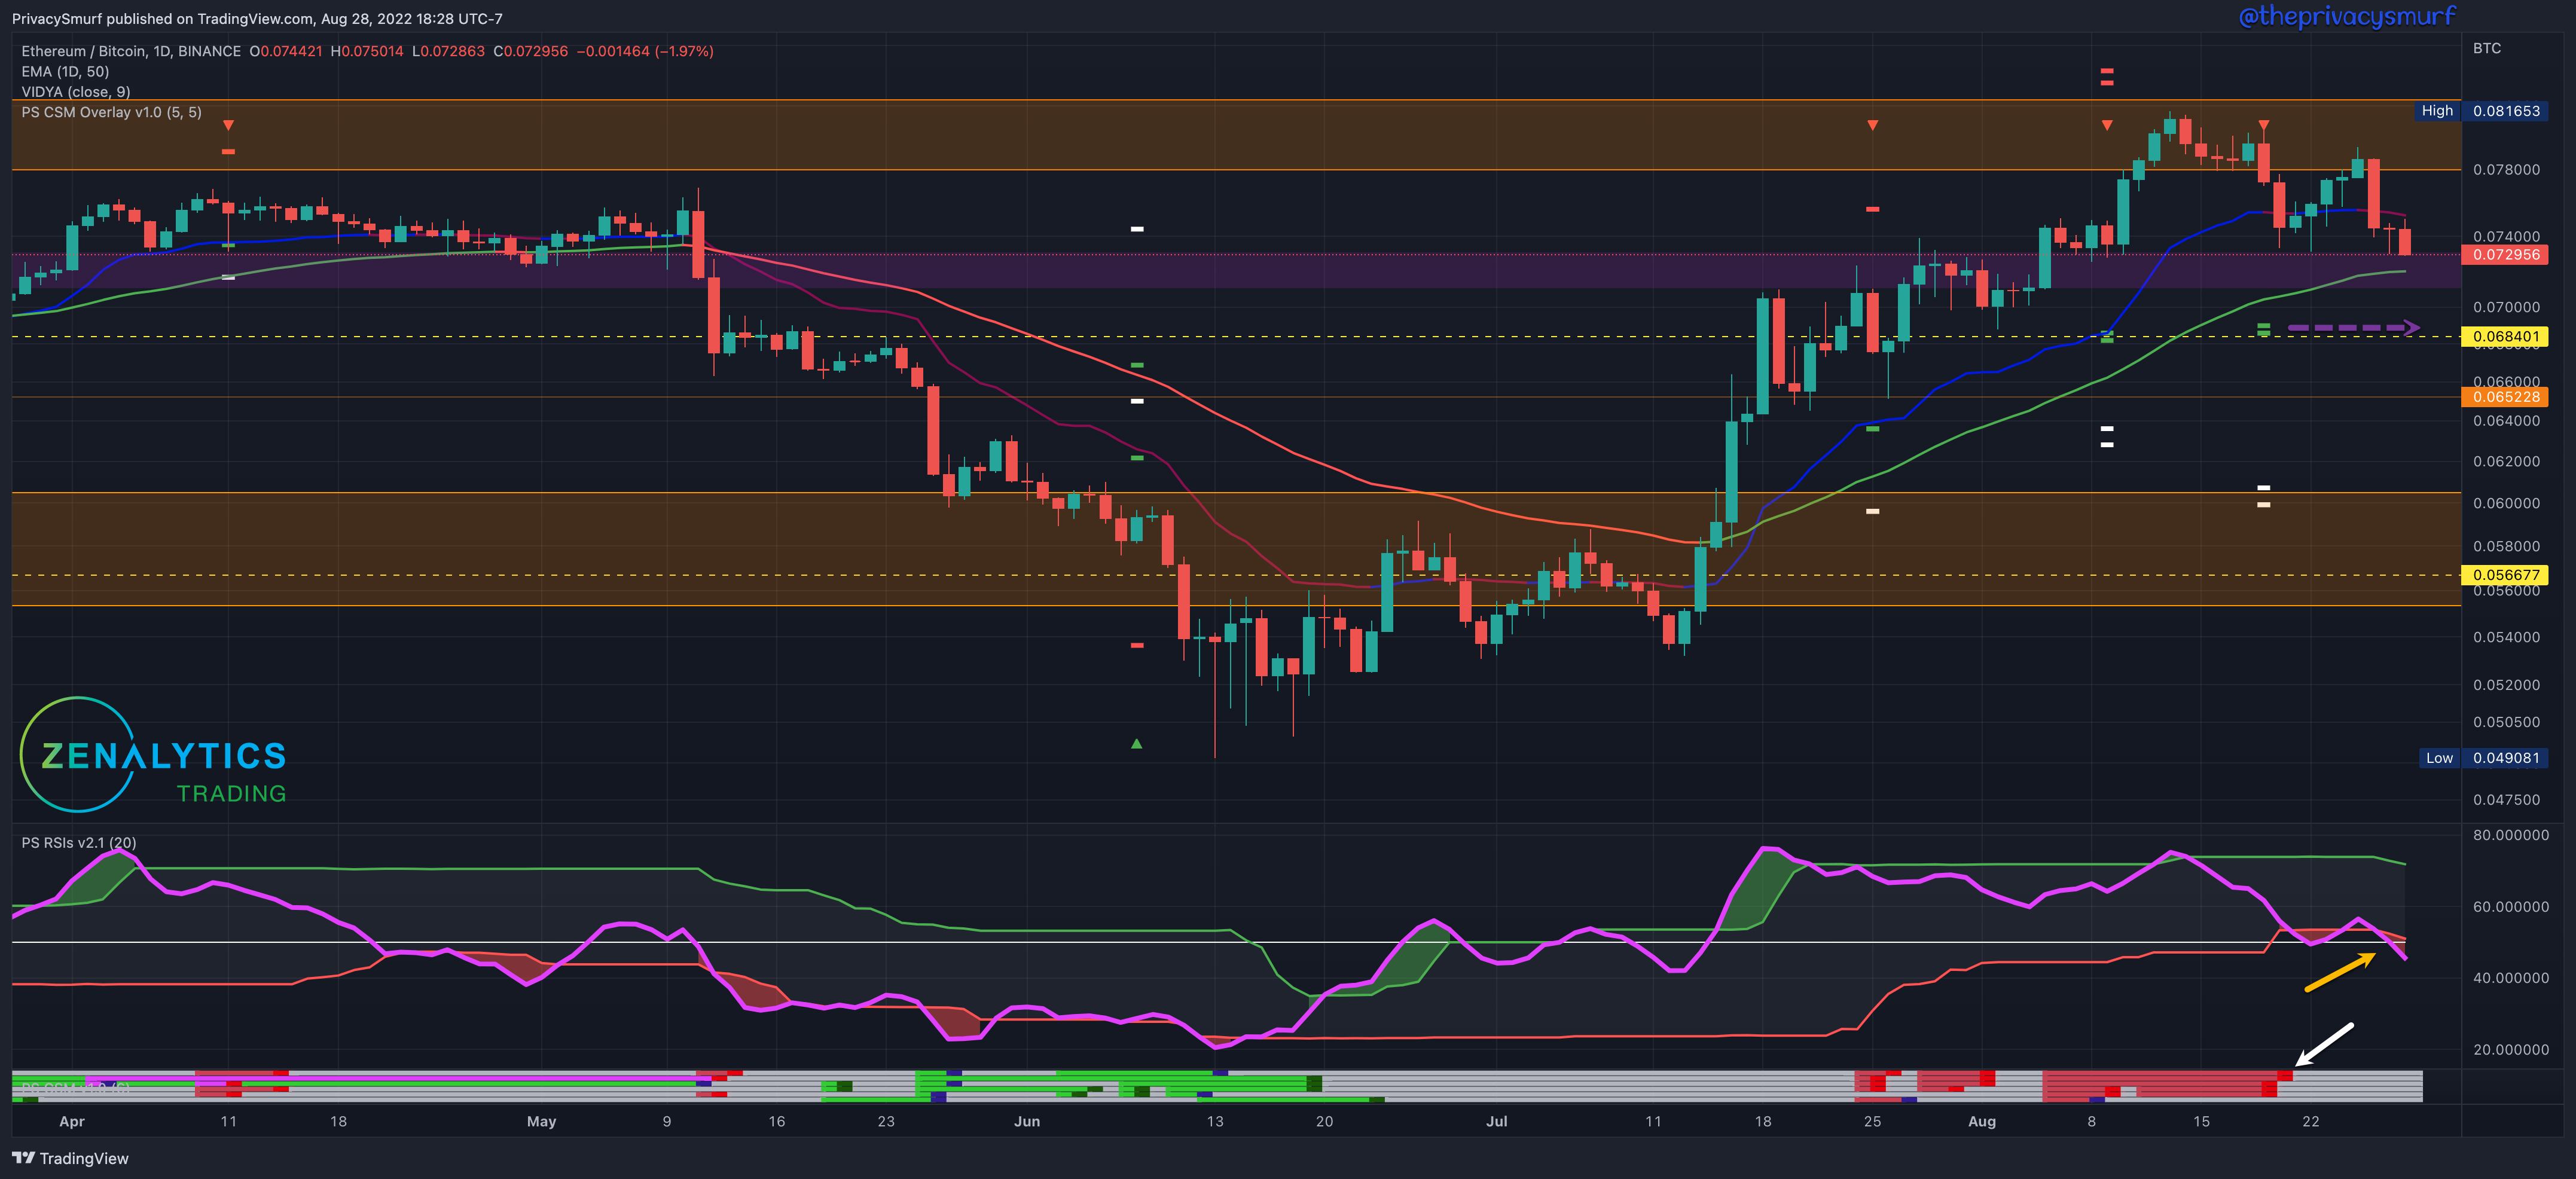
“…remain multiple bearish trade signals… The bottom adaptive band of the RSI continues up towards the midline which supports the possibility of volatile bearish price action if the RSI breaks it to the downside. It’s only a matter of time for the retracement… wary of any bounce from the zone around 0.072, but the price may hang up there…”
Here we see one of the results of bearish signals on the ETH/BTC chart. Both BTC and ETH go down. There are still some levels of support below the current price action, but the technicals continue to turn bearish. The RSI (yellow arrow) is now breaking below the bottom band and midline. This would suggest some volatile downside. The Correction Strength Meter (white arrow) is plotting bearish trade signals. These initial targets are hovering around the 0.0685 support. This is a very reasonable target this week IMO, especially if the RSI doesn't bounce back up from the midline. With a new lower-low close, the daily trend here has turned bearish. I’d not be interested in buying any ETH with BTC until this trend shifts or at least when we get lower for a potential bounce play at the lower ends of the range (the early June levels).
ETH/USDT Weekly Structure
https://www.tradingview.com/chart/JPTp0aXw/
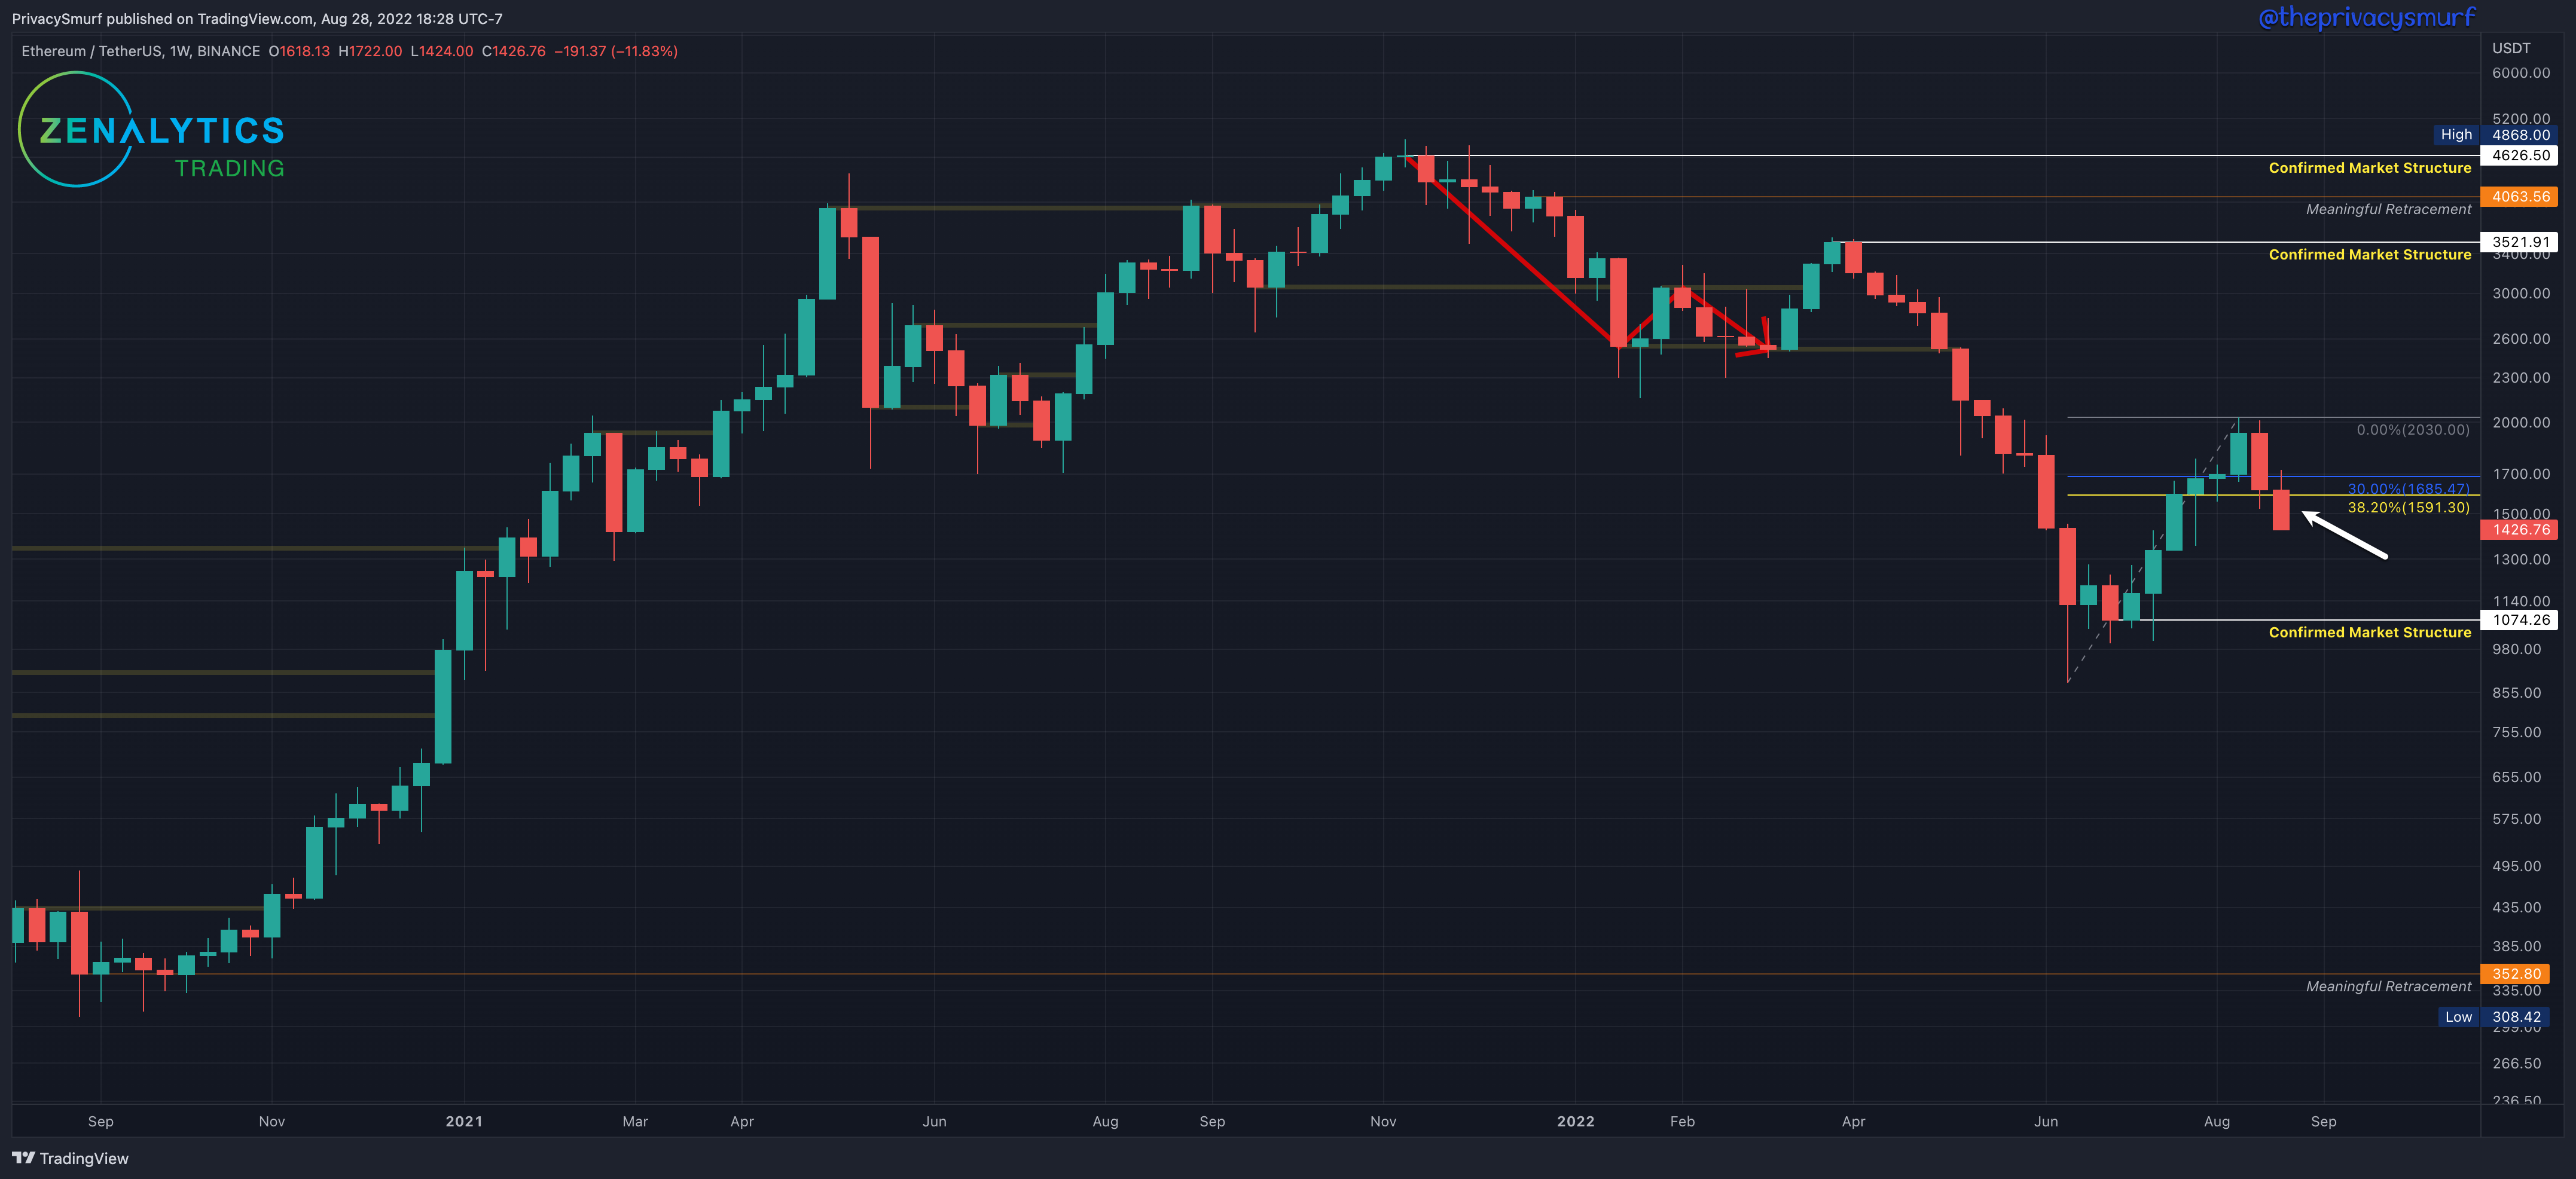
Since the last post, ETH has fallen bearish for two weeks, the image above shows ETH closed below the 38.2% retracement point. This confirms the high close pivot at $1935 as Market Structure resistance. Now we shift the fib retracement anchor to measure from the highest high of the upwards leg to the most recent lowest low. This can be seen below.
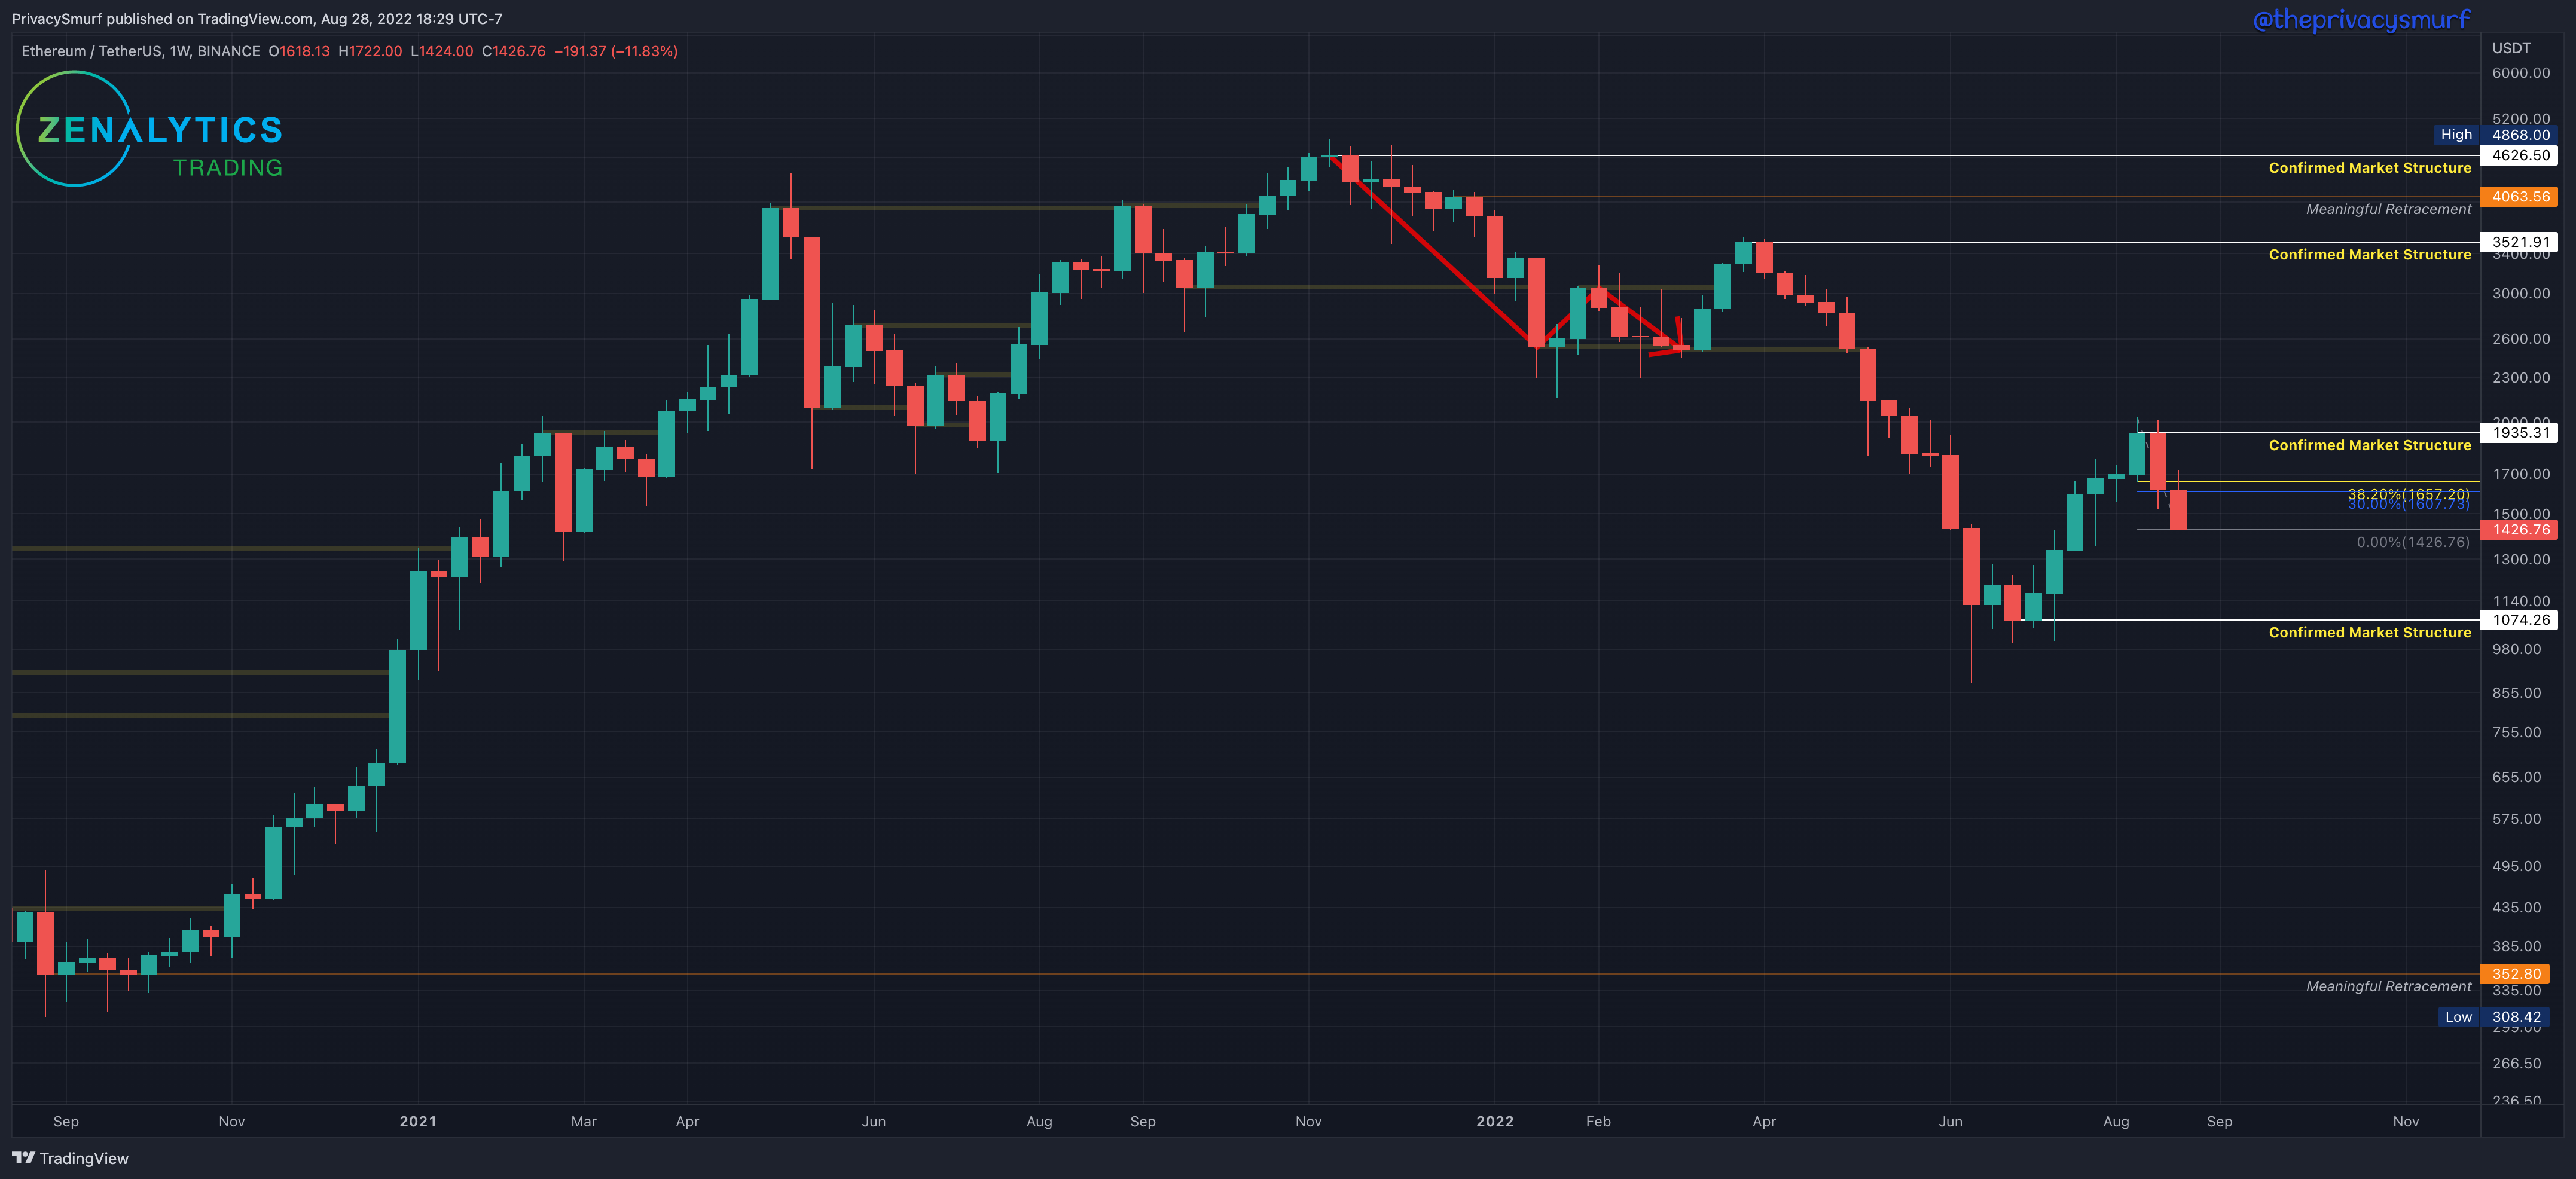
With the new anchor and extension, prices must increase for two weeks and close above $1657 to confirm a market structure support at wherever price that lower pivot point comes from.
From a long-term investing perspective, there are no moves to be made (for the HODL bags) since the ‘meaningful retracement’ at $1232 from Jan 2021 was hit, and the DCA order was filled. The next lower buy location for me is at the broken structure at $800 from 2021 (it is in no way an attempt to time the market or call a bottom but is a location of value) and $352. Given current technicals, I don’t expect that to hit soon, but I have DCA orders there. If structure support is confirmed above $1074, I will place a new DCA order at $1074.
From a long-term trading perspective, a buy order (for selling at the next cycle peak) won’t be taken by me for this timeframe until the market shifts back to bullishness. This is a tough call to make as that will require many weeks of waiting while potentially missing much of a move. I’ve discussed above how I’d navigate taking a position in ETH, given there are no great signals here yet.
ETH/USDT Daily Chart
https://www.tradingview.com/chart/xbB6lkZu/

From last week (most relevant point only):
I’d consider taking profits on positions from July, given the conditions.
ETH is very similar structurally to BTC however slightly less weak. Bitcoin continues to paint red as if there was a sale on it at the hardware store. The bullish structure built slowly over July and August is gone but only barely. The daily trend has shifted to bearish, but the late July support is only BARELY broken. I’m not holding onto hope of that meaning a bullish shift, but it’s at least something that may keep ETH from falling as hard as BTC. A descending trend line (red dashed arrow line) could be drawn from the peak in mid-August. This line may meet up with the highs of the range from earlier this summer (purple dashed arrow line). This wedging structure may create some point of consolidation and volatile break, but compression is still some days away. Looking at current technicals, the RSI (yellow arrow) has broken below the midline and bottom adaptive band, suggesting the floor is still not found yet and further potential downside. I’d be looking for the RSI to at least move back in between the bands before I entertain the idea of stability in price fluctuations. My custom indicator, the Correction Strength Meter at the bottom of the chart (white arrow) signaled bearish trade conditions, initial targets were hit with a secondary bearish target remaining above the lower potential support. If ETH can manage to keep out of the prior range when/if BTC stabilizes inside its old range, that would give me a reason to suspect a greater return in ETH once the market returns to bullishness.
A big thank you to all who have stuck through my many summer absences. While traveling, I also worked hard to provide even better products and analyses. I’ve been cramming a lot breaking into the programming space, and elevating my skills by learning python. The automation I’m building and functionalities in python will allow me to bring better-looking products than just tradingview charts. Also, I can do a more comprehensive analysis. Also, I’ve got cooler things in mind for my educational site once I unveil that for all the paid subscribers next quarter. Market screeners, interactive charts, calculators, all sorts of stuff. I’ve even been doing some neat work and have some unique methods/products I can bring to analysis in the NFT marketplace through repos/APIs I’ve found. It’s gonna be worth the wait and radio silence. I’ve dedicated all of September to writing more content instead of programming studies and will release sections of the site throughout the month, ideally being all released by Q4.
@theprivacysmurf
Brilliant content.
I would love to get better understanding of your Market Cap Cycle Model and how it alligns with price action.
Would you be able to make some kind of '101 Market Cap Cycle Model for Dummies' guide??
Looking forward to everything you have cooking . Your work is greatly appreciated!