

Sunday Synopsis #52: Changes
Sunday Synopsis #52: Changes
Still don't know what I was waiting for and my time was running wild. A million dead-end streets and every time I thought I'd got it made it seemed the taste was not so sweet.

As I mentioned a little bit last time, new products will start making the rotation, it’s time for “ch-ch-ch changes.” The Sunday Synopsis will lose the structure charts and rotate to Market Structure Monday. I’ll annotate the Total Crypto Market Cap and ETH/BTC charts on the weekly, daily, and 4hr levels. Long story short, it will provide a bias for each level of market participant (investor or trader) and also inform the focus of efforts with the ETH/BTC chart, be it cash positions, BTC, or ETH. The Sunday Synopsis will shift to just looking at the daily charts.
On a side note, we are now in the last month of the quarter. The preparations for the Q4 forecast are already in the works. Hope to see you then. I plan to debut the new educational site then as well. It will be the hub for all my content. I’ll still have this newsletter where I’ll crosspost, but the idea is to make things easier to reference and for viewers to go back and review pieces.
I’ll also release the second part of the site sneak peek on risk management on Monday.
BTC/USDT Daily Chart
https://www.tradingview.com/chart/jjSdFW4b/
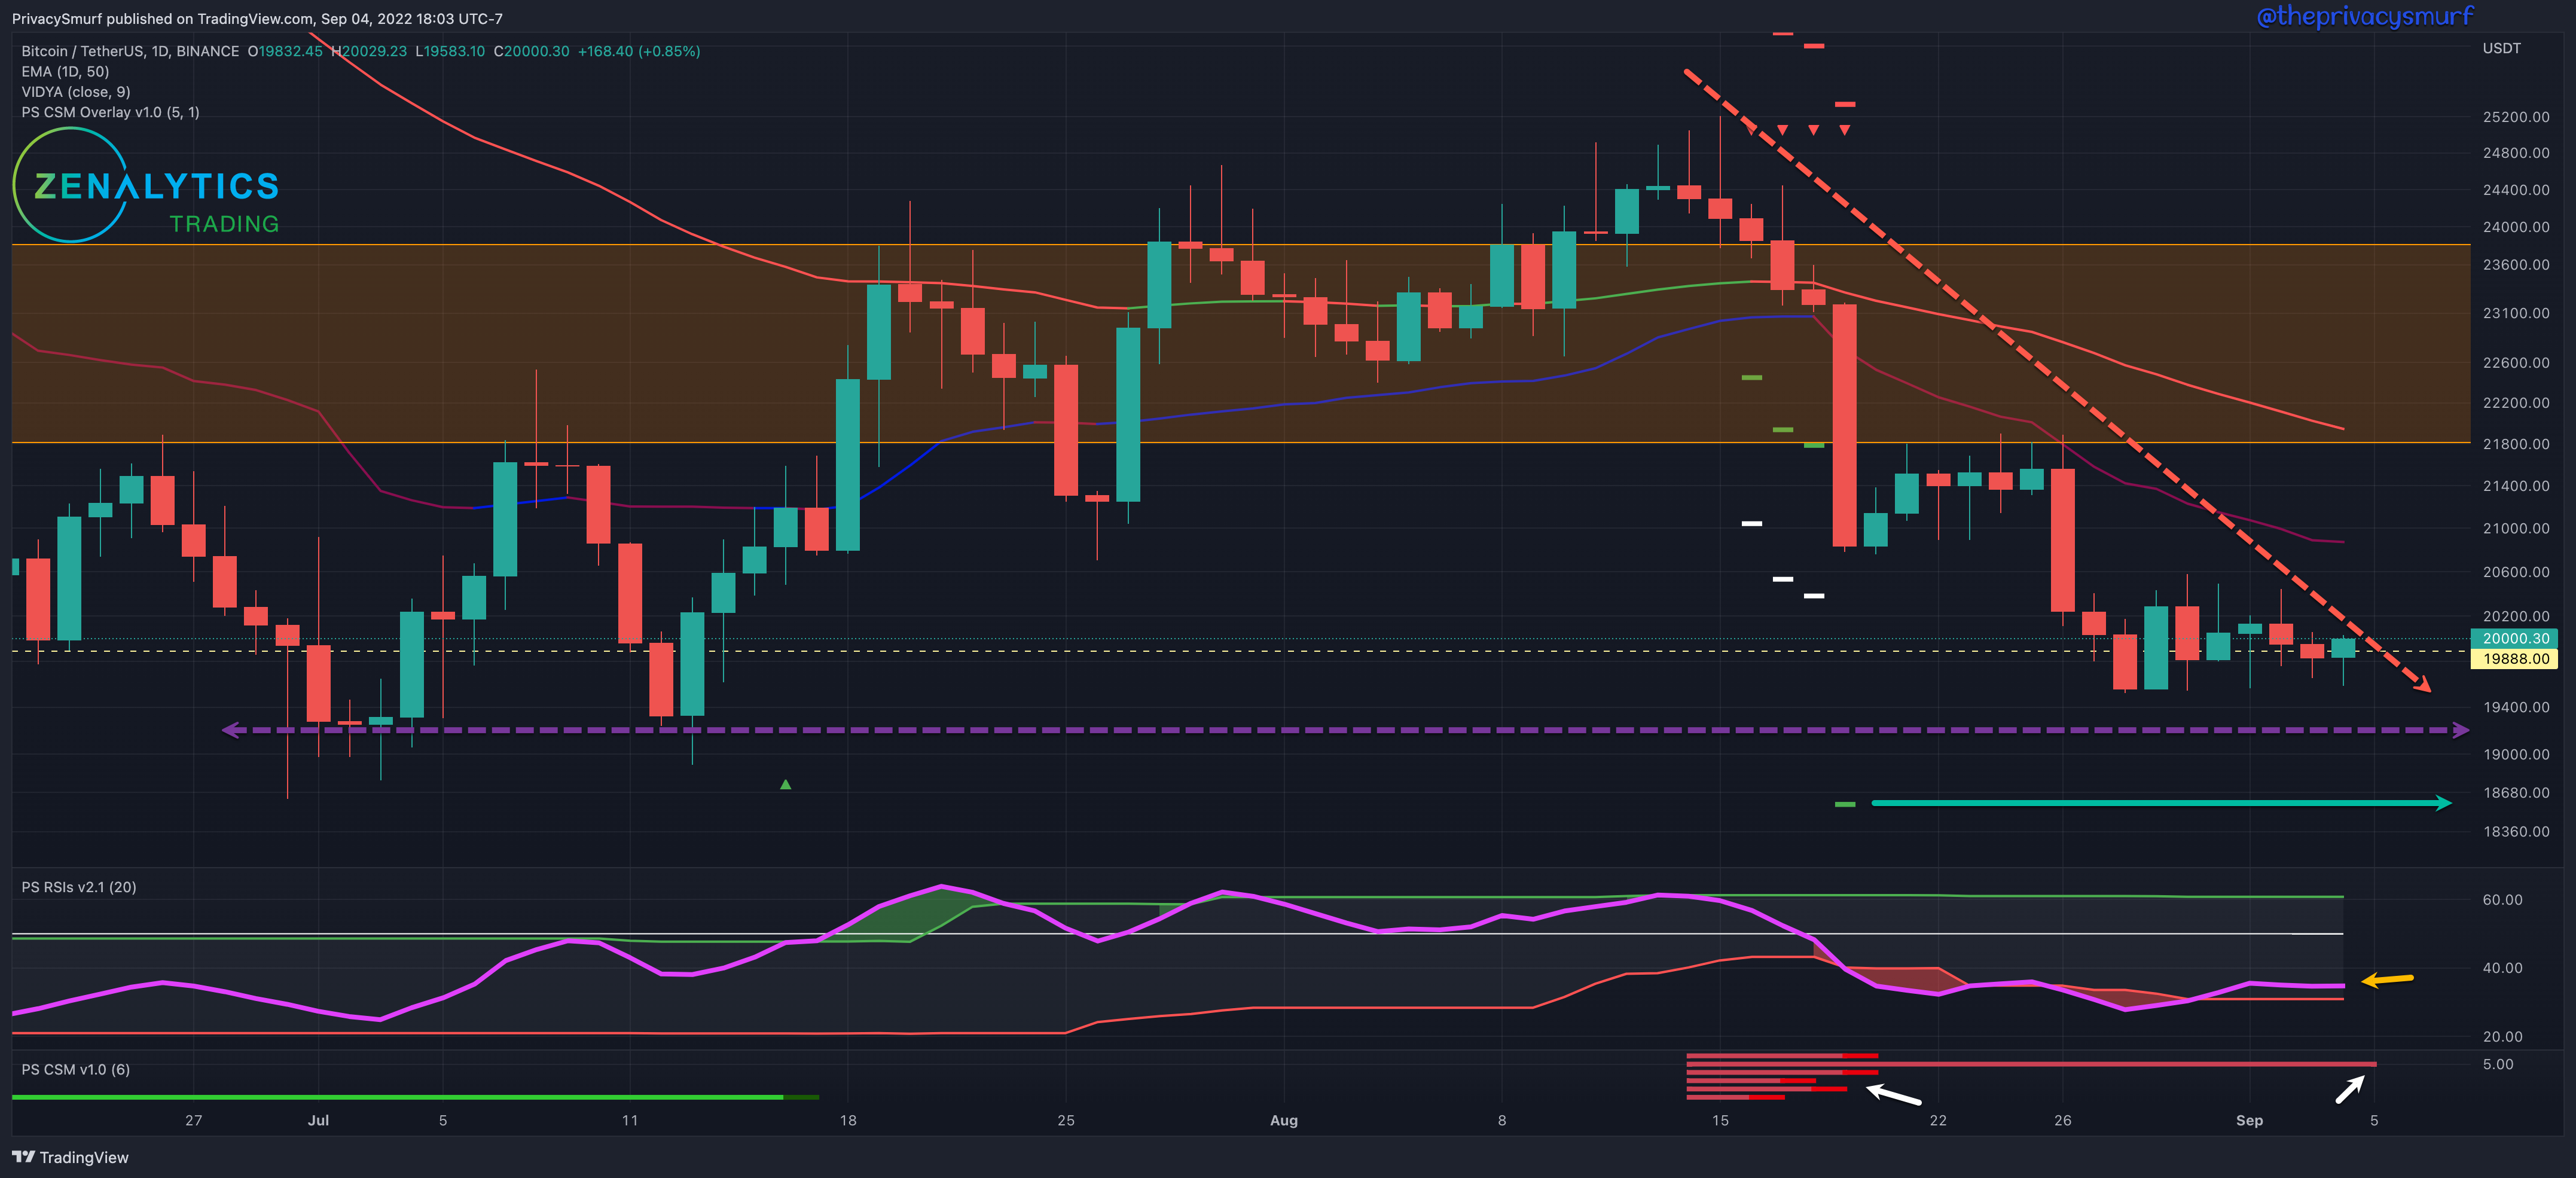
From last week:
“…looking for the RSI to … move back in between the bands before I entertain the idea of stability in price fluctuations… not expecting… a bullish return just yet...”
As shown in the chart above, the RSI (yellow arrow) managed to move back between the adaptive bands this past week, suggesting that price fluctuations would stabilize. We are now close to the end of the wedge-like structure, which may produce some volatility, but there’s not a lot in the technicals to give more weight to any direction. My custom indicator, the Correction Strength Meter (white arrows), is still plotting a red bar meaning the potential for further bearish price action. A target from an earlier trade signal from the CSM (green arrow) remains. It’s not outside of reasonable expectations, especially if the RSI breaks back down below the bottom band.
Given the current technicals, for the week, I would anticipate continued bearish pressure on prices, limiting top side prices somewhere under recent highs at $21.8k. If the RSI breaks down, I’d be looking for new lower lows, at least with wicks, maybe not closing prices as new lows. Same as last week, even if we hit new lows under $19k, the RSI is measuring low enough that it will NOT be plotting bullish divergence by the methodologies I follow, so that doesn’t give me a lot of good feelings about the end-of-Q3 prospects, I’ll talk more on this later.
ETH/BTC Daily Chart
https://www.tradingview.com/chart/gTkSjkj6/
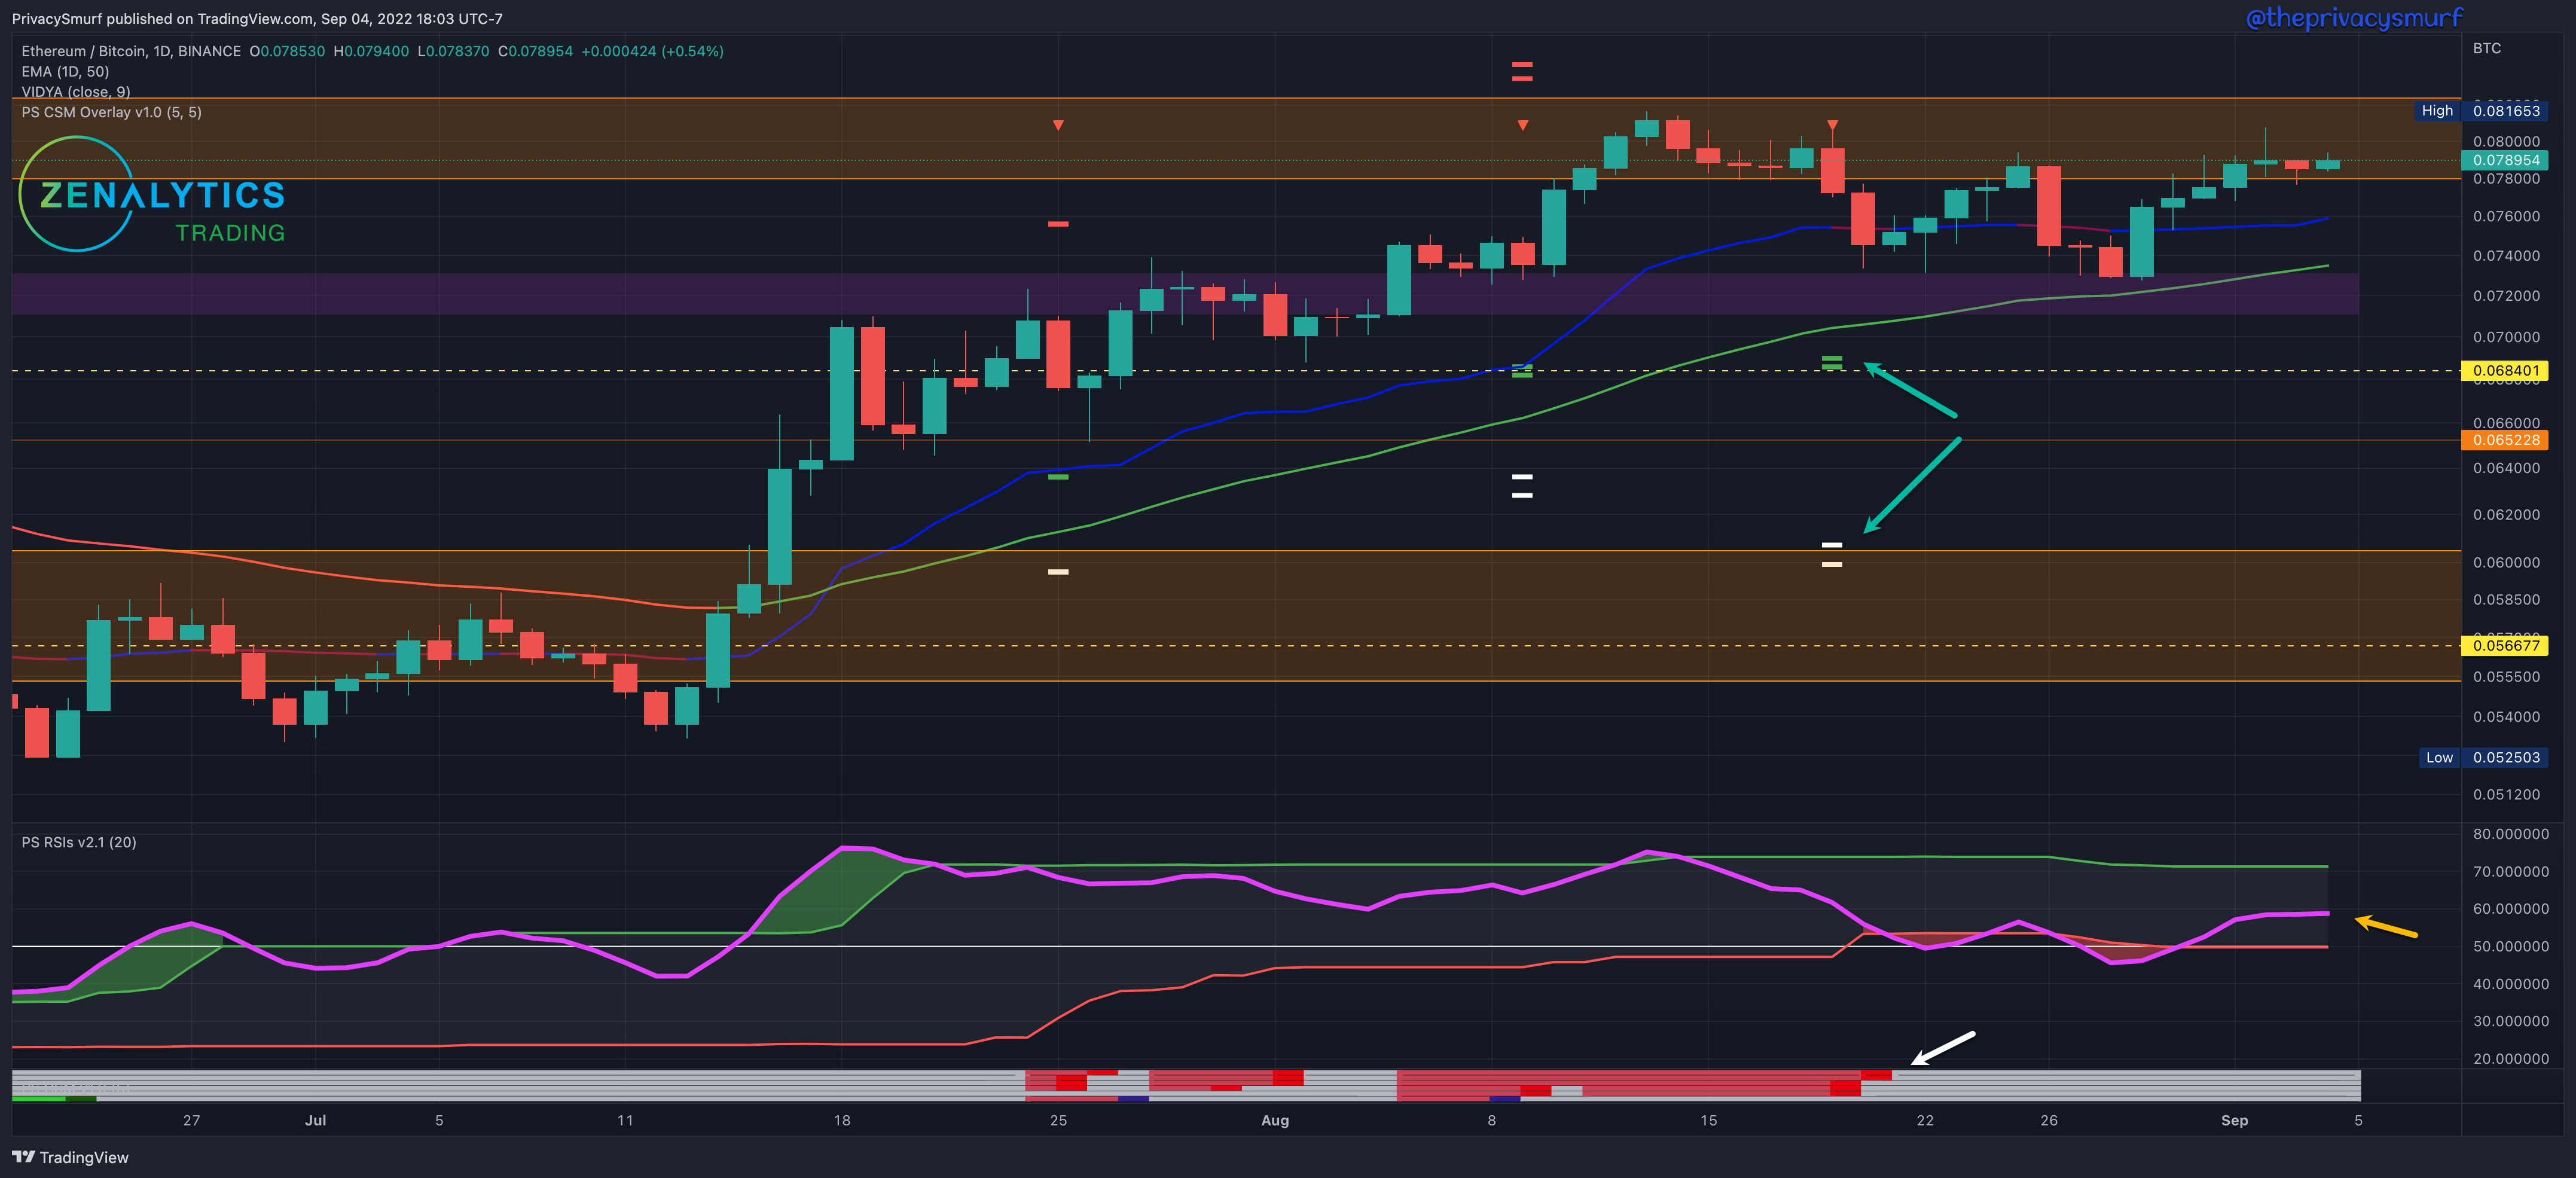
Bearish expectations from last week ended up not playing out and the support zone held as the price stabilized and the RSI moved back inside the adaptive bands (yellow arrow). The newly formed bearish trend has also been shifted to consolidation with a new higher high close set on Friday. My indicator, the Correction Strength Meter (white arrow), would still suggest bearish potential, and the targets plotted are still in play (green arrows).
Given the current technicals for the week, I’d expect more ranging due to the alignment of the RSI and prices. There is no reason to suggest changes from current price fluctuations. I’ll expand on this a bit below. Here I’d be looking to buy ETH and alts at the lower end of the range to sell at the top.
Below I’ve mirrored the RSI in white and set it as an overlay on the price candles. I’ve discussed expectations when the RSI is in line with the price, so I’ll expand on that now. When the RSI and price are aligned, I expect the current action in price to continue until divergence forms.
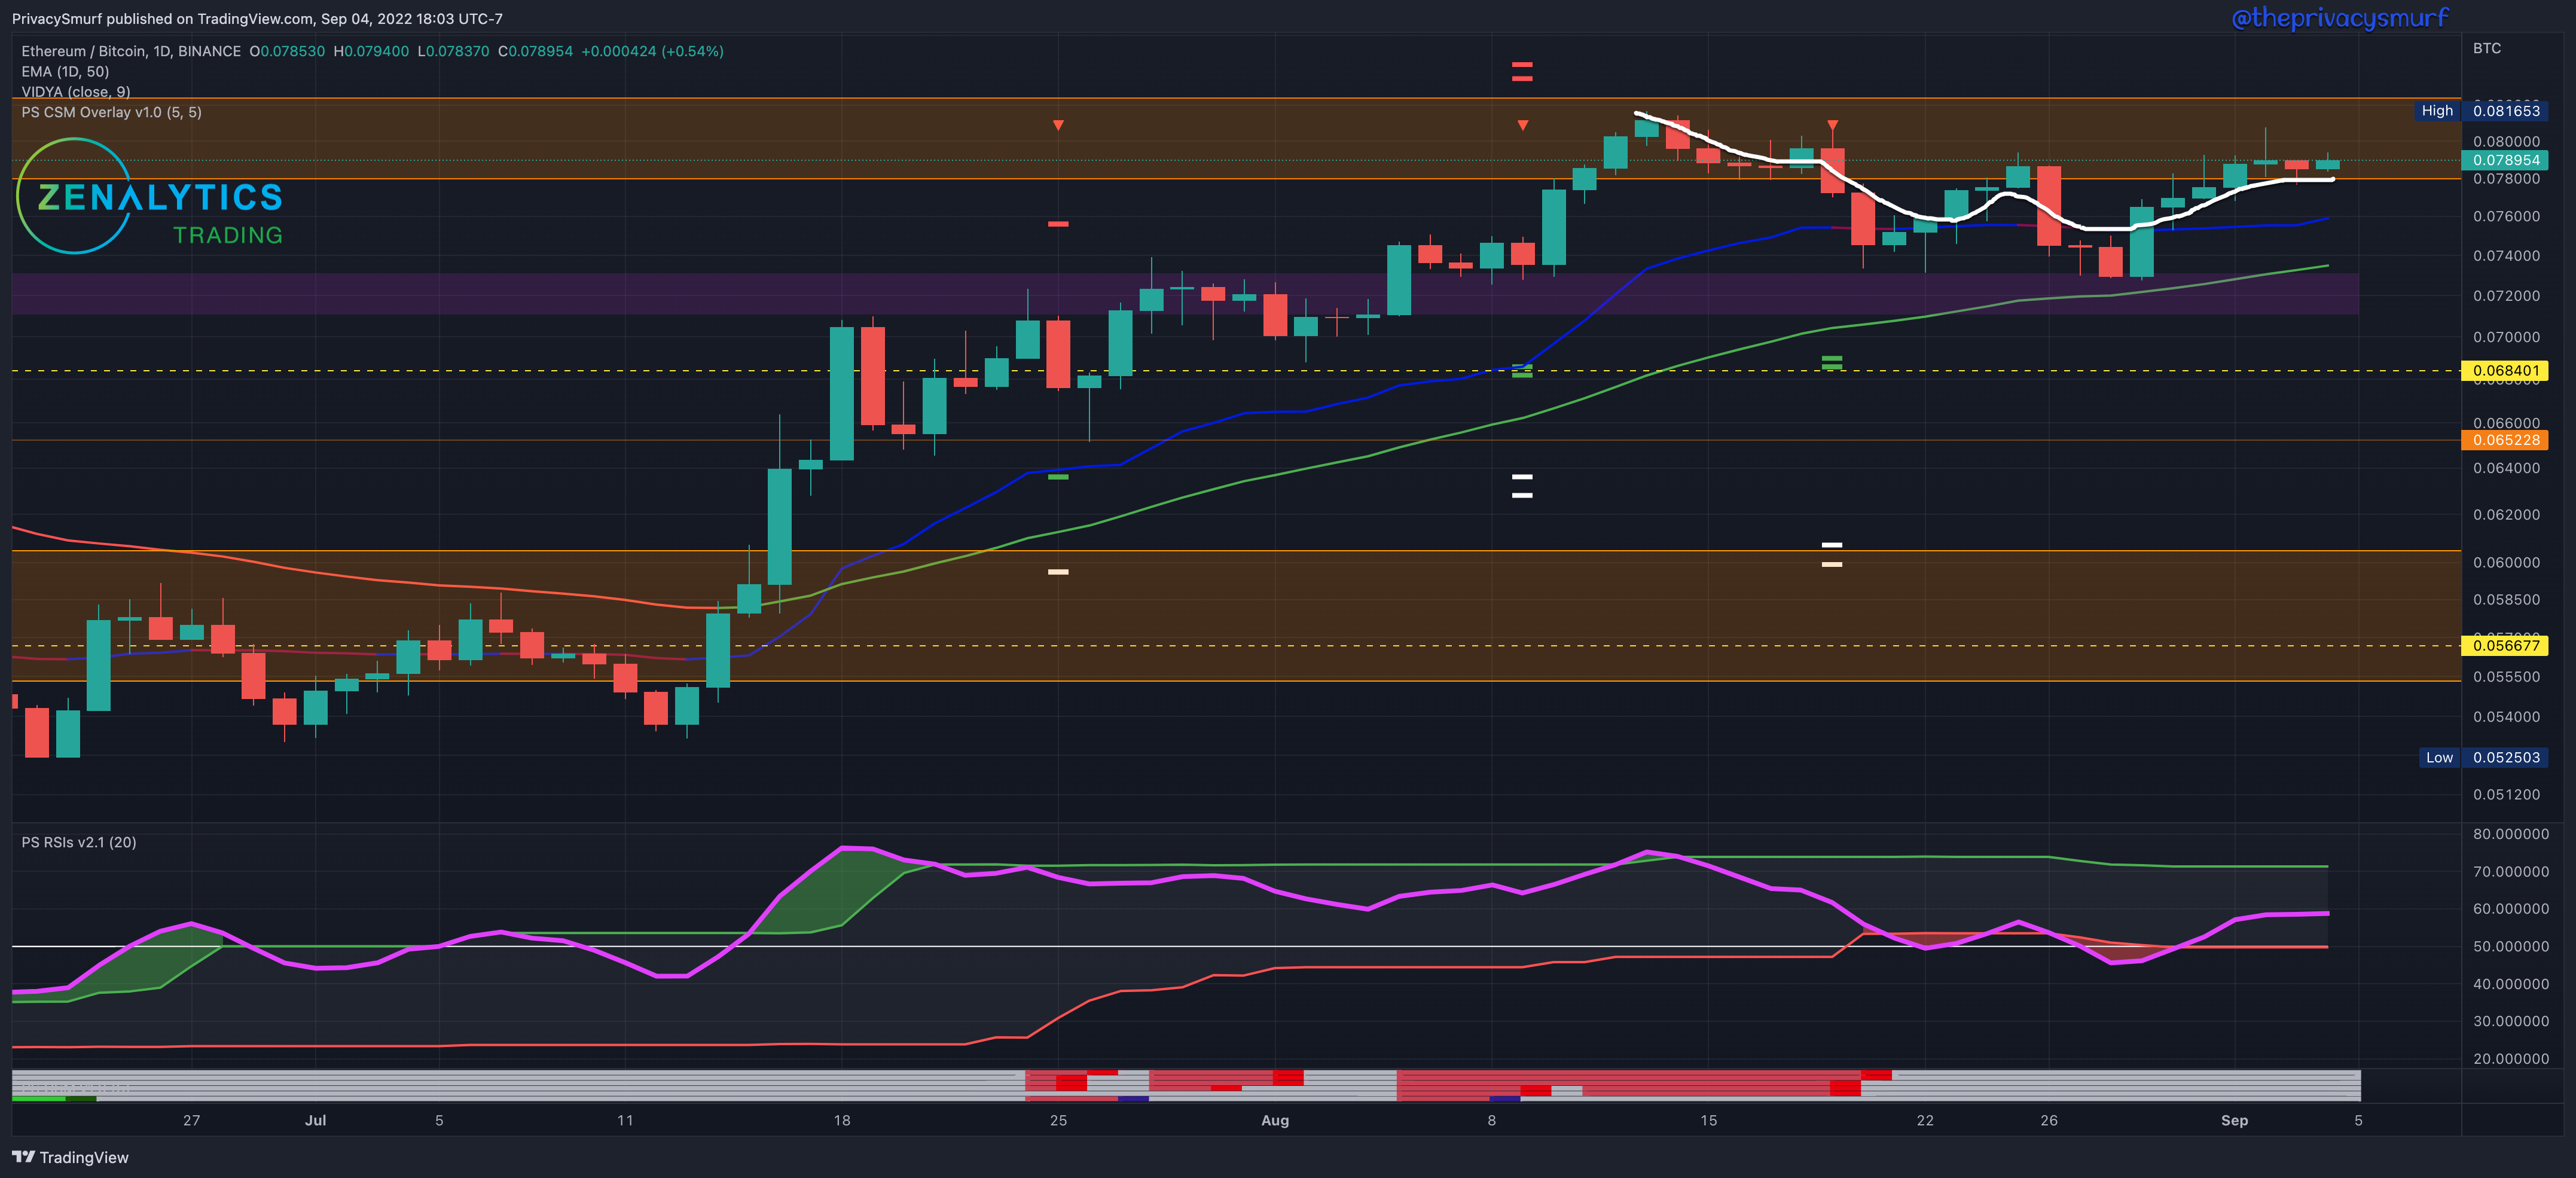
Below we can see the current action is consolidation. There WAS a bearish series of lower lows and lower highs, but now after a lower low, we have a higher high. This negated the bearish trend and creates a sideways market.
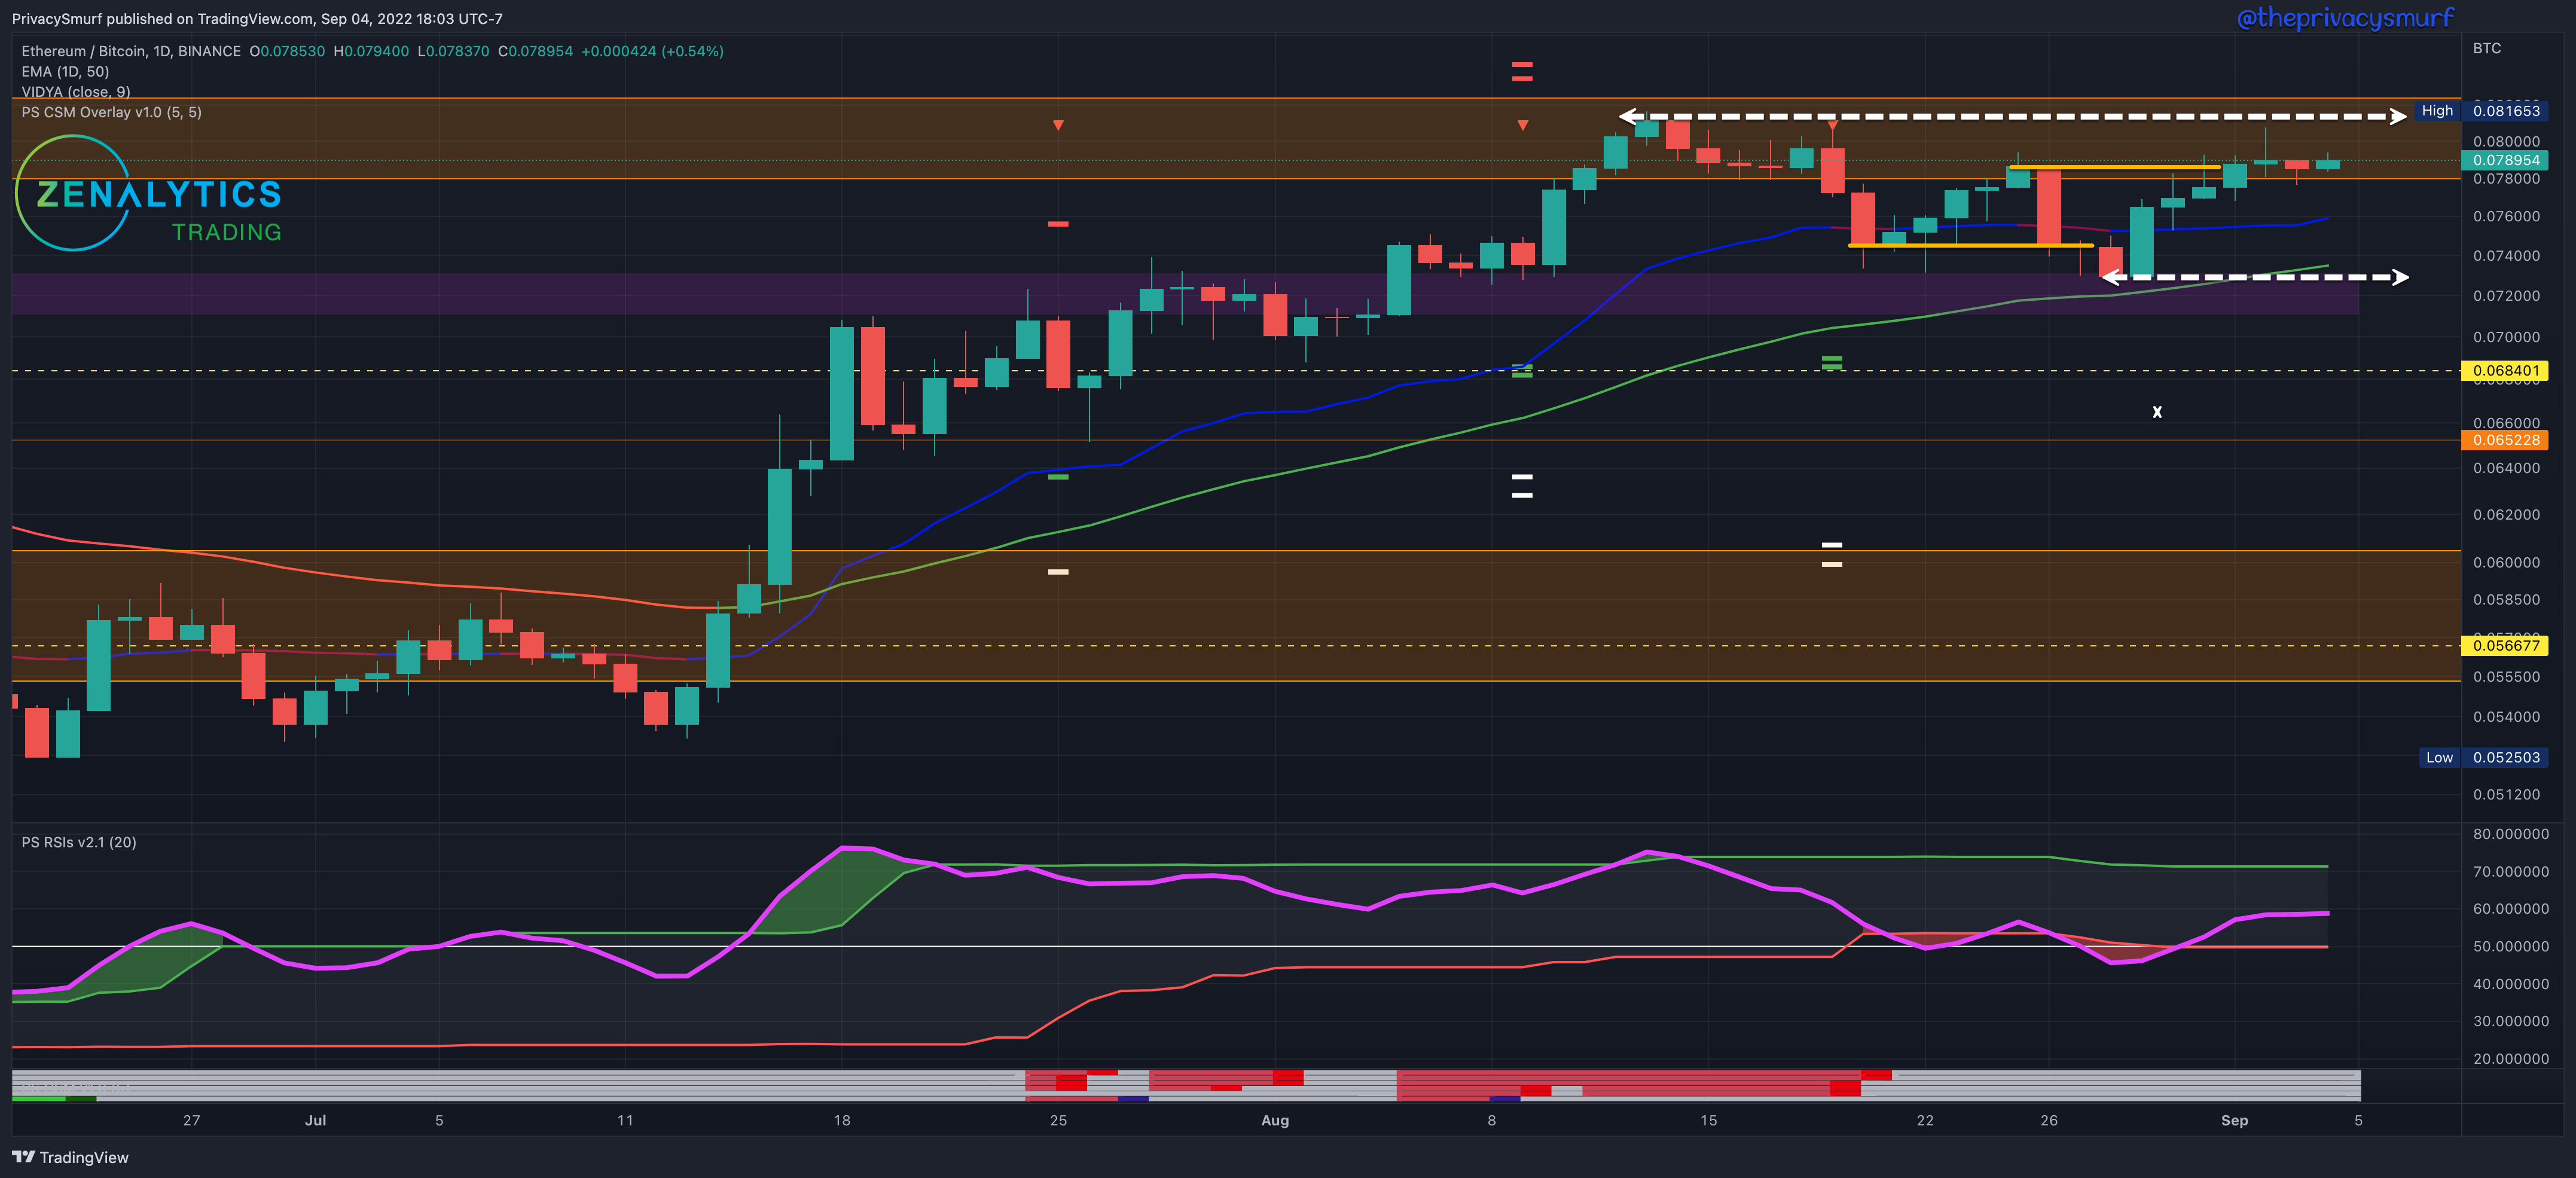
Until divergence forms, I’d expect the consolidation to continue from the range high to range low depicted by the white dotted lines until a higher high or lower low forms, then I’d be playing for continuation in that directionality.
ETH/USDT Daily Chart
https://www.tradingview.com/chart/xbB6lkZu/

From last week:
“If ETH can manage to keep out of the prior range when/if BTC stabilizes inside its old range, that would give me a reason to suspect a greater return in ETH once the market returns to bullishness.”
The bearish expectations didn't play out last week as the floor support zone was still held early in the week. There weren’t new highs like the ETH/BTC chart so the bearish trend remains. The wedge-like structure remains as well and may eventually lead to some volatility.
Given the current technicals, the RSI (yellow arrow) being below the midline and in line with prices, the Correction Strength Meter (white arrow) not presenting any bullish potential, and bearish targets still in play (green arrow), I’m leaning toward bearishness this week. I’d expect top-side prices to be limited to current resistances at $1650 near the 50-Day EMA and potentially wicking prices towards $1350.
Final Q3 Forecast Update
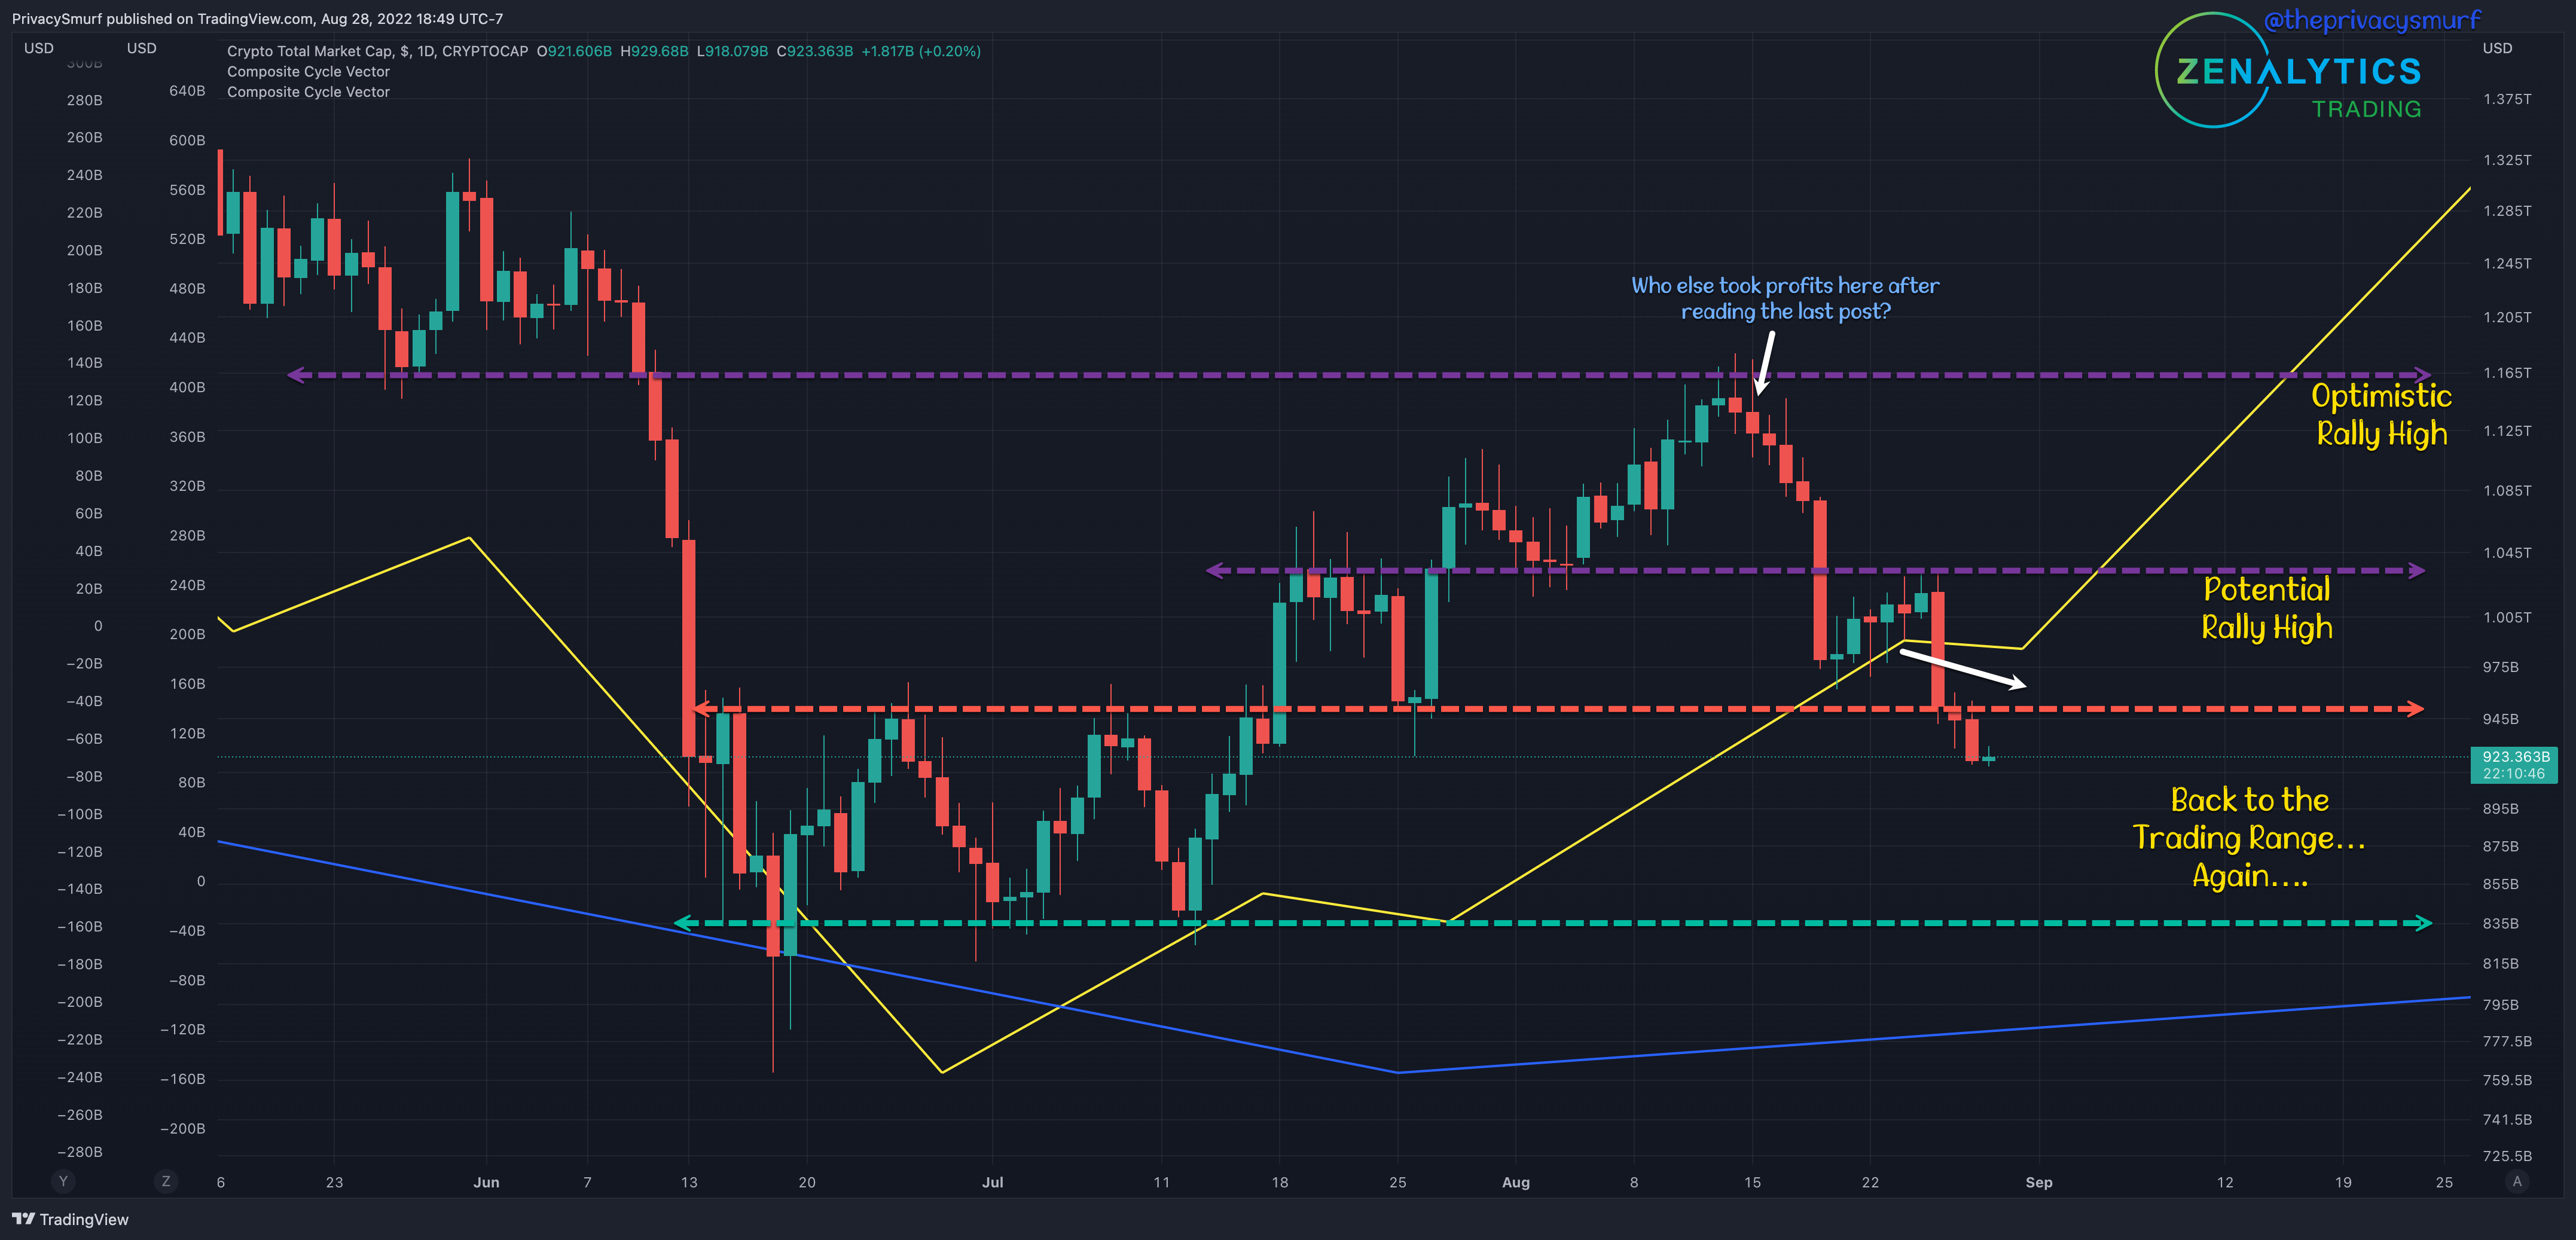
I’ll leave my notes from last week on my current expectations for the end of the quarter. Something to consider taking recent price action into account, as we recently lost the support from late July and are in a daily bearish trend of lower highs and lower lows one must entertain the possibility of ranging at the same lower levels from June and July to consolidate and rebuild confidence in the market. Below I’ve labeled the potential areas of this forecasted Q3 bear market rally peak. This is PURE speculation and should be taken with the biggest grain of salt. Price action will always dictate my actions, and this type of rumination on hypotheticals is just for fun and to flex my creative muscles.
Here’s that forecast in case you missed it.

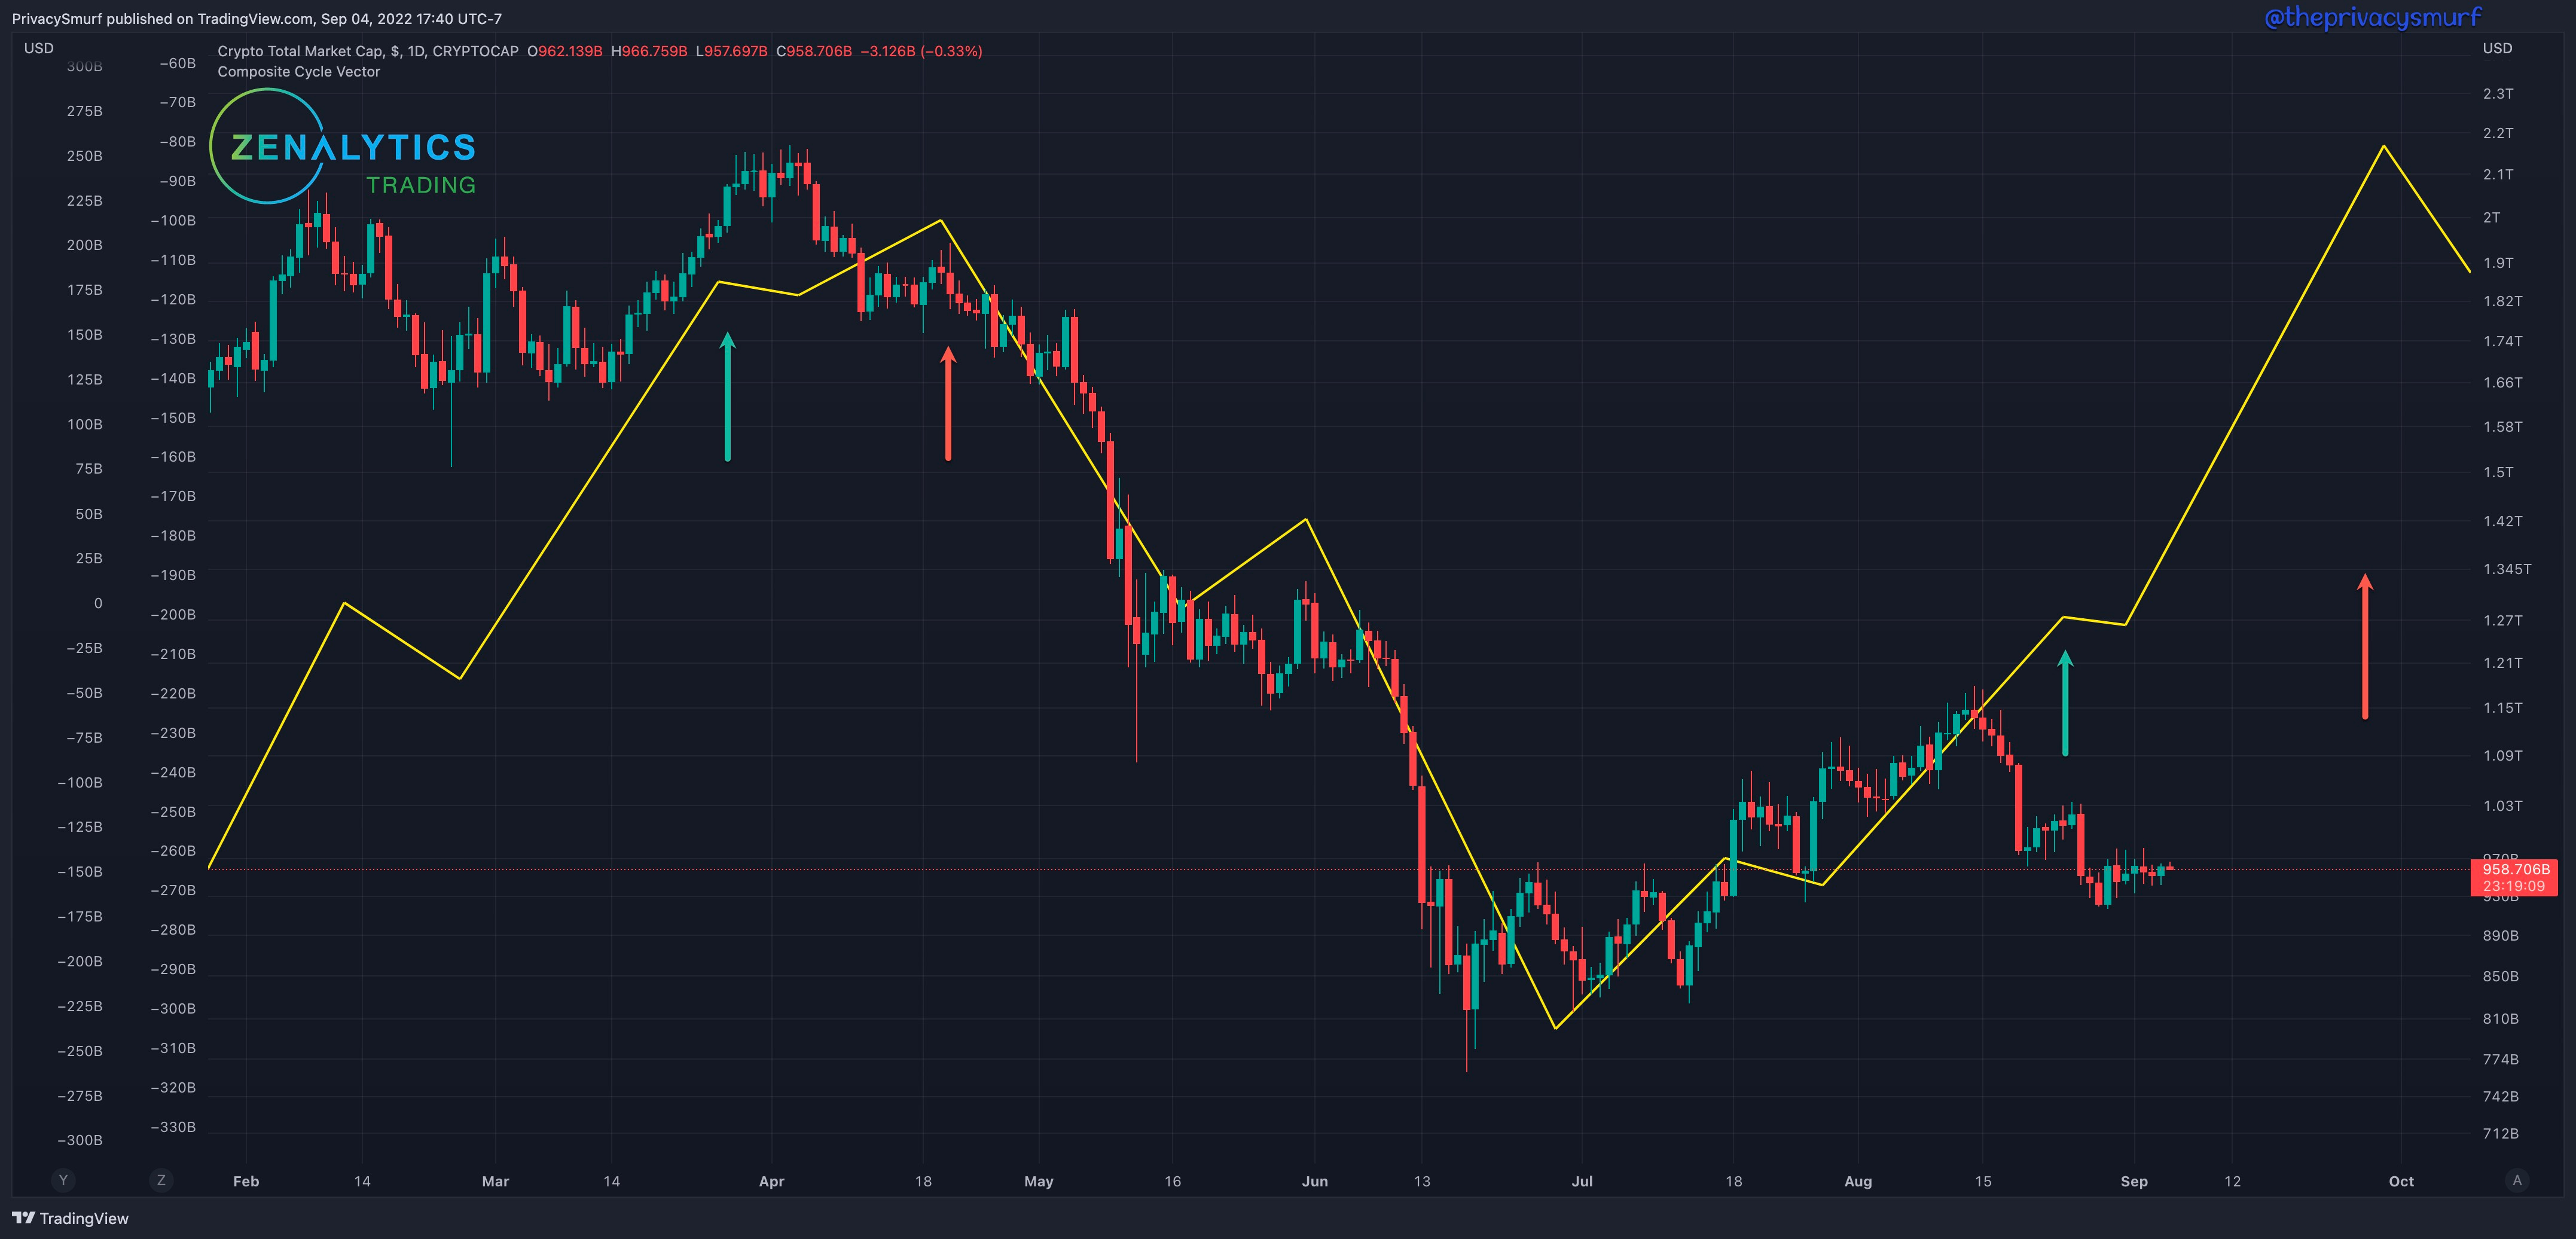
Expanding on the above photo, I’ll highlight some parts of cycles that can appear. Below I’ve noted the minor peaks in the major cycle. The first series is something that can appear where a peak is measuring higher amplitude, but the price finishes lower. This potential may also be set up again here at the end of this quarter, and we end with a lower high than the August price peak.
I’ve also observed the opposite, with the second cycle peak lower and the price finishing higher. This is often presented with a bearish divergence between prices and oscillators.
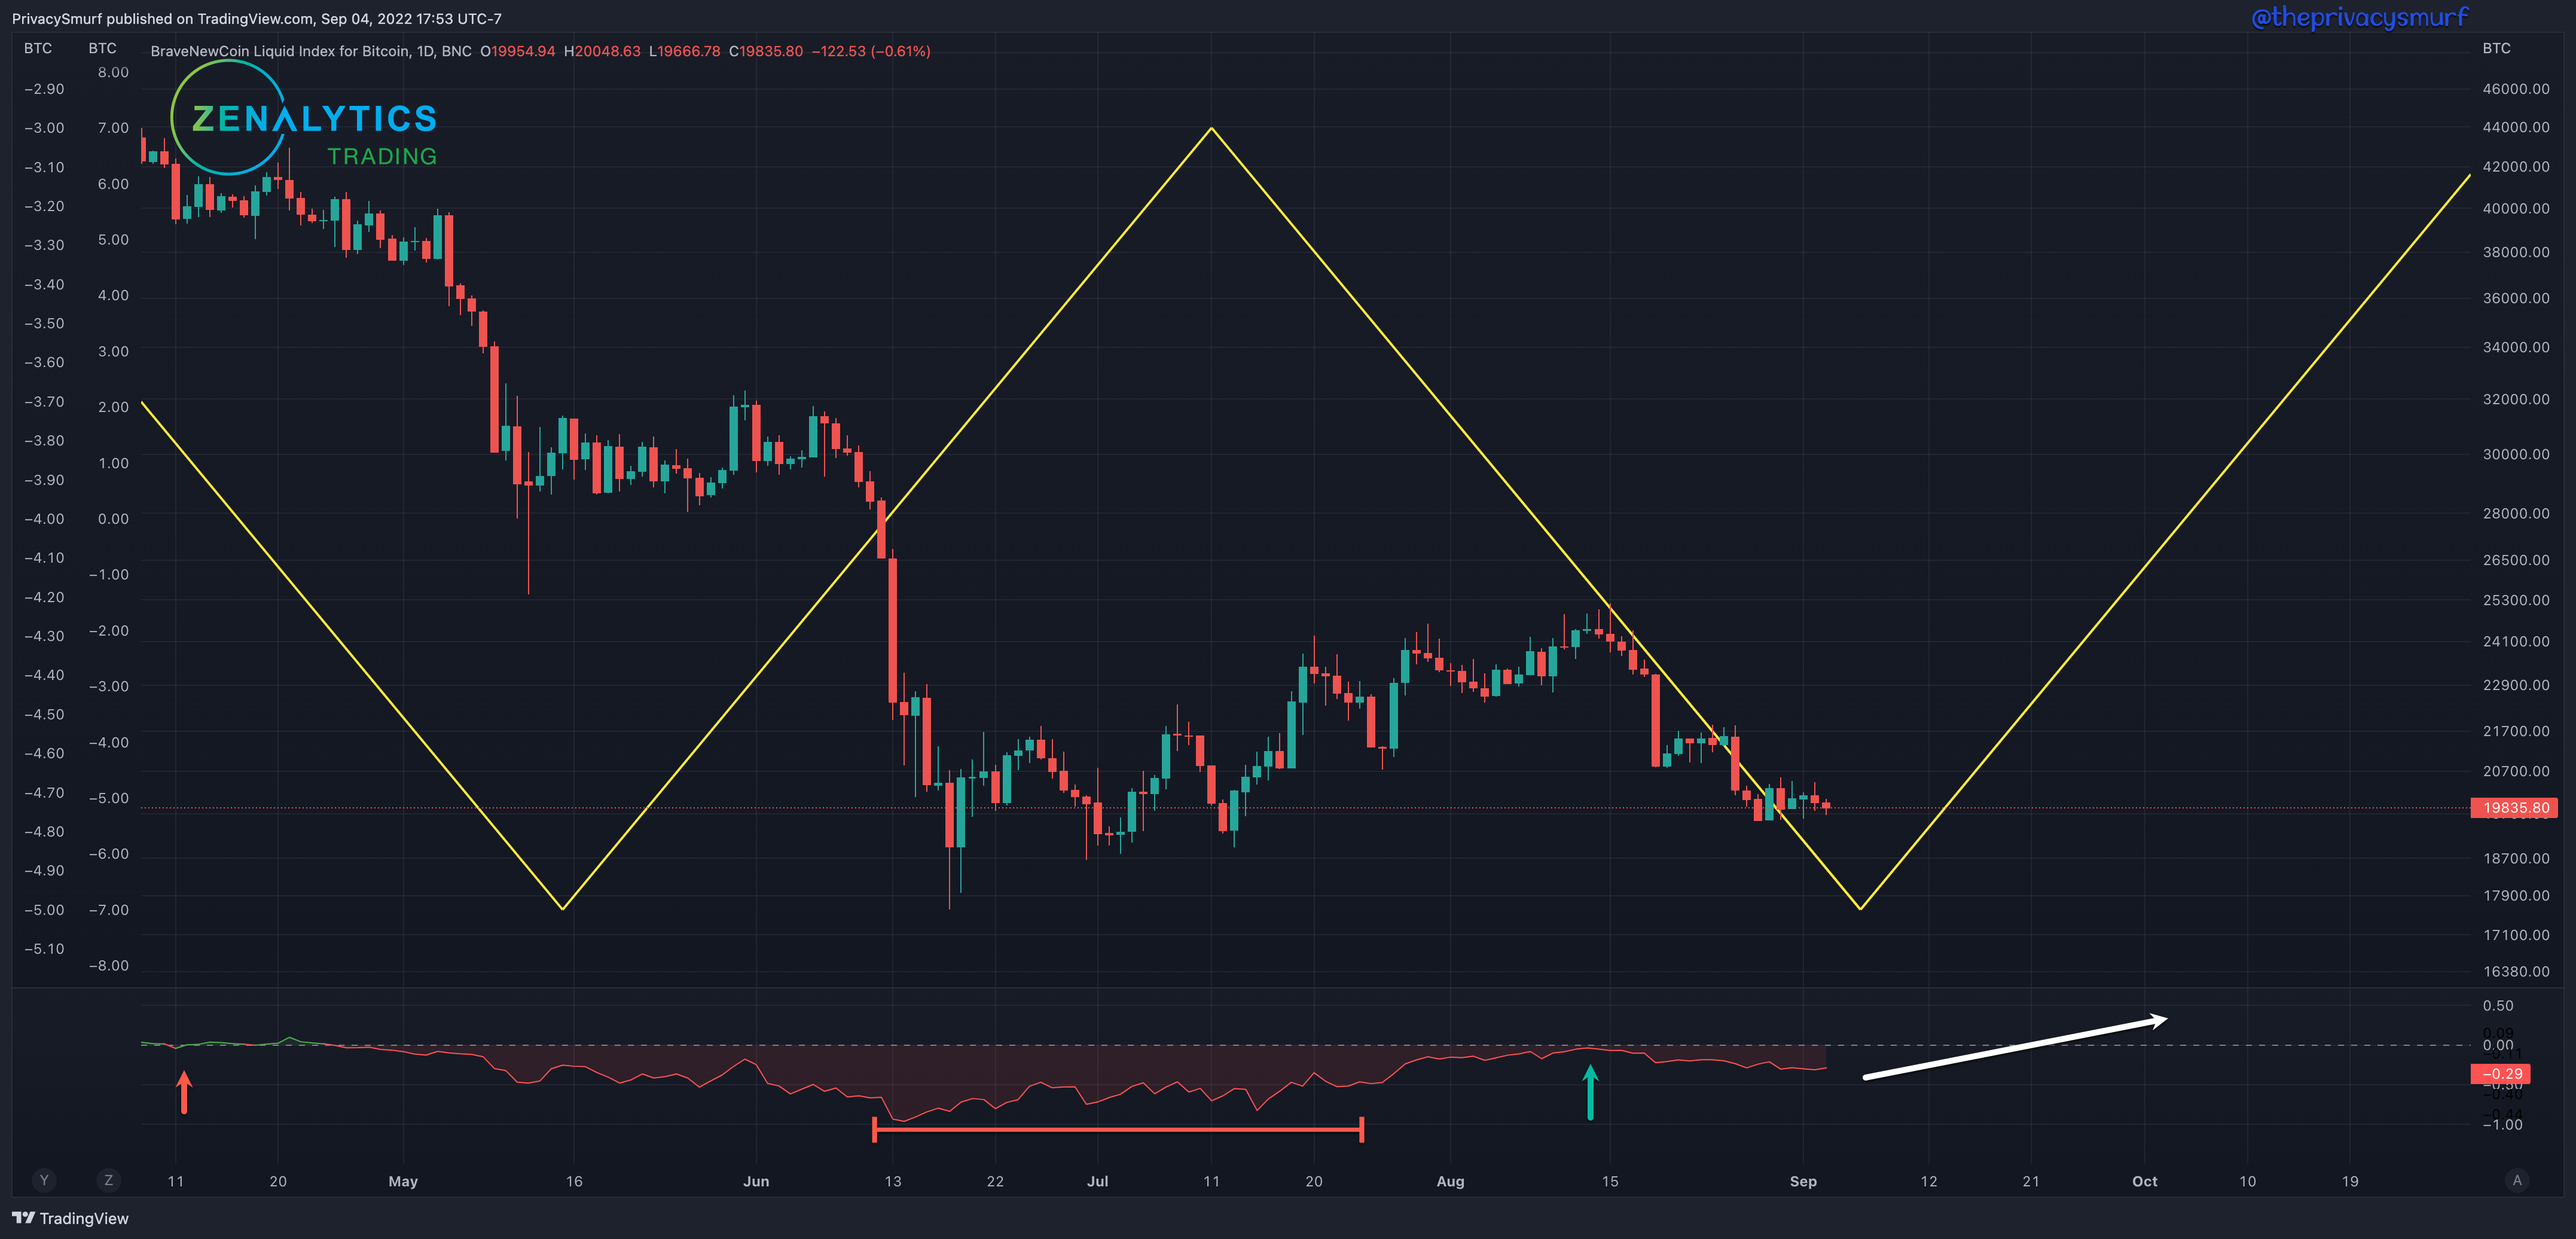
Another aspect of the Q3 forecast supporting the potential for lower prices to end the quarter is the weekly Bonds forecast is now entering a downward leg. Bonds are still maintaining a positive correlation with BTC (white arrow). If that remains, I would expect BTC to follow the Bonds pricing lower.

The final piece from the Q3 forecast is the Adjusted SOPR presented at the bottom of the chart as an oscillator. This is a representation of coins being sold for a loss or profit. Historically the aSOPR has inverted from the cyclical behavior after a peak & crash in the market for three repetitions before returning to alignment. The oncoming upward leg would be the 4th turn of the pattern (white arrow). I’ve noted a few other points. The red arrow shows the measurement turning negative. This is a representation of the majority of coins being sold for losses. The red line segment at the center IMO would be people selling en masse in expectations of lower prices. As time moved forward the aSOPR almost reached a net positive measurement. This move towards more profitable transactions may have been the profitable sales by people who bought in the lows of July and fewer people selling in fear.
The section of white where the cycles align may mean that lots of short-term held coins are being sold in profit and may be the continuation of bullishness.
The section of white where the cycles align does not always immediately translate into a bullish move. It could be represented by large amounts of long-held coins (think years ago from whales) in dramatic profit being sold onto the market. This type of selling would be enough to move the market down further. At the moment, I’m leaning more towards bearishness than bullishness, given other technicals supporting that theory.
The final part of the risk management article will be out tomorrow on top of the new Market Structure Monday post, followed by Trading Range Tuesday with the new altcoin addition.
@theprivacysmurf
Please send me the discord membership info and a sample of what it’s like. Allan told me about it. Can you send it over chat on Mighty nation? Or etc?