

Sunday Synopsis #53: I'm Back
Sunday Synopsis #53: I'm Back
What a gem of an album, lol.

*Lol. I had no idea this was a thing. You are welcome. And wow.. this whole album… lol. I’m wondering if this was a serious endeavor. This seems so random and unnecessary but hey, chase your dreams. It reminds me of the time Garth Brooks did a whole album as an imaginary Australian rock star (Chris Gaines, look it up. It was weird and out of nowhere too.)
Vacay was a wonderful time, and I’m excited to return to the charts. I’ve got many, many things dropping soon.*
BTC/USDT Daily Chart
https://www.tradingview.com/chart/jjSdFW4b/
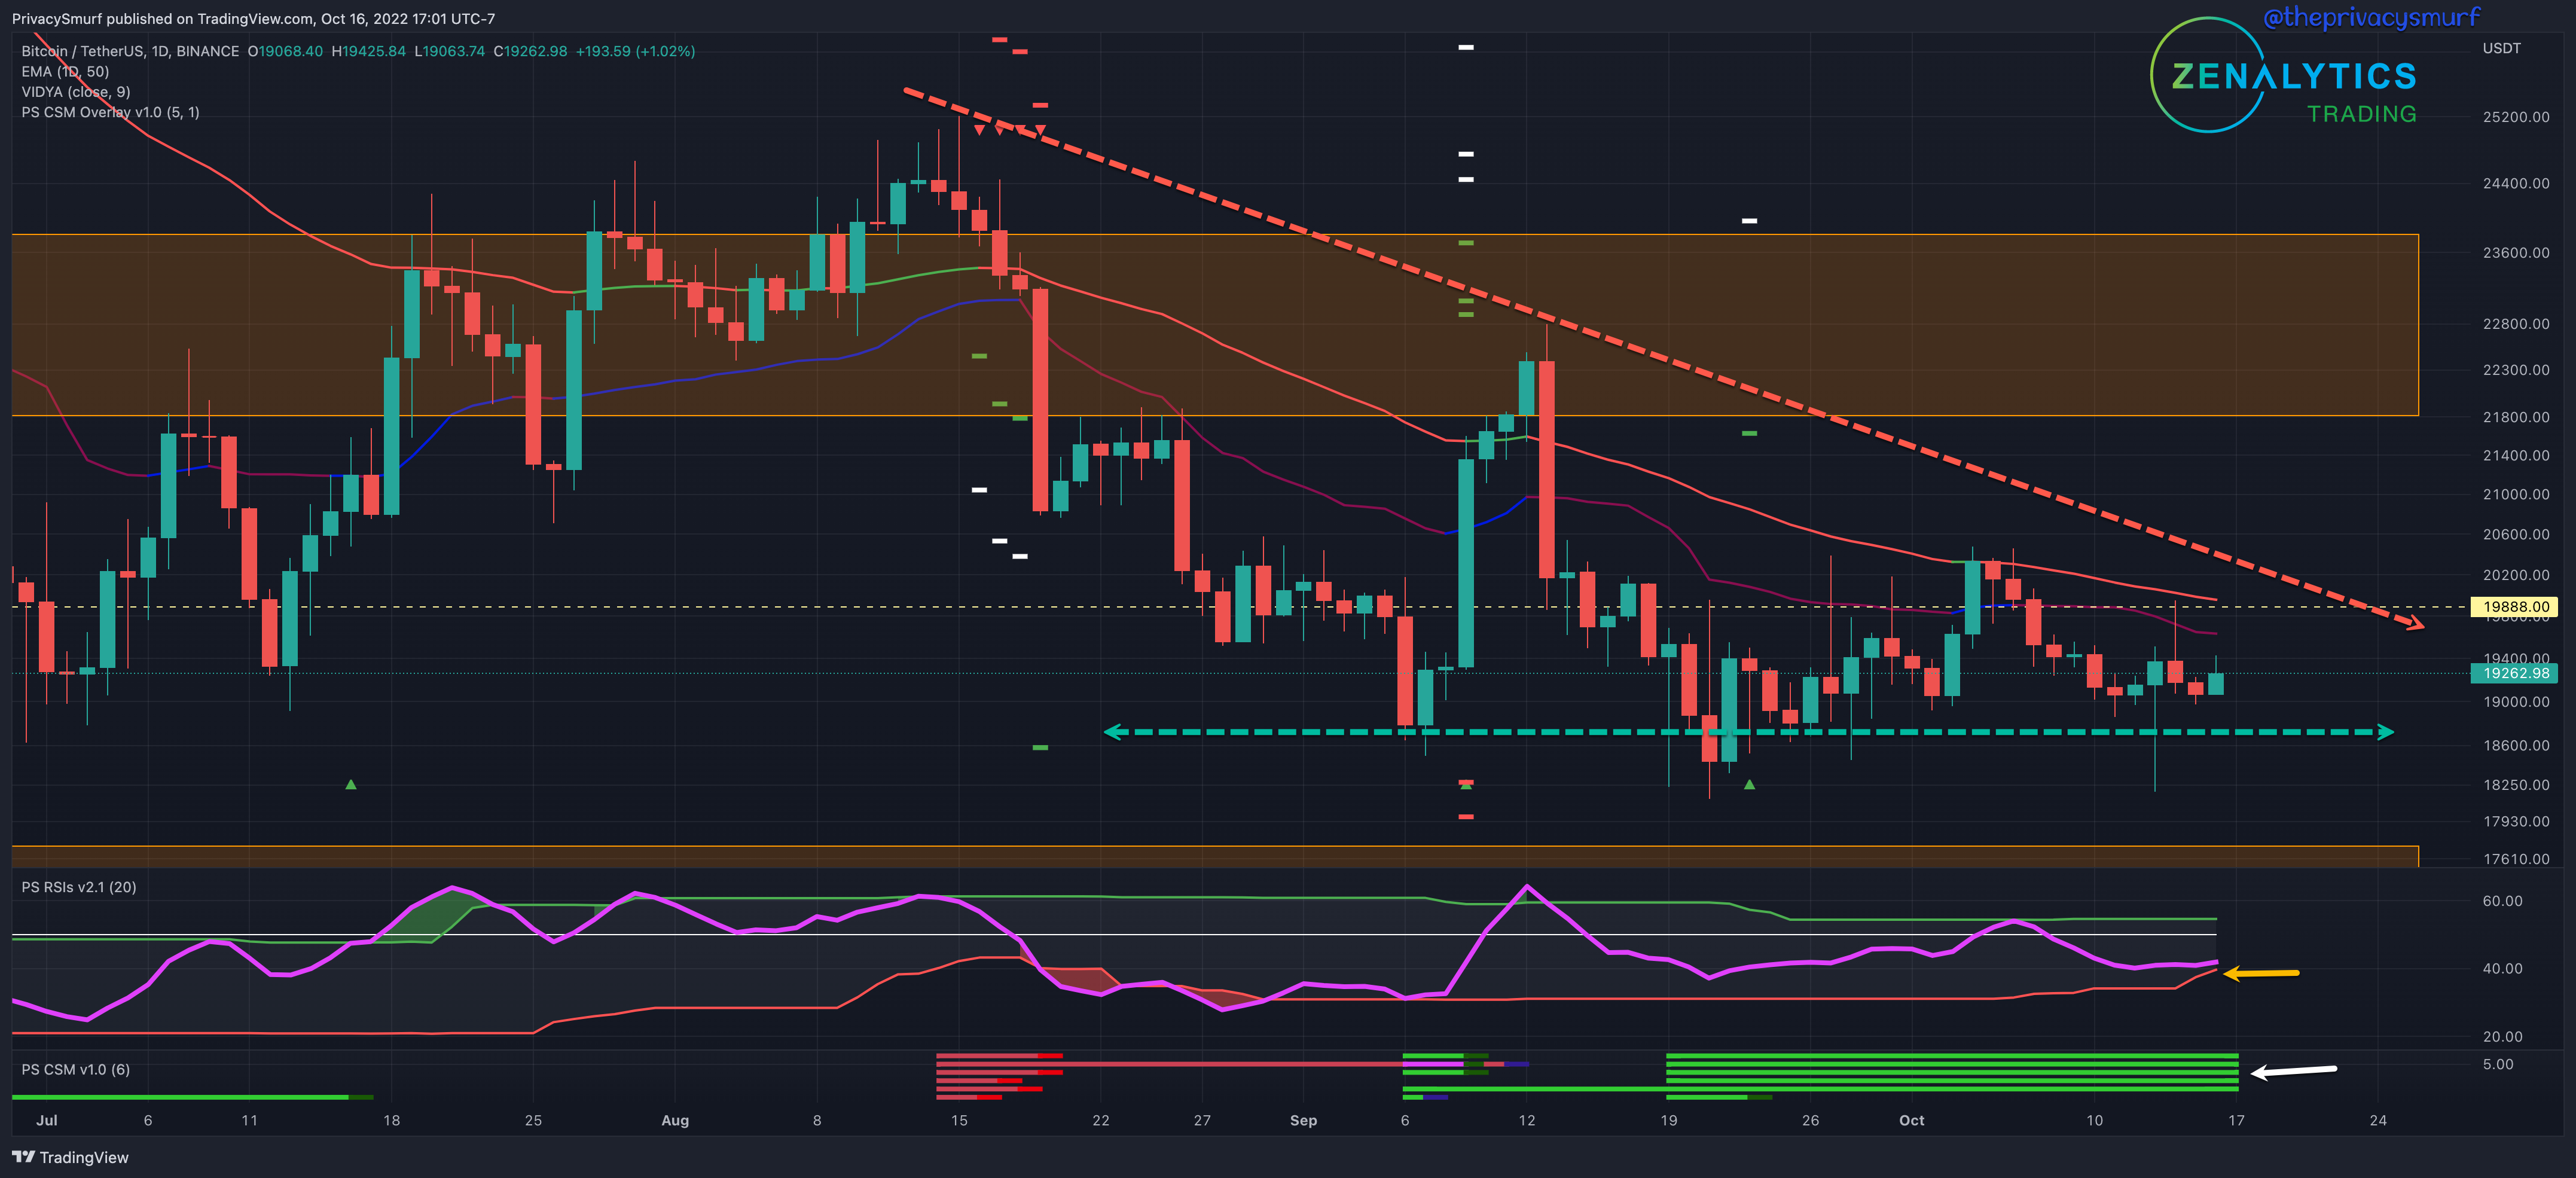
The last post's technical suggestions included a bullish break topping around $21k. The break from the wedge at the time played out as expected. The cyclical intraday timing indicated in early October also led to a strong 2-day rally stopping at the 50-Day EMA and retracing back to support levels. Extending the wedge out now from highs illustrates an even longer compression of prices. At this moment, however, the potential for bearish volatility is increasing. This is indicated by the adaptive bottom band of the RSI (yellow arrow). If the RSI breaks down from this band, I’d expect it to be matched by prices wicking below local support. One bright spot is the continued bullish divergence on the CSM (white arrow), which suggests the potential for a bullish reversal when conditions are triggered.
Given the current technicals for the week, I would anticipate continued bearish pressure on prices, limiting top-side prices under recent highs at $20.5 to $21k unless the RSI manages to turn up, but that’s something to monitor as the week continues and isn't the current outlook. If the RSI breaks down, I’d be looking for sub $19k prices, at least with wicks on the daily chart. At the moment, I’m not anticipating prices under $18k. The likelihood of another bear market rally increases the longer we stay above $18k. There will be more on this in a few days in the Q4 Forecast.
ETH/BTC Daily Chart
https://www.tradingview.com/chart/gTkSjkj6/
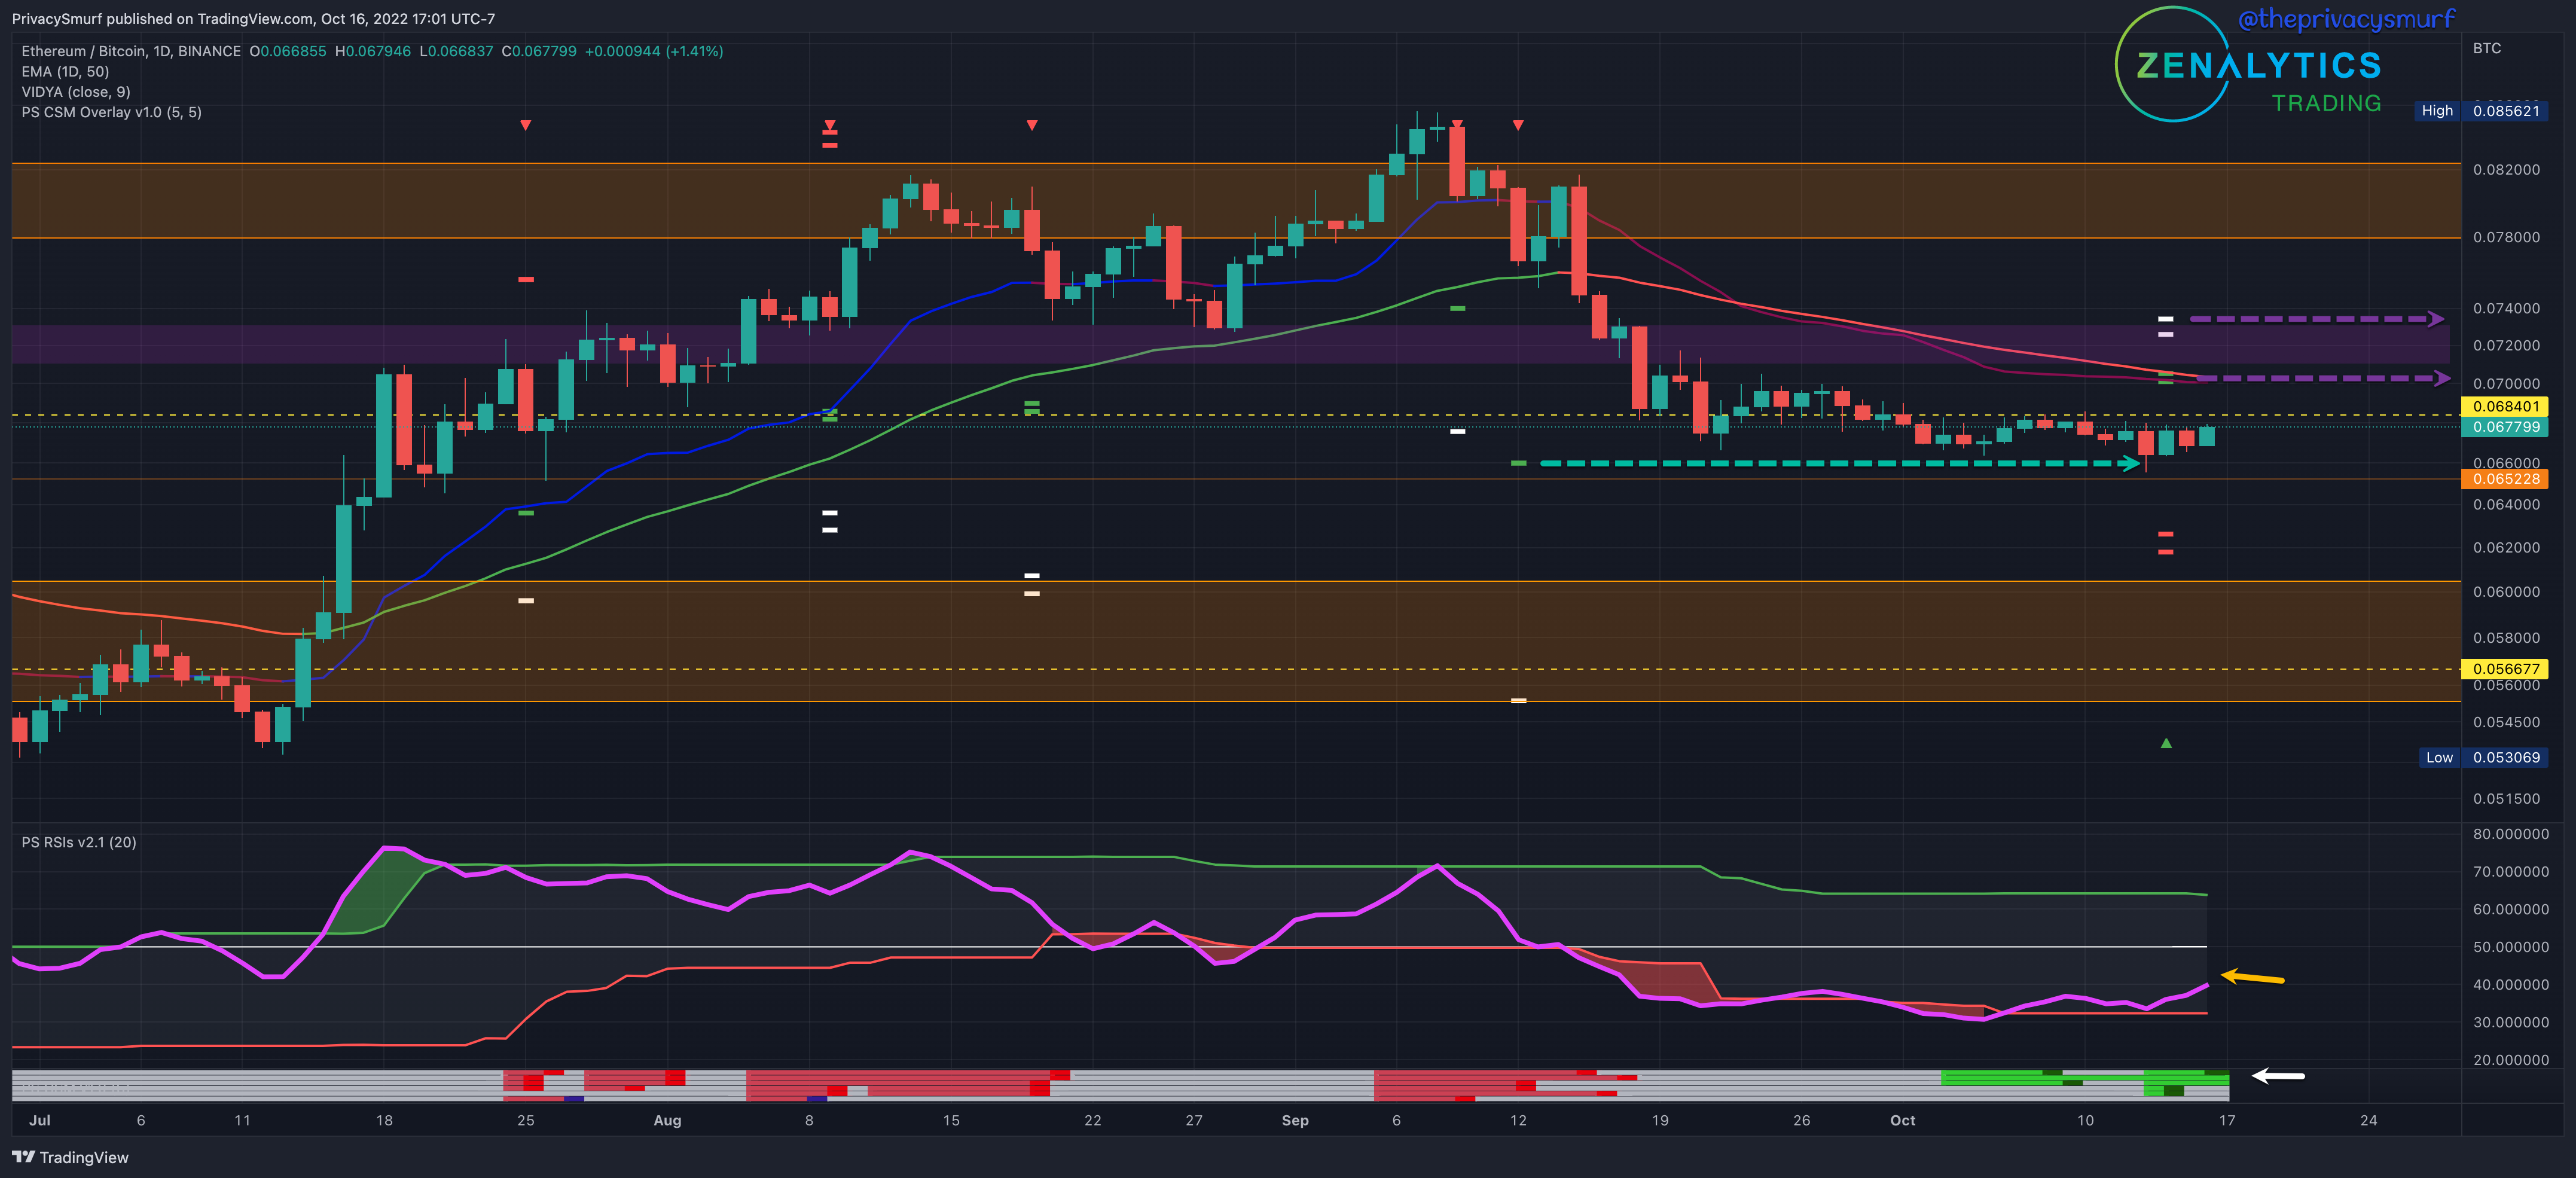
The last post's technical suggestions were that the bearish volatility had been exhausted with no bottoming signals to anticipate a rally at the time, ultimately waiting for divergence. This also played out as expected. There was minimal movement in the ratio of ETH to BTC, and all initial downside targets plotted by my indicator, the CSM (dashed green arrow), were met. Recently the CSM has indicated with dark green spots that conditions exist on a few price action oscillators to suggest a bullish reversal is on the horizon (white arrow). This is likely limited to the 50-Day EMA where the initial target resides around the 0.07 mark. The RSI (yellow) is also something to be monitored. This rally may just amount to a midline test and continuation of bearish pressure.
Given the current technicals for the week, I’d expect more ranging but an expansion of that range, essentially starting to set some higher highs and maybe lower lows. There is no reason to suggest changes from current price fluctuations until the RSI can break the midline to the top side. In this event, it’s likely that ETH and alts will start regularly outperforming BTC, and they should be the focus of trades.
ETH/USDT Daily Chart
https://www.tradingview.com/chart/xbB6lkZu/
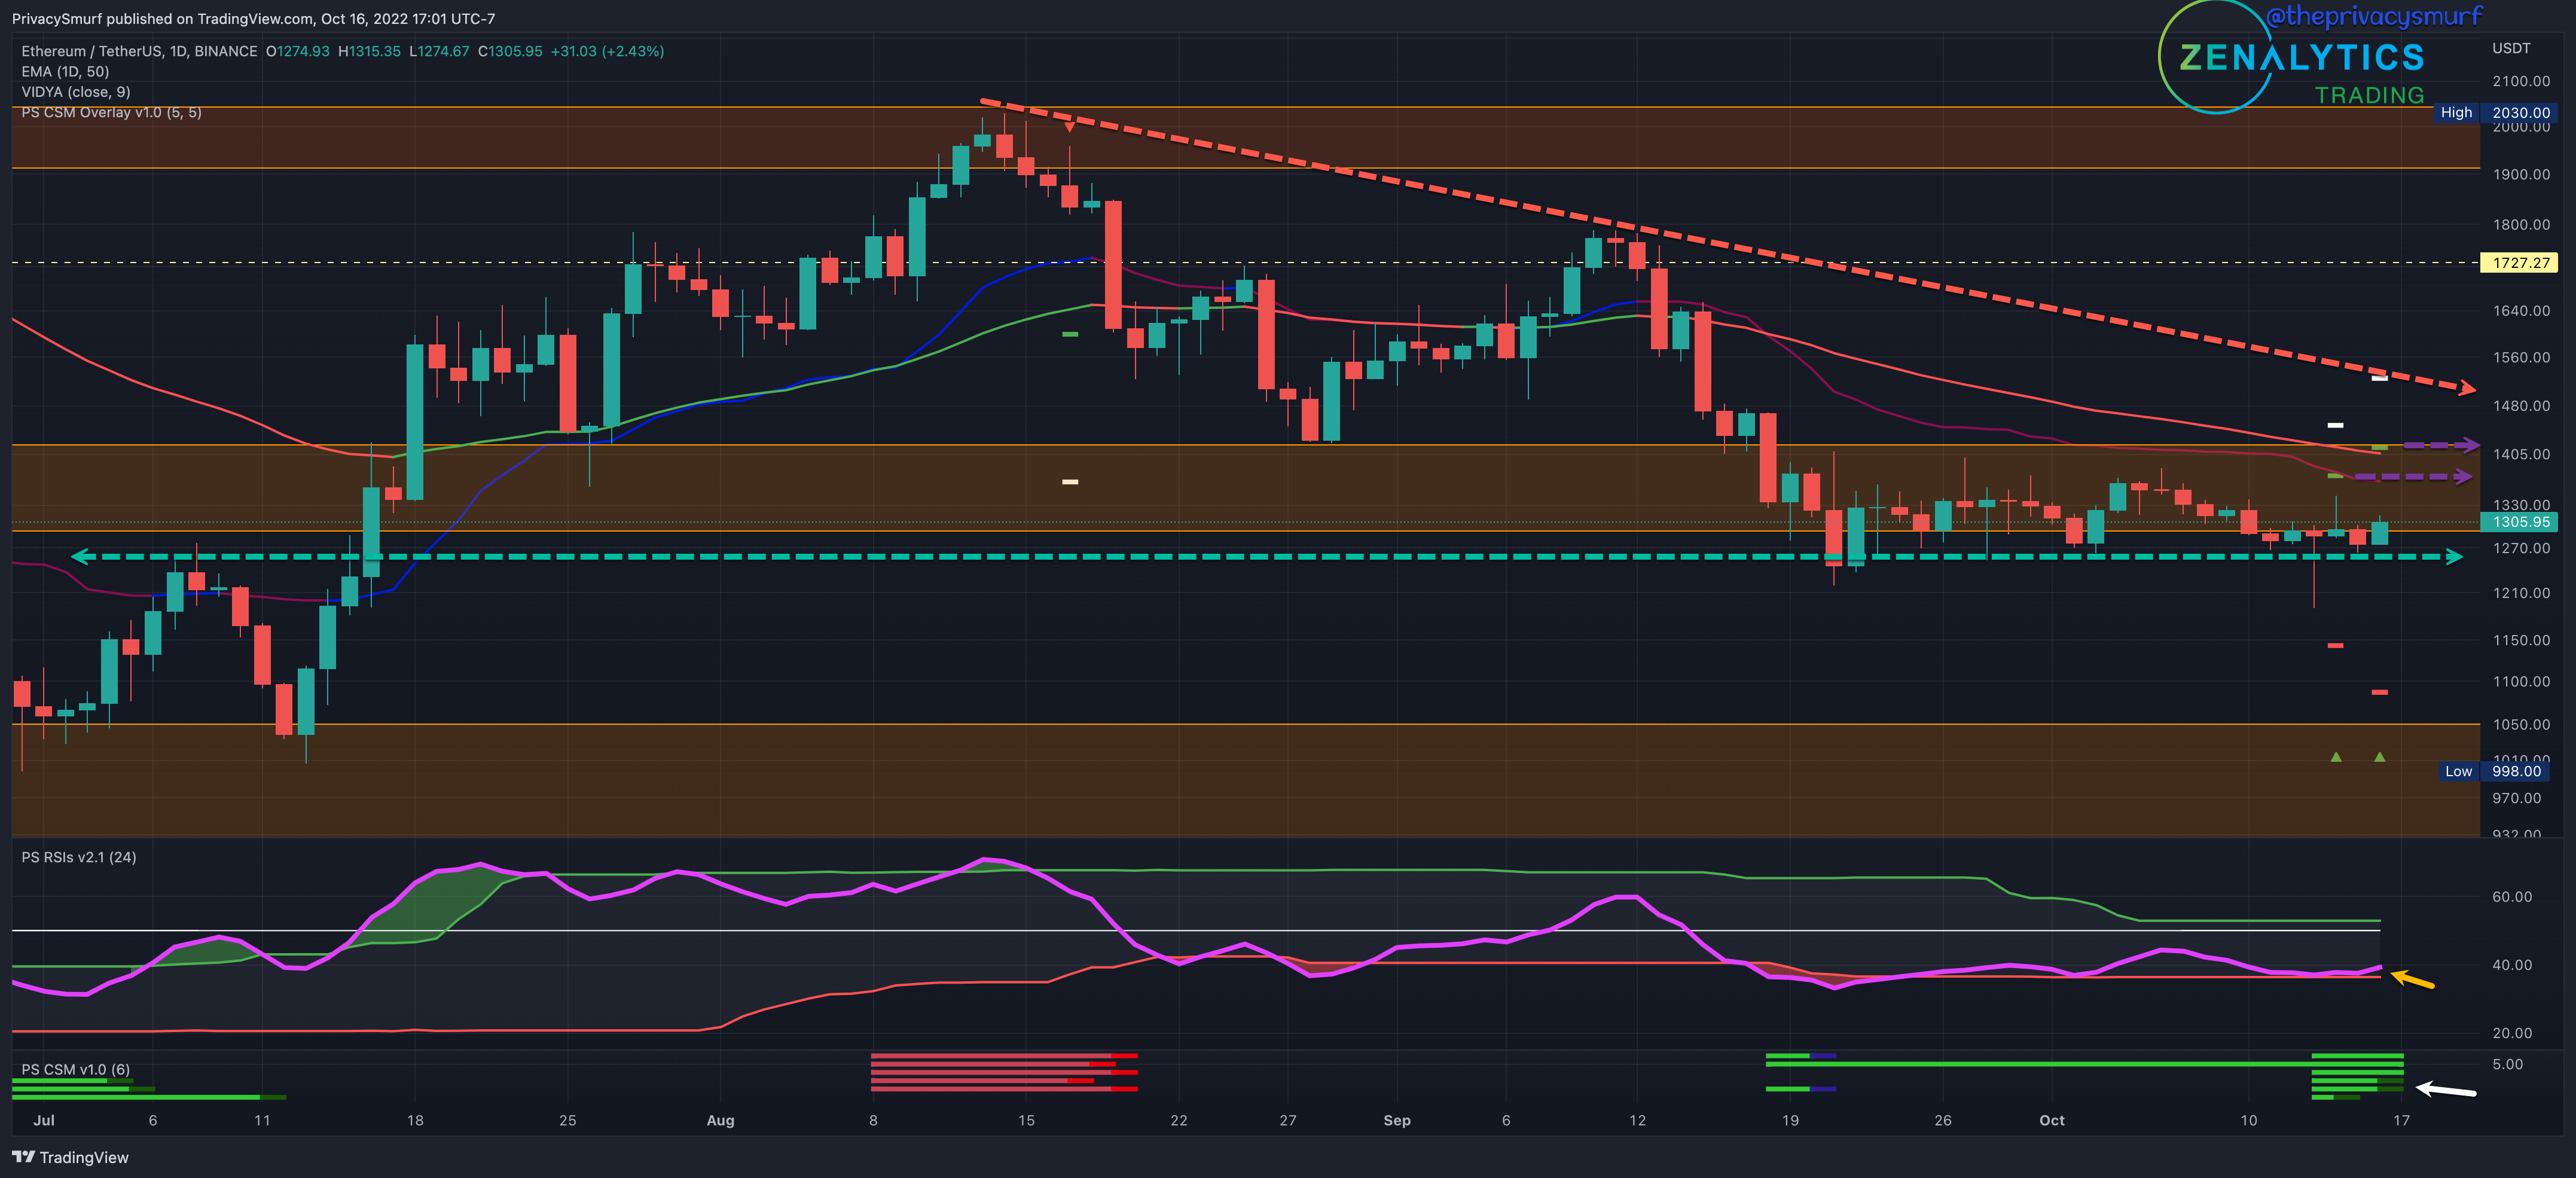
The last post's technical suggestions were continued bearish pressure on price but the exhaustion of the bearish volatility due to the RSI reentering the bands. The RSI manages to stay between the bands and consolidated at support, eventually wicking down to a new divergent low and triggering a bullish reversal signal on my indicator, the CSM (white arrow) producing initial targets of a rally up near the 50-Day EMA from around $1370 to $1415 (dashed purple arrows). The RSI currently stays above the bottom band (yellow arrow), but a breach below will likely translate to more wicks below support. The thing to monitor in that event is whether the RSI stays in a bullish divergent state OR if it sets a new low. We can likely expect lower closing prices and a bearish continuation if this occurs.
Given the current technicals, I’m leaning towards slight bullishness early this week but likely price action that matches the ETH/BTC outlook, an increase of the current ranges, higher highs, and potentially lower lows. I’d expect top-side prices to be limited to current resistances at $1500, which would be a horizontal resistance and a meeting of a descending trendline drawn from highs. The meeting at this price level, if occurring simultaneously as the midline and top band break on the RSI, may translate to a greater price increase up to the $1600 level.
It’s good to be back at it, but I feel rusty looking at the charts after a long break. Hope you can forgive me if this is way off this week. We’ll have lots of posts this week, so be on the lookout in your inbox.
@theprivacysmurf
Welcome Back PSmurf! :) peace
LMAO at the sound track!!!!
Thx for the update!