

Sunday Synopsis #54: Tiny Dancer
Sunday Synopsis #54: Tiny Dancer
You had a busy day today.

This has popped up everywhere lately. It first popped up as a clip of Elton John when he first made it talking about the creative process, a new mashup by Britney Spears in my Spotify, and a TV commercial. Now you are gonna be stuck with it in your head too. At least it’s a good one to get stuck up there.
BTC/USDT Daily Chart
https://www.tradingview.com/chart/jjSdFW4b/
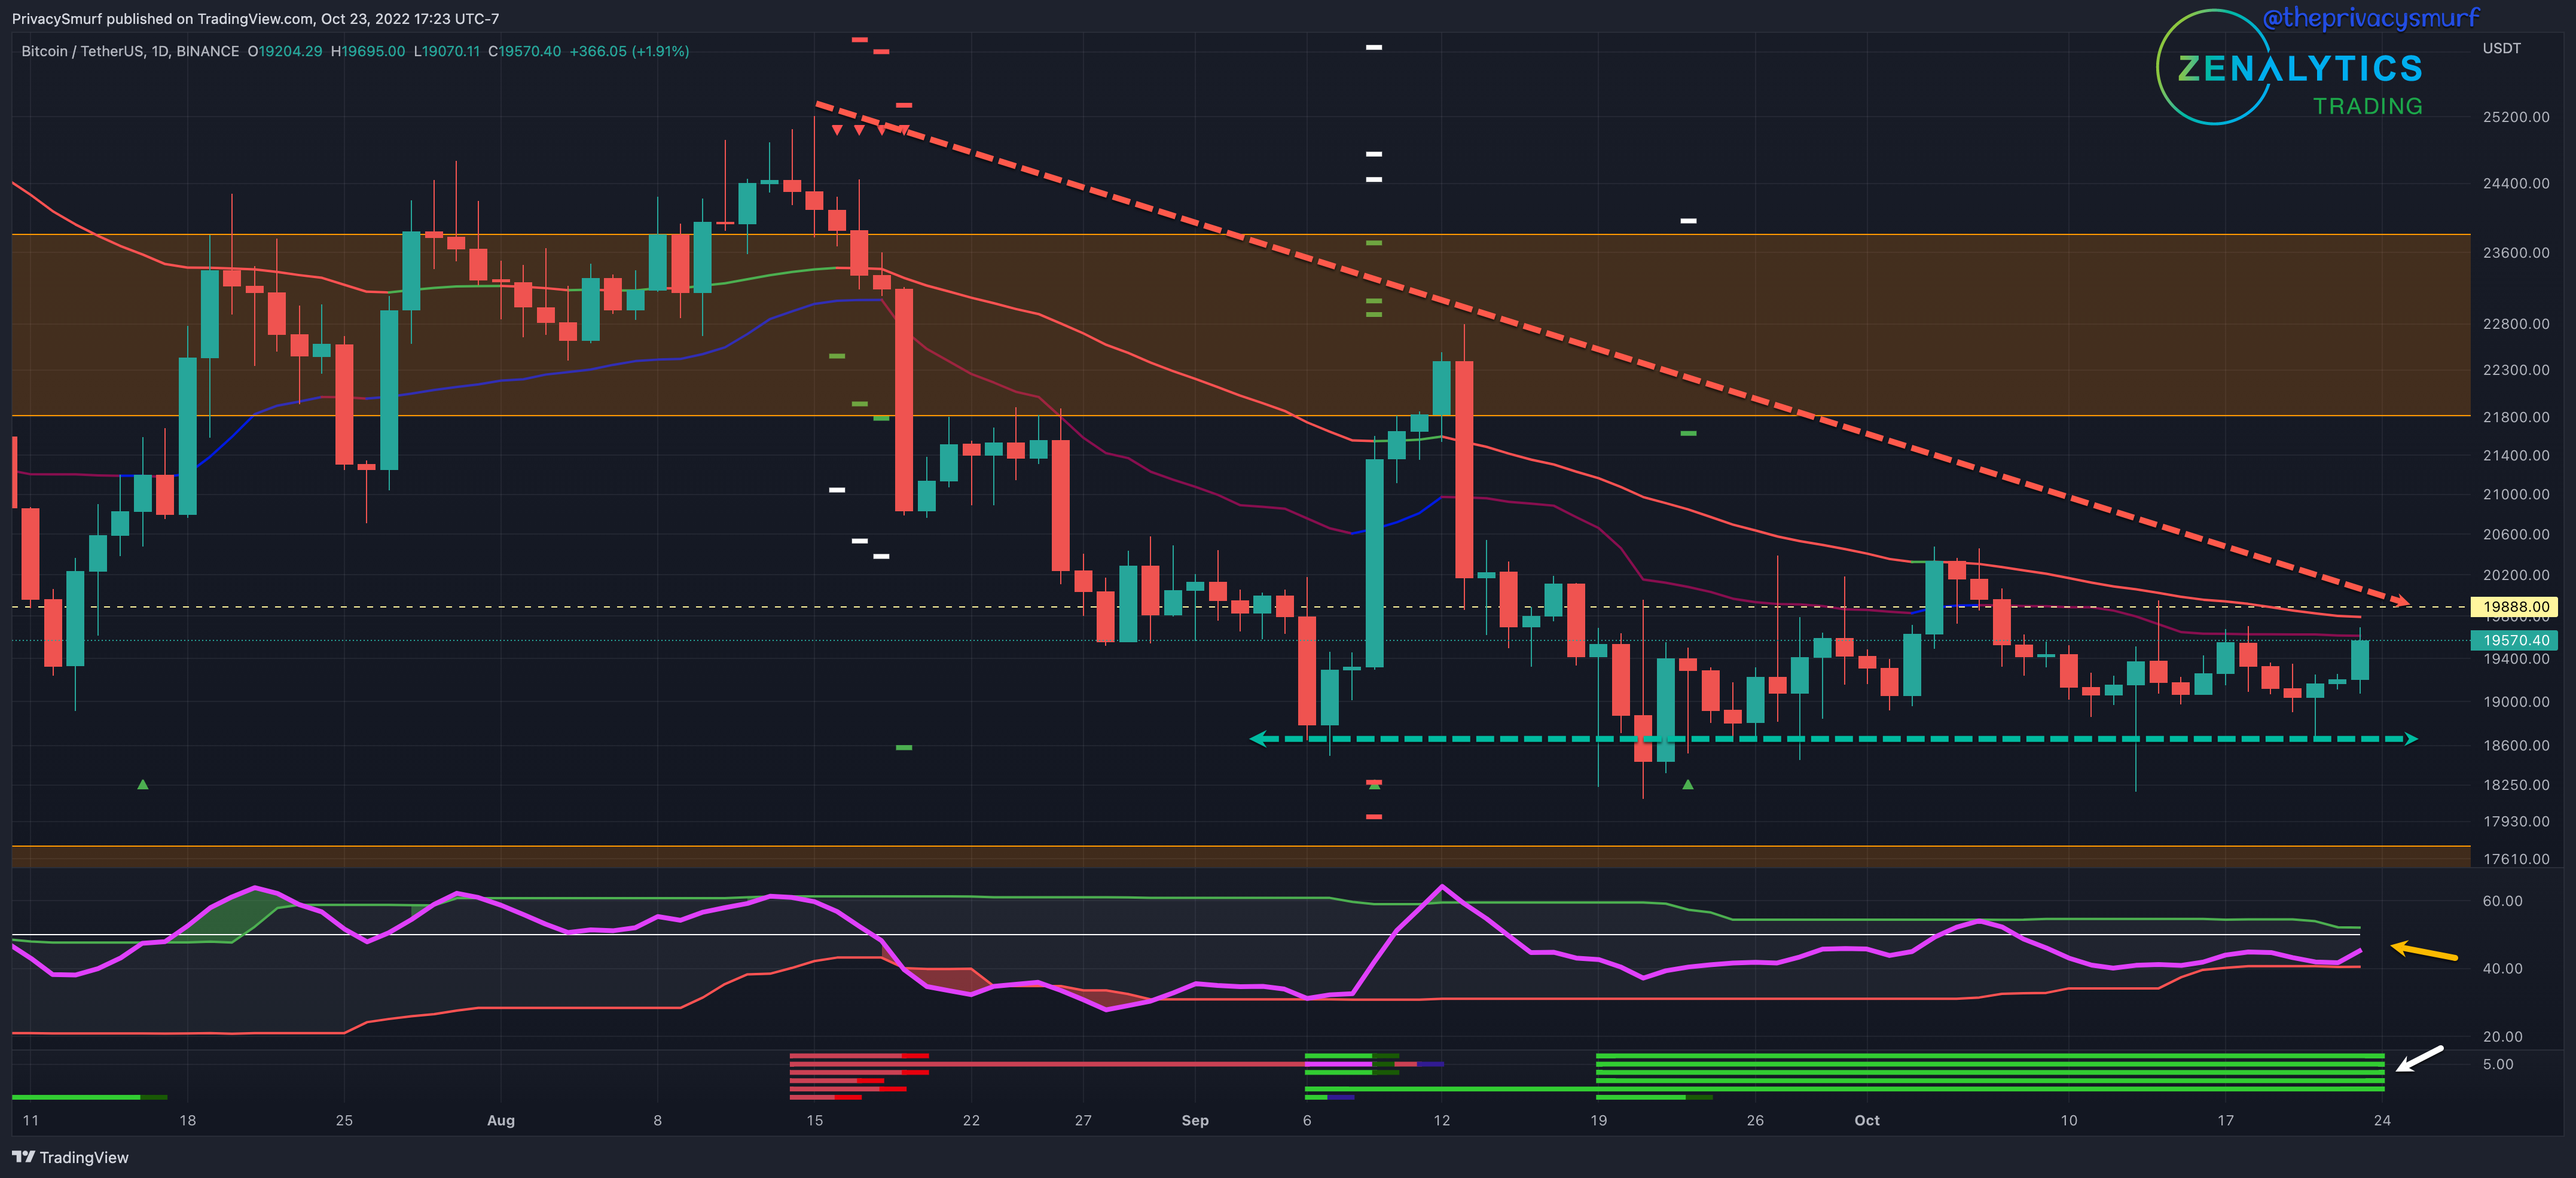
From last week: ”… continued bearish pressure on prices, limiting top-side prices under recent highs at $20.5 to $21k… If the RSI breaks down… sub $19k… wicks on the daily chart… not anticipating prices under $18k…”
There was nothing outside of anticipation with BTC last week. Closing prices largely stayed within the same boundaries. The RSI managed to stay above the bottom adaptive band on the RSI (yellow arrow), which limits expected downside volatility. With both bands close to the RSI and near the midline, we are approaching a moment of potential whipsaw action. The movements of the RSI are critical to determining the directionality. The prolonged bullish divergent conditions signaled by my indicator, the Correction Strength Meter (white arrow), have yet to signal a bullish trade.
Given the current technicals for the week, I’d expect the compression/ranging in the wedging structure displayed by the dashed arrows to continue with a bearish bias earlier in the week. Potentially a low support test with wicks below 19k but eventually a bullish break. The 50-Day EMA may act as temporary resistance, but ultimately, near-term targets will likely return to around $19.9k and $20.2k before November.
ETH/BTC Daily Chart
https://www.tradingview.com/chart/gTkSjkj6/
From last week:
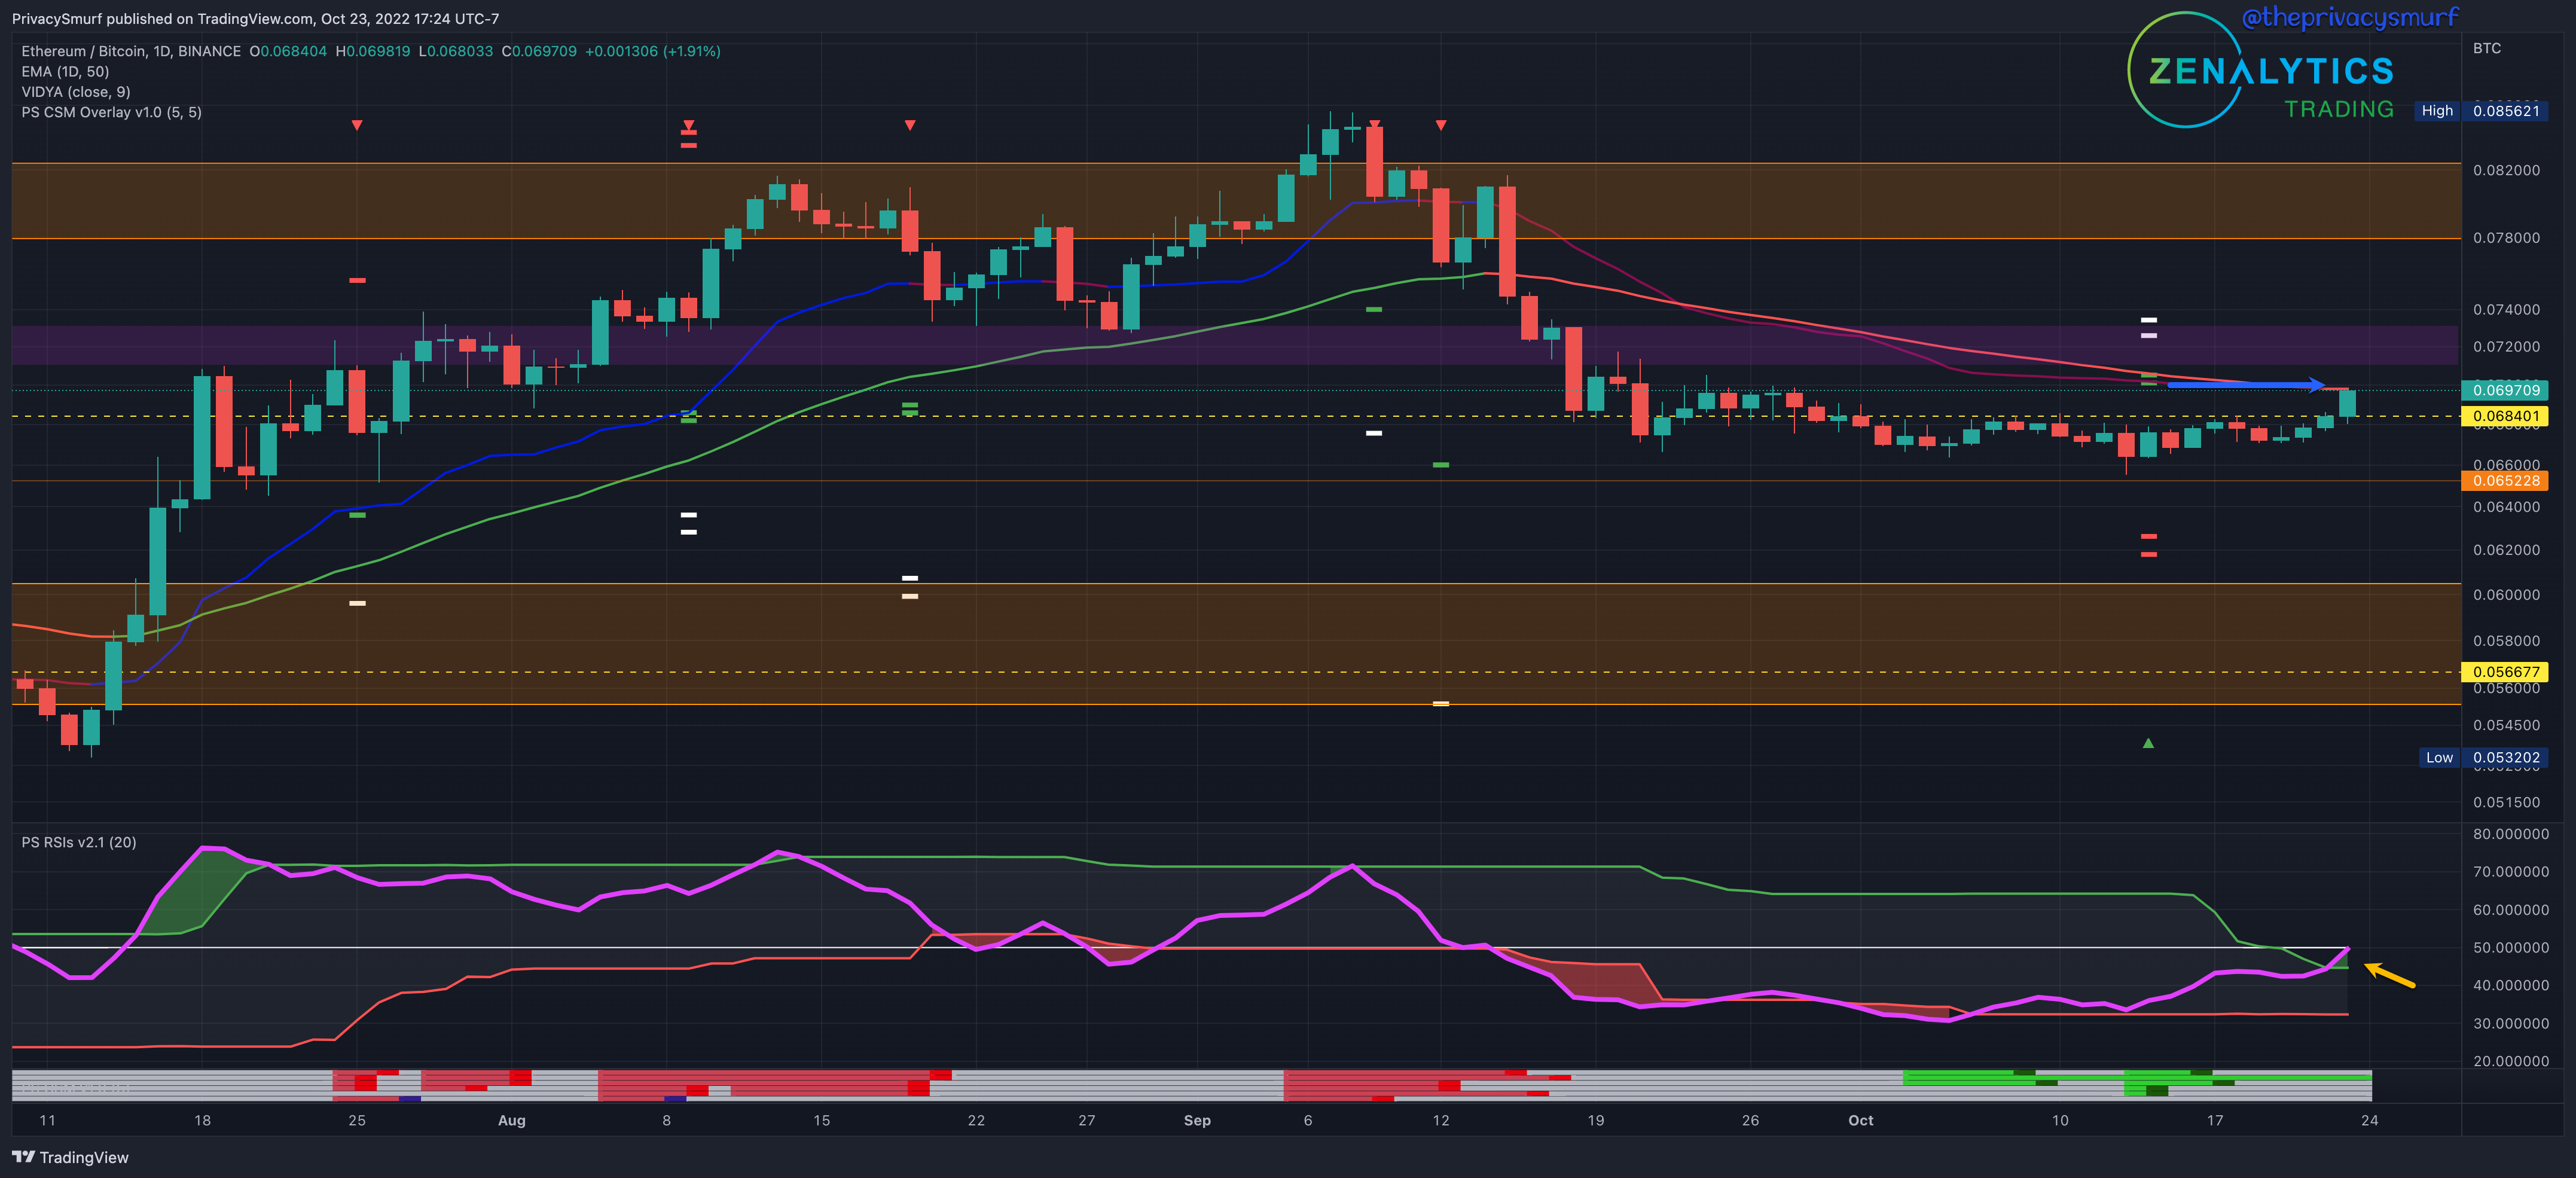
“… a bullish reversal is on the horizon... limited to the 50-Day EMA… RSI… may just amount to a midline test… more ranging but an expansion of that range, essentially starting to set some higher highs…”
The value ratio of ETH relative to BTC grew, as suggested last week. The bullish trade signaled my indicator the Correction Strength Meter has not met the target of 0.0701 (blue arrow) with the high of the day 0.069819, but I expect that to be hit this week. The RSI (yellow arrow) is testing the midline now after having broken above the top adaptive band. This would suggest further bullish expansion.
Given the current technicals for the week, I’d expect ETH and, subsequently, alts to continue to gain value over BTC. If the RSI breaks above the midline and the price chart closes above the 50-Day EMA, I would expect a rise up toward the top of the trouble area, and the 2nd plotted targets of the CSM are around 0.073. I would expect resistance at that point.
ETH/USDT Daily Chart
https://www.tradingview.com/chart/xbB6lkZu/
From last week:
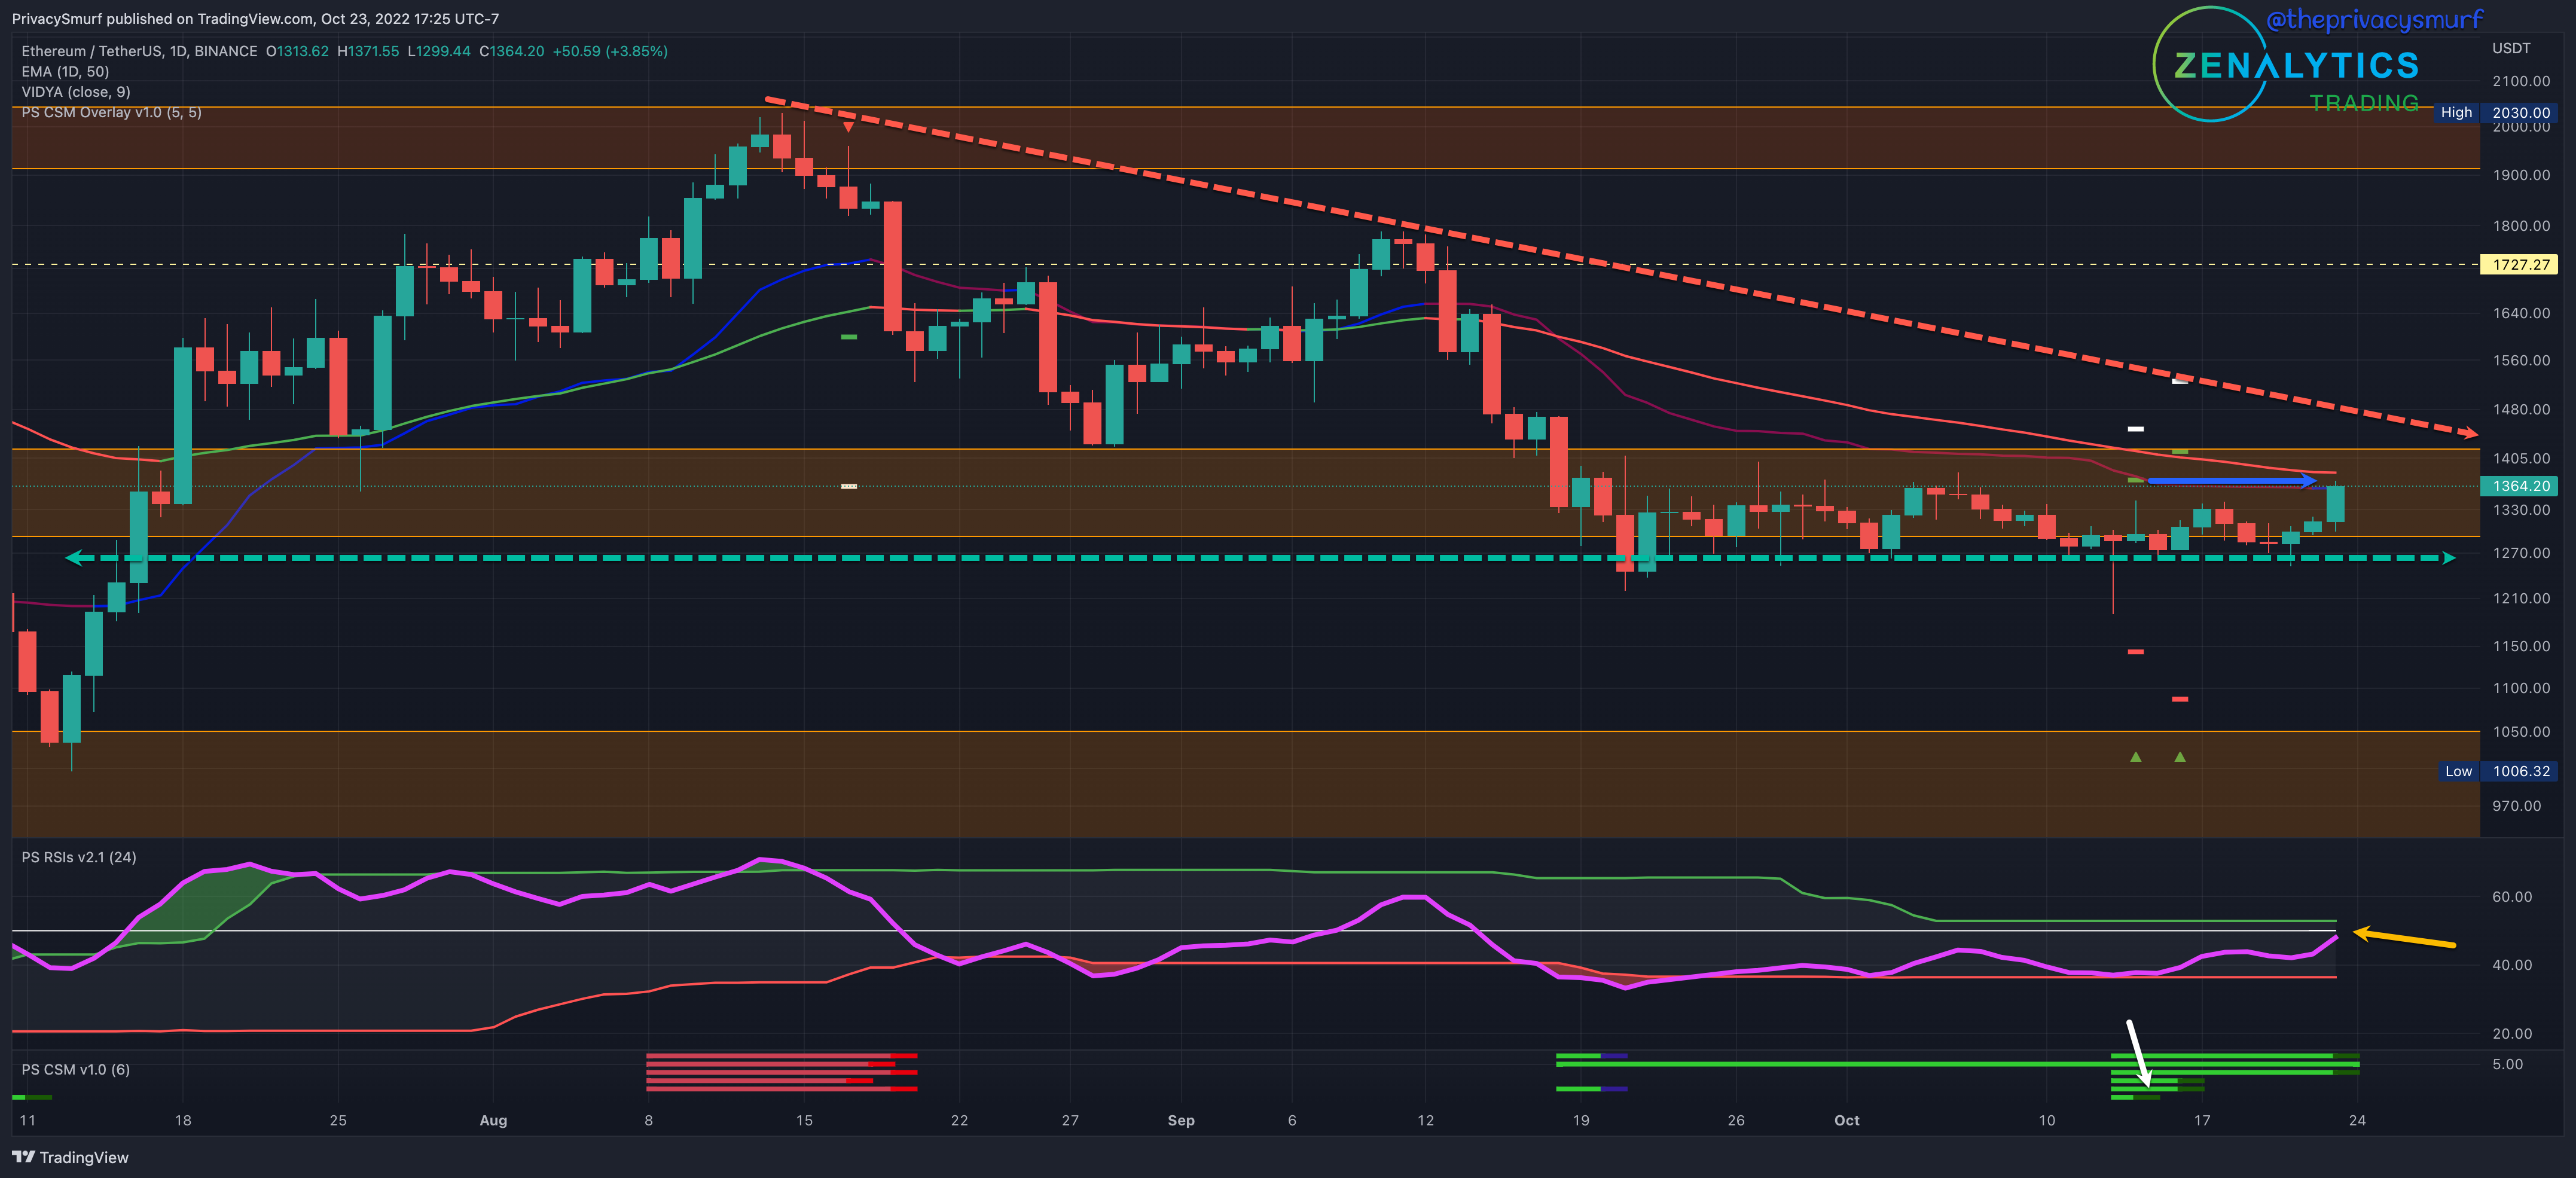
“…the CSM… producing initial targets of a rally up… around $1370…”
My indicator, the Correction Strength Meter (white arrow), delivered this week as we closed Sunday with a high of 1371.55, meeting the initial bullish targets (blue arrow). The RSI (yellow arrow) has yet to cross above the top adaptive band and midline, so the bullish activity that closed out the week is still within relatively normal fluctuations, and more bullish volatility may be in store.
Given the current technicals for the week, I have a bullish bias overall but a slight bearish bias going into the early part of the week. I anticipate a confluence of the RSI midline, adaptive top band, and 50-Day EMA to break up potentially around the middle to the end of the work week leading to a break out of the wedging structure shown by the dashed arrows. I expect resistance from this rally to lie around $1390-$1400. Sub $1300 prices are also not outside expectations early in the week.
If you are interested in purchasing my indicator suite and the private side of my discord devoted to learning the tools feel free to reach out to me via email @ terry@zenalytics.info. I’ll also post some more cool stuff I’m working on this week.
@theprivacysmurf