

Sunday Synopsis #55: Lose Yourself to Dance
Sunday Synopsis #55: Lose Yourself to Dance
C'mon C'mon C'mon C'mon C'mon C'mon C'mon C'mon C'mon C'mon

Raking in some wins this past week has me doing a little dance.
BTC/USDT Daily Chart
https://www.tradingview.com/chart/jjSdFW4b/
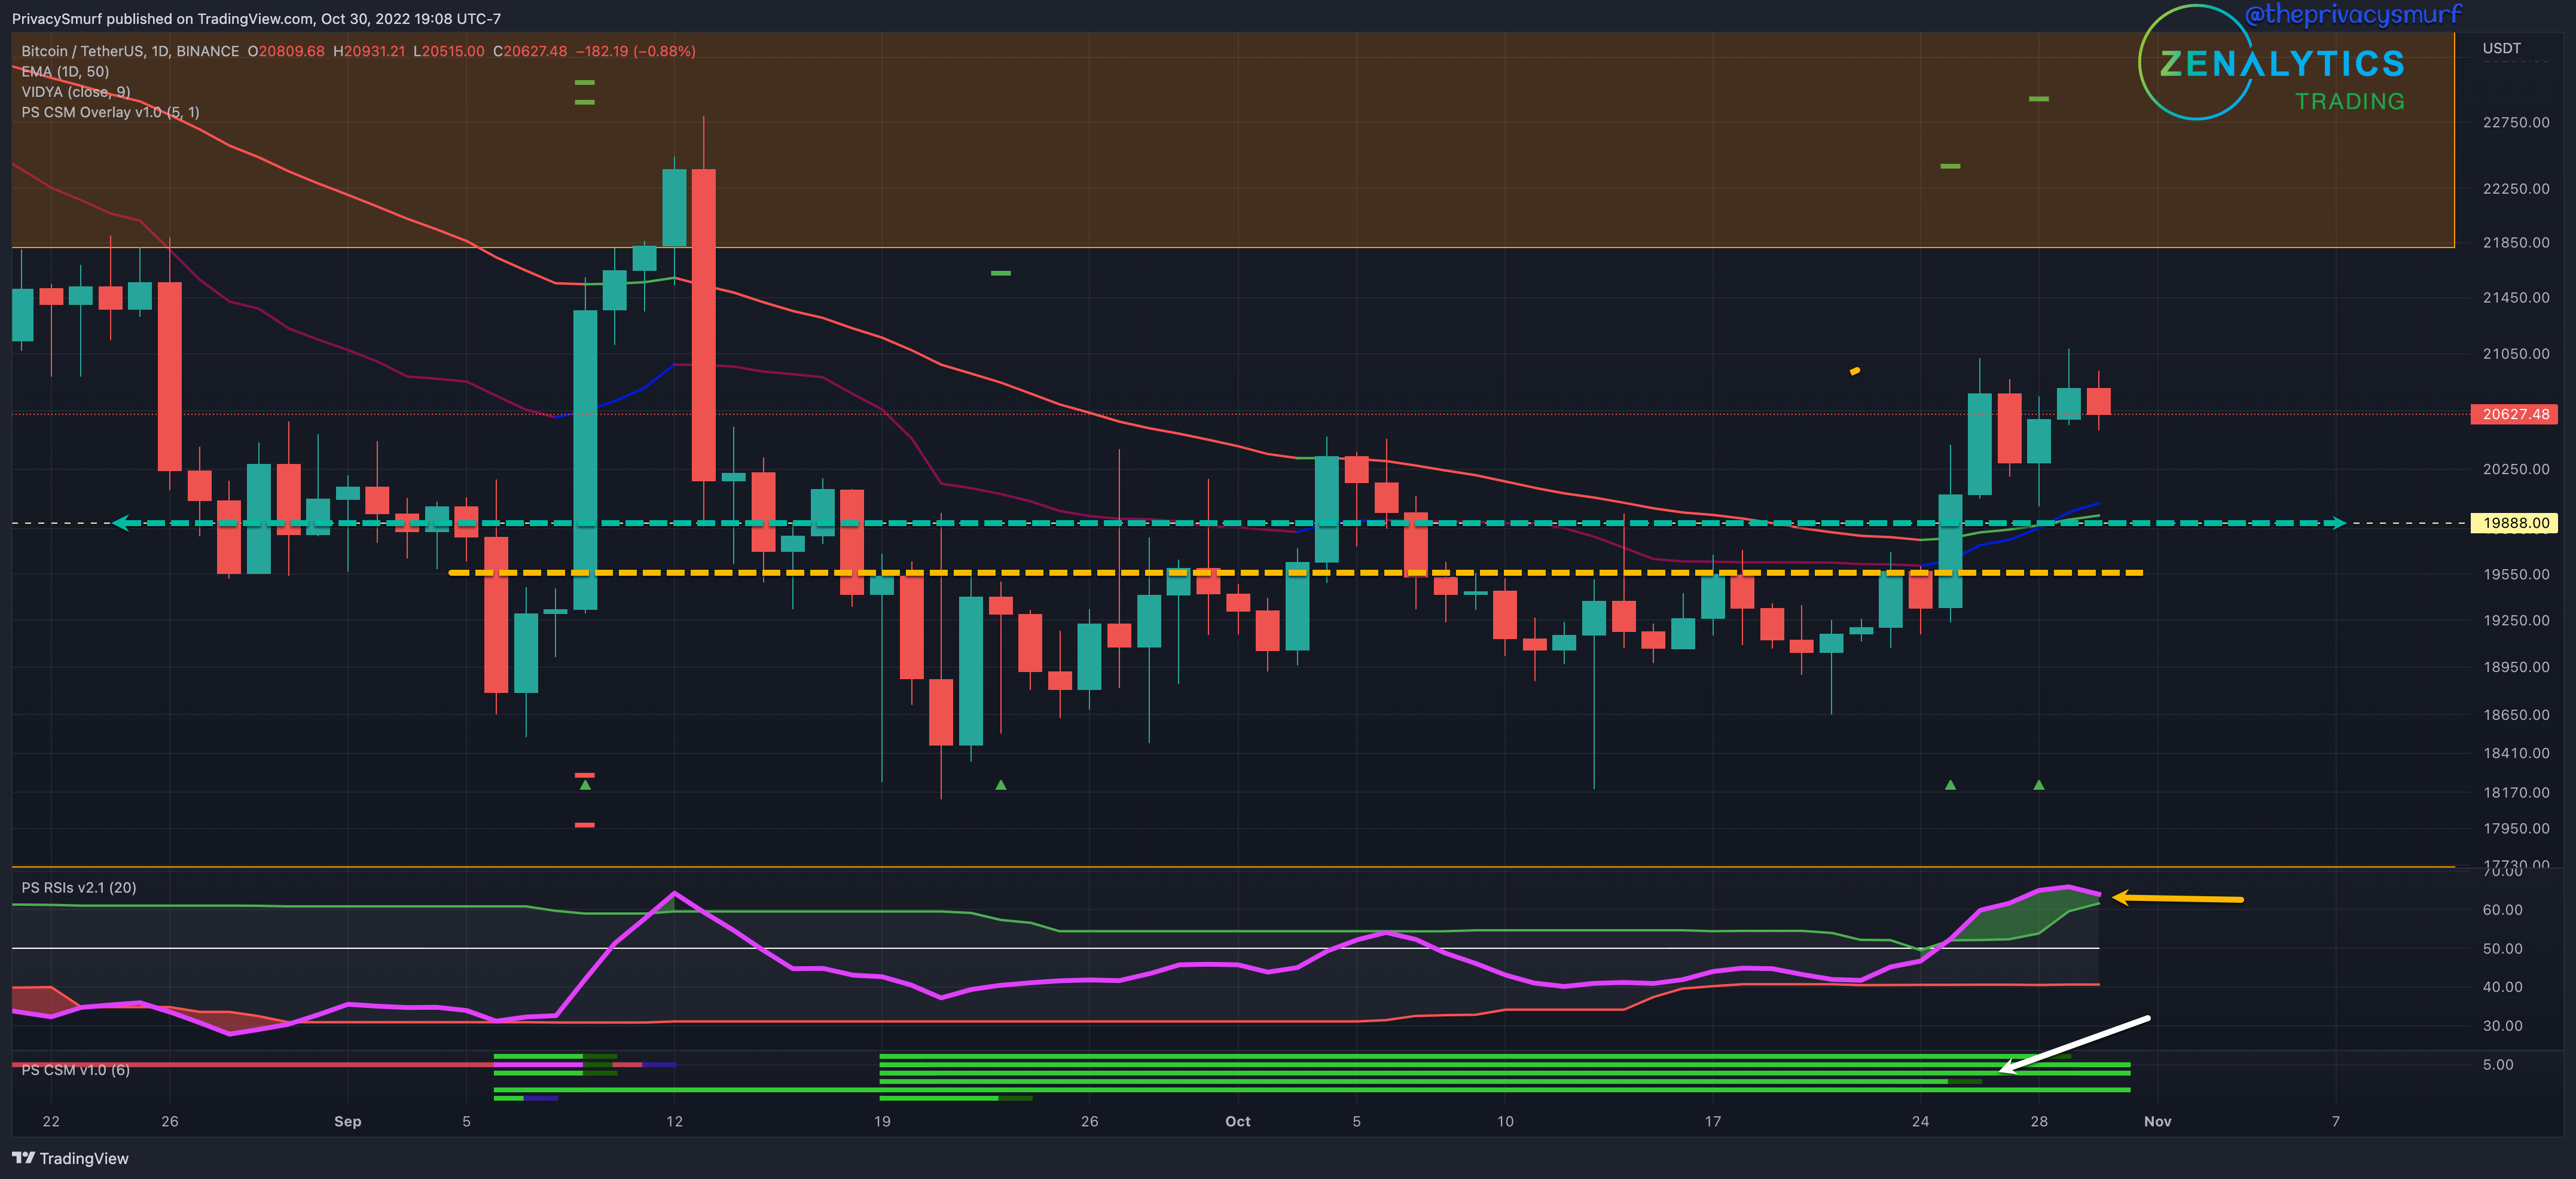
From last week:
“…expect the compression/ranging in the wedging structure displayed by the dashed arrows to continue with a bearish bias earlier in the week… but eventually a bullish break. The 50-Day EMA may act as temporary resistance, but ultimately, near-term targets will likely return to around $19.9k and $20.2k before November…”
The wedging structure was broken out to the top, and BTC managed to hit the short-term targets. My indicator, the Corrections Strength Meter (white arrow), finally signaled the conditions for a bullish reversal trade on Tuesday, plotting initial targets up near $22.5k. This target is not outside of short to mid-term expectations however the RSI (yellow arrow) is curling back towards the top adaptive band. The movements of the RSI will dictate how soon (or if) we make it to that target.
Given the current technicals for the week, I’d be on the lookout for two potentialities.
The RSI makes a rebound off the top band (or a quick dip under and rally back out), and prices continue up to initial resistances around $22k.
The RSI turns back into the adaptive bands, the bullish volatility is over, and a new range high is established at the highest close. If this is the case, I will pay attention to the retracement. Ideally, daily closes don’t cross below the 50-Day EMA or the horizontal support level at $19.8k (green dashed line). In a less ideal world, I could still be convinced that the bullish move could be sustained unless closes come below the prior range high at $19.5k. During a retracement, intraday charts 2HR timeframe and down may determine whether the support will hold and will be the next higher low in the potential bullish trend. Bullish divergent signals at that level would be where I’d consider front-running the new trend.
My bias is bullish, but that will likely change as soon as the RSI stays below the bands. I’m also not entertaining the idea of opening up new long positions at the current level if I wasn’t already in them.
ETH/BTC Daily Chart
https://www.tradingview.com/chart/gTkSjkj6/

From last week:
“… bullish trade signaled my indicator the Correction Strength Meter has not met the target … but I expect that to be hit this week… expect ETH and, subsequently, alts to continue to gain value over BTC…”
This trade plan exceeded all expectations as ETH, and many alts had great moves over BTC. The bottom of the prior plotted resistance zone continues to hold as a resistance for the moment. Like BTC, the RSI (yellow arrow) is the item to watch for an idea of what the future will hold.
Given the current technicals for the week, I’d be on the lookout for two potentialities.
1) The RSI makes a rebound off the top band (or a quick dip under and rally back out), and ETH and alts continue to rally more than BTC. I’d still expect the higher levels of the resistance zone around 0.082 to stall a rally.
2) The RSI turns back into the adaptive bands, the bullish volatility is over, and a new range high is established at the highest close. If this is the case, I’d rotate profits from alt positions back into BTC and collect those sweet extra satoshis for the effort. A retracement would likely accompany this. Ideally, daily closes don’t cross below the 50-Day EMA or the horizontal support level at 0.073 (green dashed line). In a less ideal world, I could still be convinced that the bullish move could be sustained unless closes come below the 50-Day EMA. During a retracement, intraday charts 2HR timeframe and down may determine whether the support will hold and will be the next higher low in the potential bullish trend. Bullish divergent signals at that level would be where I’d consider front-running the new trend. It’s extremely important not to hold onto short-term alt positions in the event of this decline as they will likely be propelled down more than BTC would be during the change of market trend.
My bias is bullish, and it’s slightly promising that the RSI has more room above the top band than BTC, so ETH and alts may not get hit as hard as BTC in the short-term bearishness. I’m not entertaining the idea of opening up new long positions at the current level if I wasn’t already in them.
ETH/USDT Daily Chart
https://www.tradingview.com/chart/xbB6lkZu/

From last week:
“…more bullish volatility may be in store… I have a bullish bias overall but a slight bearish bias going into the early part of the week. I anticipate a… break out of the wedging structure…”
ETH kept giving and giving this past week. The suggested small retracement early in the week was a great springboard into the bullish rally.

If you don’t have an exchange, you are satisfied with check out my referral link to MEXC. They’ve offered me an affiliation and a special promotion for new joins. I’ll also be making a copy trading profile shortly on MEXC that you can follow. Check out the link below.
MEXC Crypto Exchange Sign-up Promotion Link
At the risk of sounding like a broken record, the RSI is the indicator to watch as we draw out this short-term rally.
Given the current technicals for the week, I’d be on the lookout for two potentialities.
The RSI makes a rebound off the top band (or a quick dip under and rally back out), and ETH prices continue their walk up to initial resistances around $1700.
The RSI turns back into the adaptive bands, the bullish volatility is over, and a new range high is established at the highest close. If this is the case, I will pay attention to the retracement. Ideally, daily closes don’t cross below the 50-Day EMA or the horizontal support level at $1420 (green dashed line). In a less ideal world, I could still be convinced that the bullish move could be sustained unless closes come below the prior range high of around $1350. During a retracement, intraday charts 2HR timeframe and down may determine whether the support will hold and will be the next higher low in the potential bullish trend. Bullish divergent signals at that level would be where I’d consider front-running the new trend. This is a slightly less-than-ideal situation since ETH has had such a run. Moving back down that far may put ETH into a short-term bearish trend, and a follow-on long trade may carry higher risk.
My bias is bullish, but that will likely change as soon as the RSI stays below the bands. I’m also not entertaining the idea of opening up new long positions at the current level if I wasn’t already in them.
If you are interested in purchasing my indicator suite and the private side of my discord devoted to learning the tools feel free to reach out to me via email @ terry@zenalytics.info.
@theprivacysmurf