

Sunday Synopsis #56: Smokin' Out the Window
Sunday Synopsis #56: Smokin' Out the Window
Baby, why you doin' this? Why you doin' this to me, girl? Not to be dramatic, but I wanna die.

The short-term bulls that didn't get to take profits are all singing, “how could you do this to me?” to BTC.
Rumors abound about FTX and its liquidity. I don't put much stock into that and only keep enough on exchanges to trade with. If it worries you or you don’t have an exchange you are satisfied with, check out my referral link to MEXC. They’ve offered me an affiliation and a special promotion for new joins. I’ll also be making a copy trading profile shortly on MEXC that you can follow. It will largely follow the setups I talk about in the Sunday Synopsis and entries taken from the Trading Range Tuesday coins. I’ve put in trade screenshots from the past week.
MEXC Crypto Exchange Sign-up Promotion Link
BTC/USDT Daily Chart
https://www.tradingview.com/chart/jjSdFW4b/
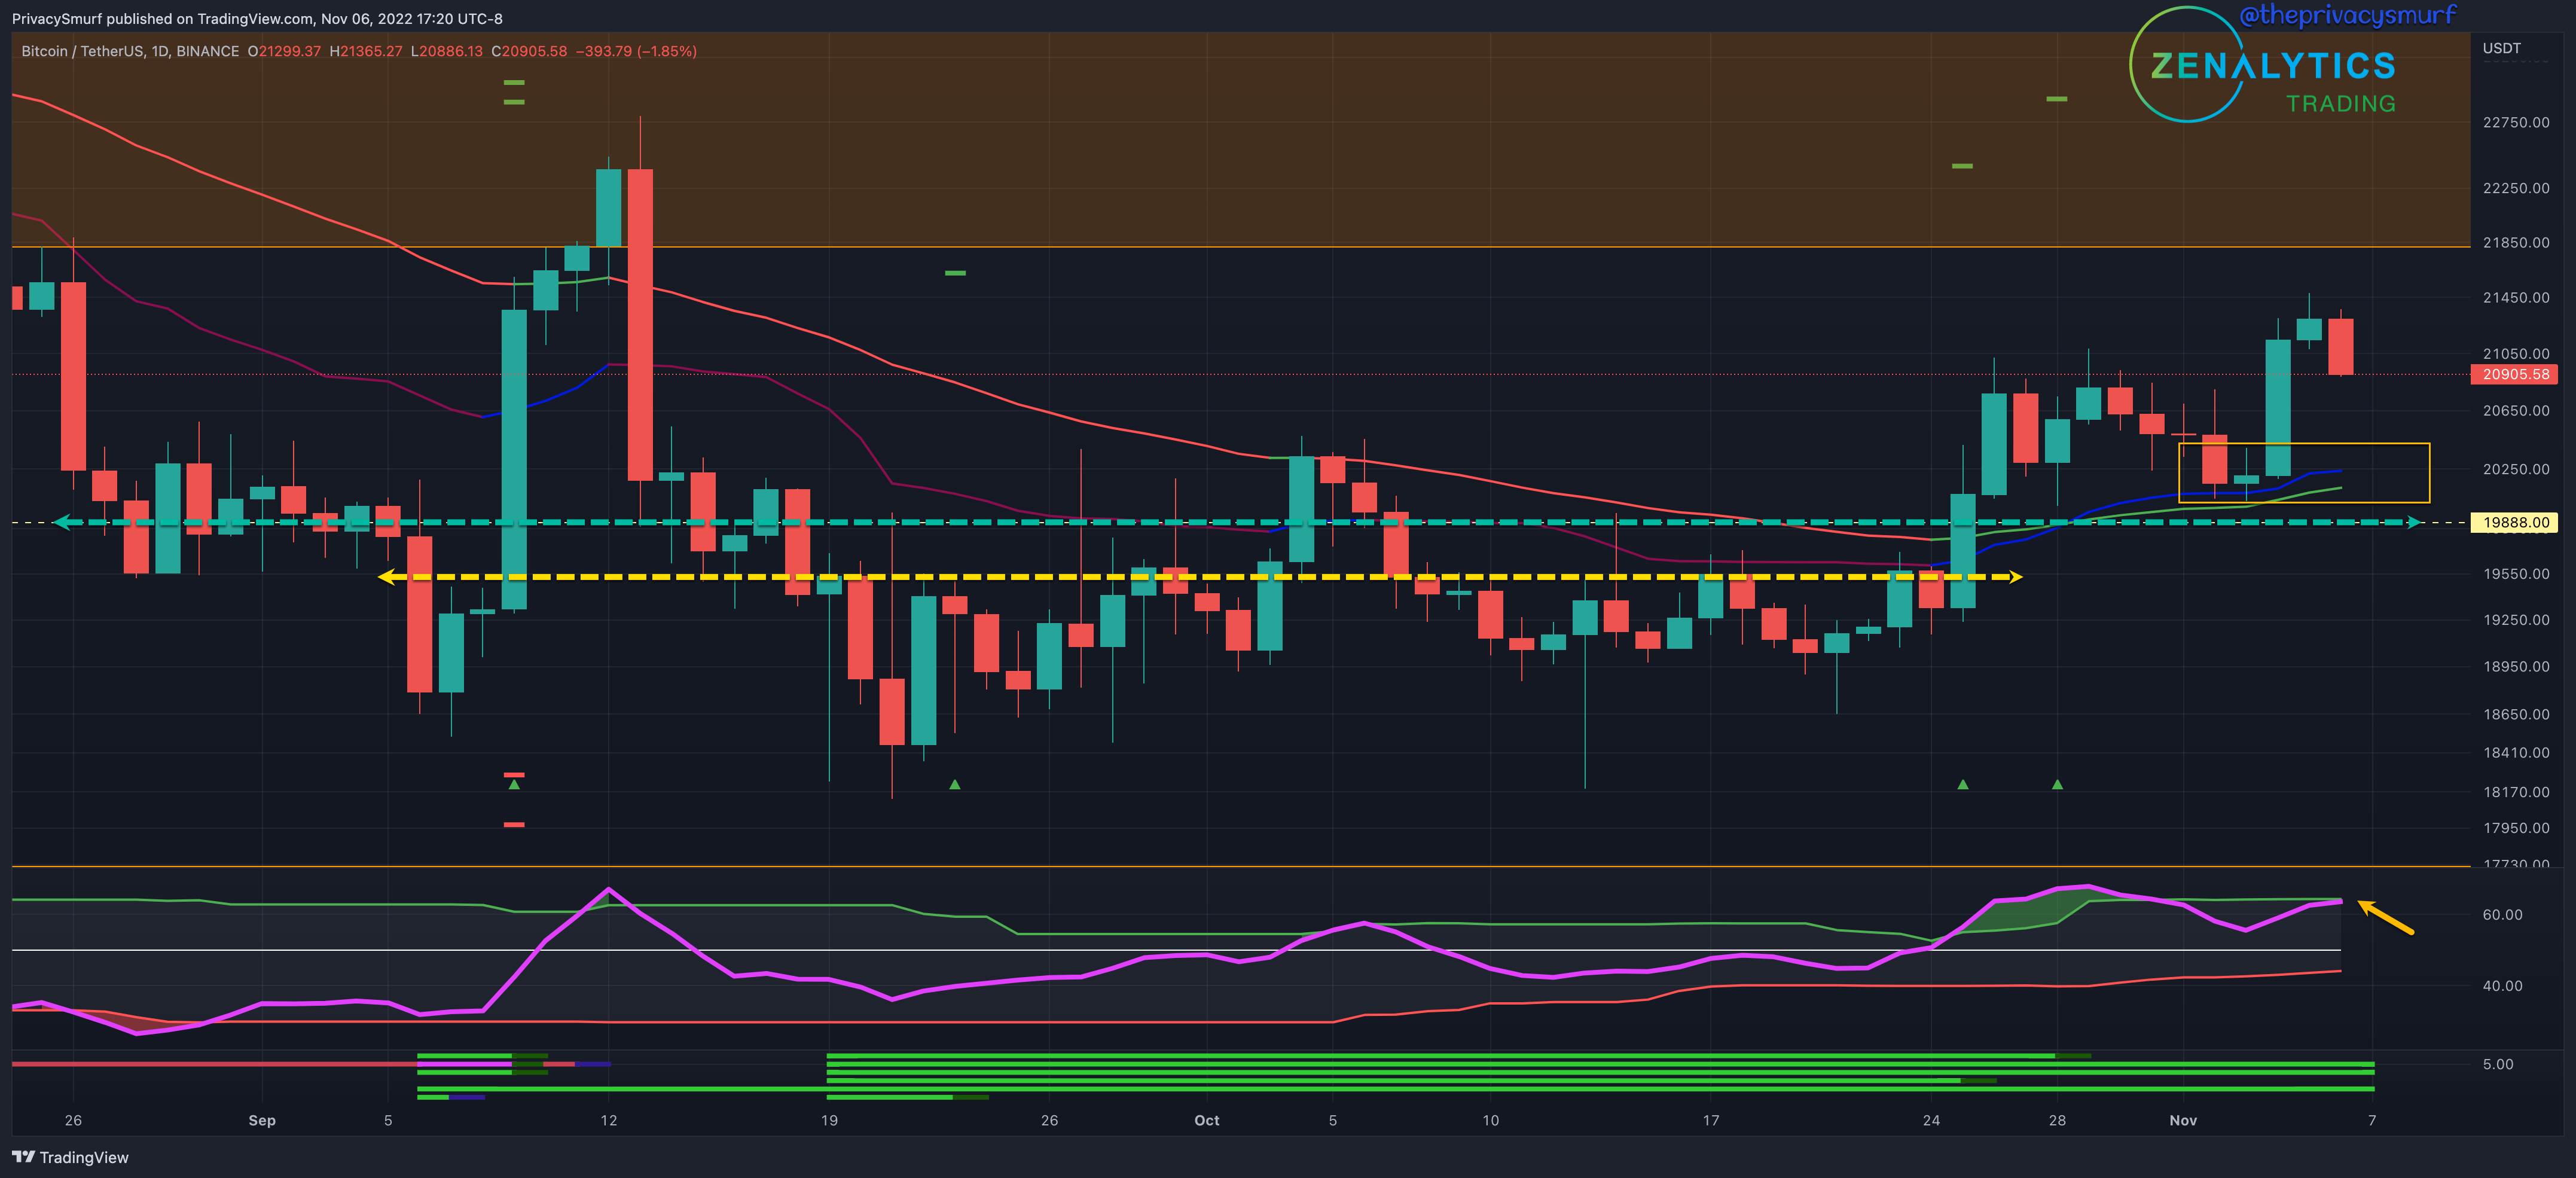
From last week:
“…the RSI will dictate… RSI turns back into the adaptive bands, the bullish volatility is over.. pay attention to the retracement… horizontal support level at $19.8k.. intraday charts 2HR timeframe… may determine whether the support will hold and will be the next higher low Bullish divergent signals at that level… consider front-running the new trend…“
Last week's retracement played out according to plan, and the 2hr timeframe gave the perfect signal for reentry as suggested.


A similar situation exists to last week’s synopsis. After the recent rally, the RSI (yellow arrow) has moved into the bands and is slightly diverging in a bearish fashion, not matching the prices that rallied to new highs. This would suggest a waning of momentum and another retracement.
Given the current technicals for the week, I am watching for the same two scenarios again.
The RSI makes a rally out over the top band, and prices continue up to initial resistances around $22k.
The RSI largely stays inside the adaptive bands or remains bearish divergent if prices rally. Either way, I will pay attention to the retracement. Ideally, daily closes don’t cross below the 50-Day EMA or the horizontal support level at $19.8k (green dashed line). In a less ideal world, I could still be convinced that the bullish move could be sustained unless closes come below the prior range high at $19.5k. During a retracement, intraday charts 2HR timeframe and down may determine whether the support will hold and will be the next higher low in the potential bullish trend. Bullish divergent signals at that level would be where I’d consider front-running the reversal. I’ve annotated the chart with the zone to watch for the potential bounce. This may be a less-than-ideal situation the second time around. If the RSI continues to decline and is closer to the midline, the risk of a bearish break increases. The trade setup will have an increased risk.
My bias this week is still leaning towards a bullish trade signal, but I’m still anticipating the retracement to support before bullishness.
ETH/BTC Daily Chart
https://www.tradingview.com/chart/gTkSjkj6/
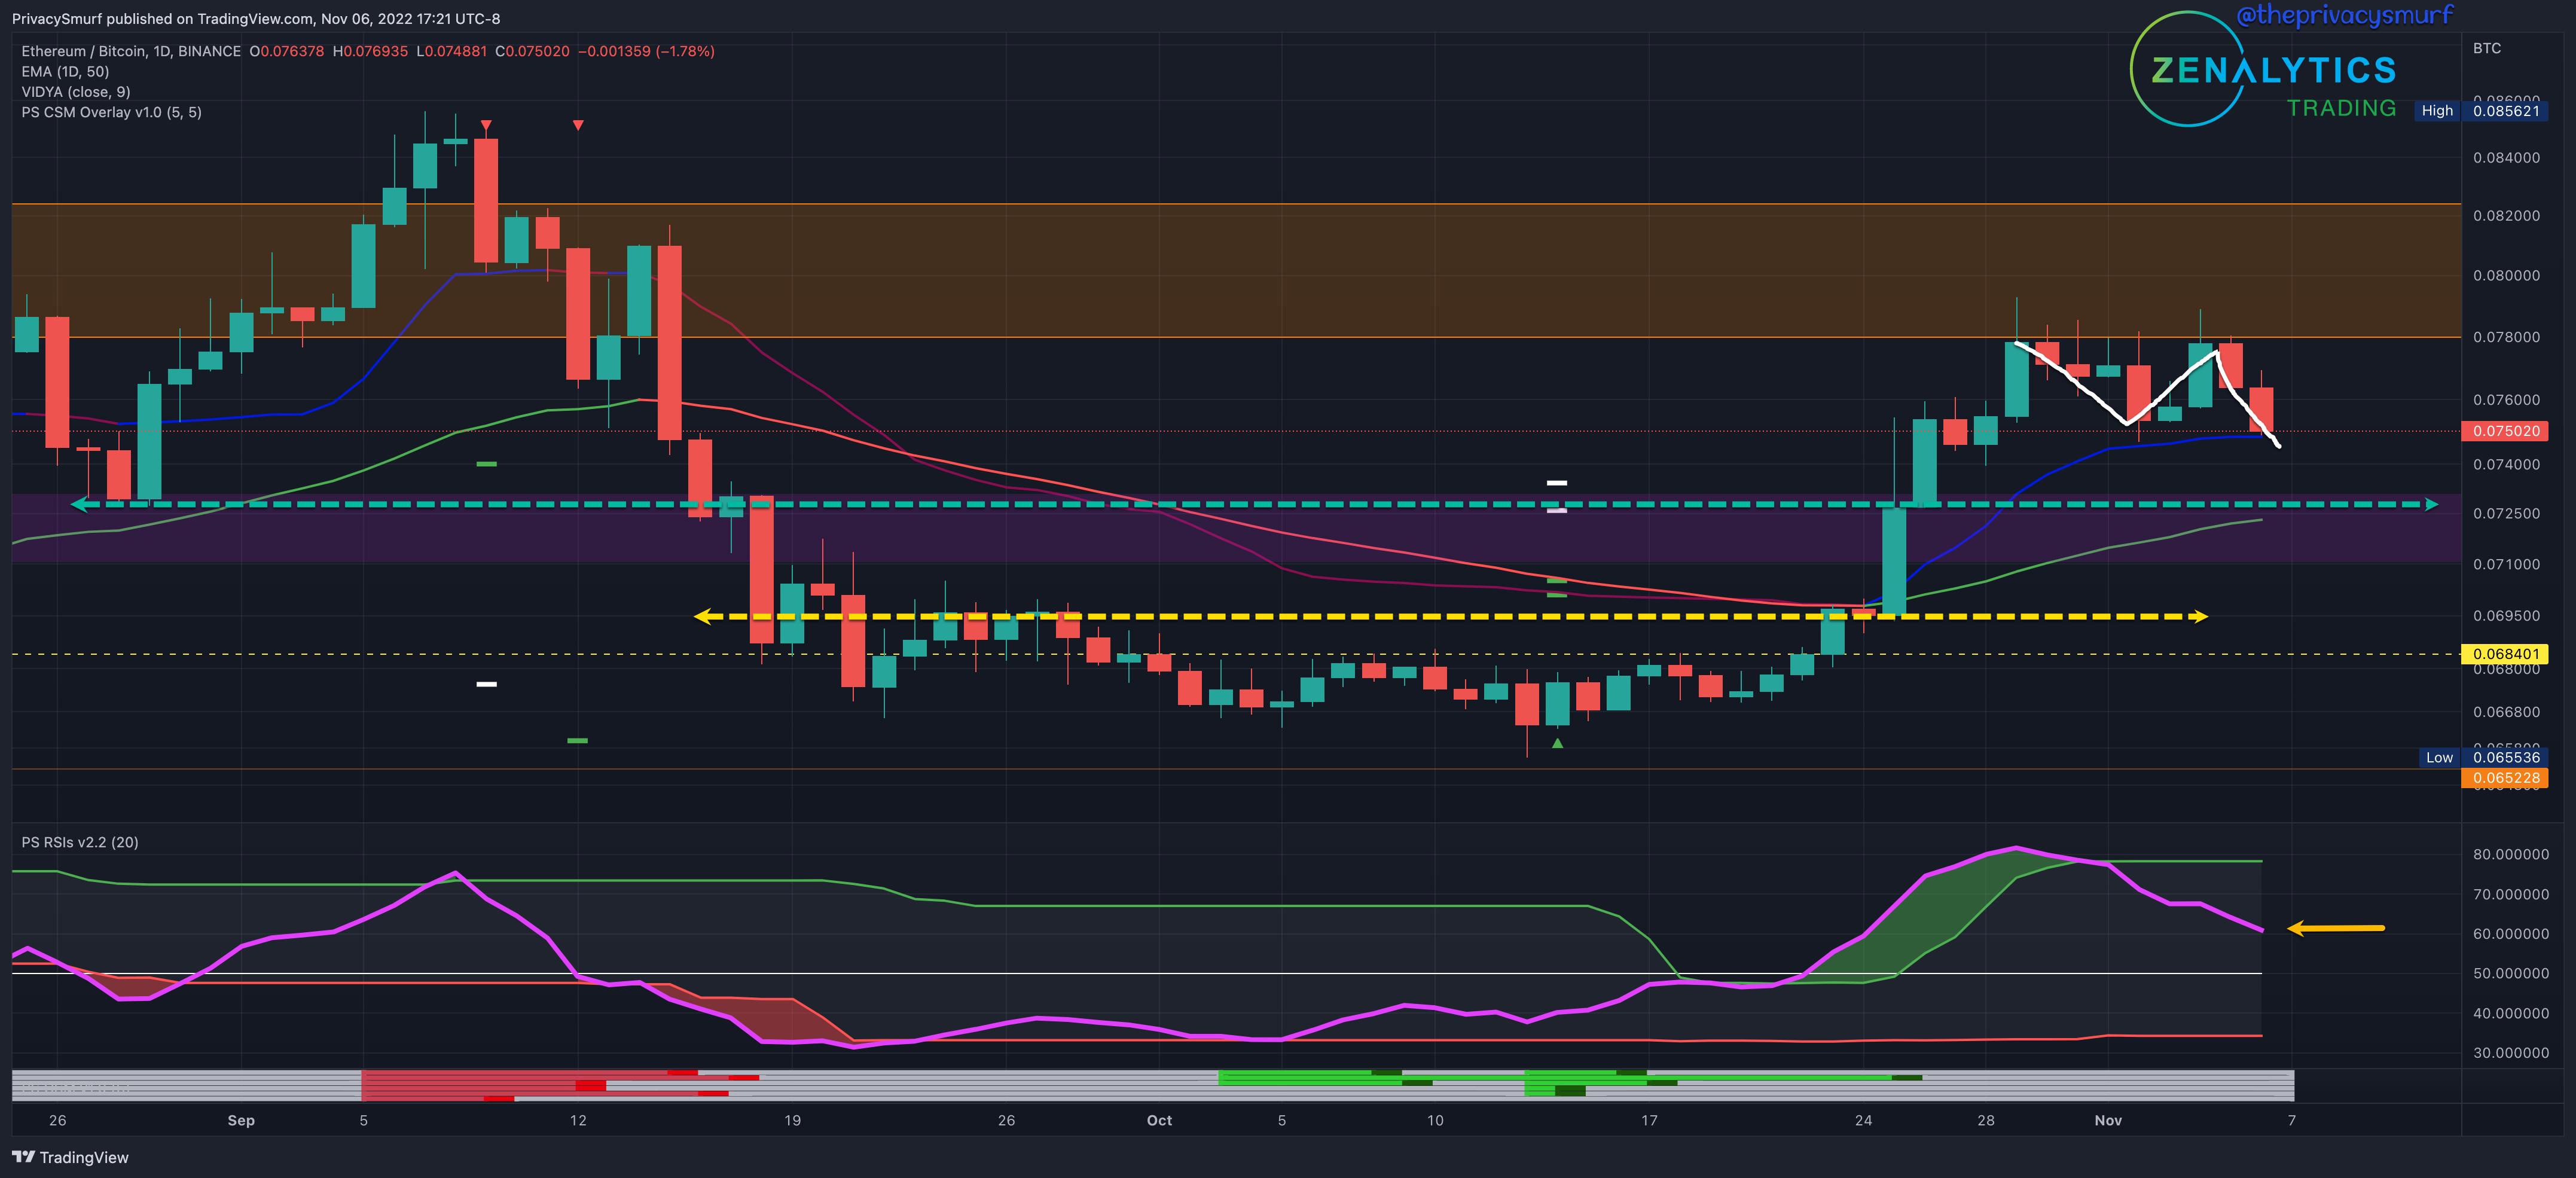
From last week:
“…prior plotted resistance zone continues to hold… on the lookout for… RSI turns back into the adaptive bands, the bullish volatility is over, and a new range high is established at the highest close… retracement would likely accompany… 2HR timeframe and down may determine whether the support will hold and will be the next higher low…”
Last week's analysis was on point, and ETH and many alts had great moves pumping over BTC. However, the RSI (yellow arrow) continued down, showing a waning in buy momentum. Also shown in white daily closes set lower lows and lower highs, creating a bearish trend. Similar to last week, I am still watching for two potential outcomes.
Given the current technicals for the week, I’d be on the lookout for two potentialities.
1) The RSI rebounds off the midline, and ETH and alts rally. I’d still expect the higher levels of the resistance zone around 0.078 to stall a rally. 2) The RSI crosses down the midline. If this is the case, ETH and ATLS will likely bleed off. Ideally, daily closes don’t cross below the 50-Day EMA or the horizontal support level at 0.073 (green dashed line). In a less ideal world, I could still be convinced that a bullish reversal could lead to a sustained rally unless closes come below the 50-Day EMA. During a retracement, intraday charts 2HR timeframe and down may determine whether the support will hold. Bullish divergent signals at that level would be where I’d consider buying for a rally. This is a much higher risk entry as the RSI is closer to crossing below the midline, suggesting a bearish continuation.
My bias is now bearish going into this retracement but for my positions, taking the risk of entry at support is worth the risk of not being exposed to a sustained rally. However, losing the 0.071 level, I’d exit those positions to re-enter once a better setup appeared.
ETH/USDT Daily Chart
https://www.tradingview.com/chart/xbB6lkZu/

From last week:
“…The RSI turns back into the adaptive bands… bullish volatility is over… pay attention to the retracement… intraday charts… may determine whether the support will hold and will be the next higher low… signals at that level would be where I’d consider front-running the new trend.
The retracement did play out early in the week, and the same signals were present on the 2HR chart as ETH returned to the recent support providing an excellent opportunity for a trade buying the higher low.

A similar situation exists to last week’s synopsis. The RSI (yellow arrow) has moved into the bands and is diverging in a bearish fashion, not matching the prices that rallied to new highs. This would suggest a waning of momentum and another retracement.
Given the current technicals for the week, I am watching for the same two scenarios again.
The RSI makes a rally out over the top band, and prices continue up to initial resistances around $1720.
The RSI largely stays inside the adaptive bands or remains bearish divergent if prices rally. Either way, I will pay attention to the retracement. Ideally, daily closes don’t cross below the 50-Day EMA or the horizontal support level at $1420 (green dashed line). In a less ideal world, I could still be convinced that the bullish move could be sustained unless closes come below the prior range high at $1370. During a retracement, intraday charts 2HR timeframe and down may determine whether the support will hold and will be the next higher low in the potential bullish trend. Bullish divergent signals at that level would be where I’d consider front-running the reversal. I’ve annotated the chart with the zone to watch for the potential bounce. This may be a less-than-ideal situation the second time around. If the RSI continues to decline and is closer to the midline, the risk of a bearish break increases. The trade setup will have an increased risk.
My bias this week is still leaning towards a bullish trade signal, but I’m still anticipating the retracement to support before bullishness. With ETH/BTC now bearish, there is a greater risk for exposure to ETH and alts but for my positions, taking the risk of entry at support is worth the risk of not being exposed to a sustained rally. However, losing the $1370 level, I’d exit the positions to re-enter once a better setup appeared.
If you are interested in purchasing my indicator suite and the private side of my discord devoted to learning the tools feel free to reach out to me via email @ terry@zenalytics.info. Here’s an invite link to my discord. Pop in and say hi!
https://discord.gg/b3yvEvcq
@theprivacysmurf
Absolutely loving your content, would you be open to allowing us to share it with our 60k+ audience as well?