

Sunday Synopsis #57: Fantasy
Sunday Synopsis #57: Fantasy
Oh, all the trials. Say it out loud, worth saying, Pray for me.

With everything happening around us in the crypto space, it isn’t hard to think it’s a fantasy instead of real life. My deepest sympathies to anyone impacted negatively by all the horrible shenanigans in the space. It isn’t the end, and things will get better.
Life goes on, and so must I so here are the latest updates. Honestly, nothing is wrong with doing nothing though in crypto right now.
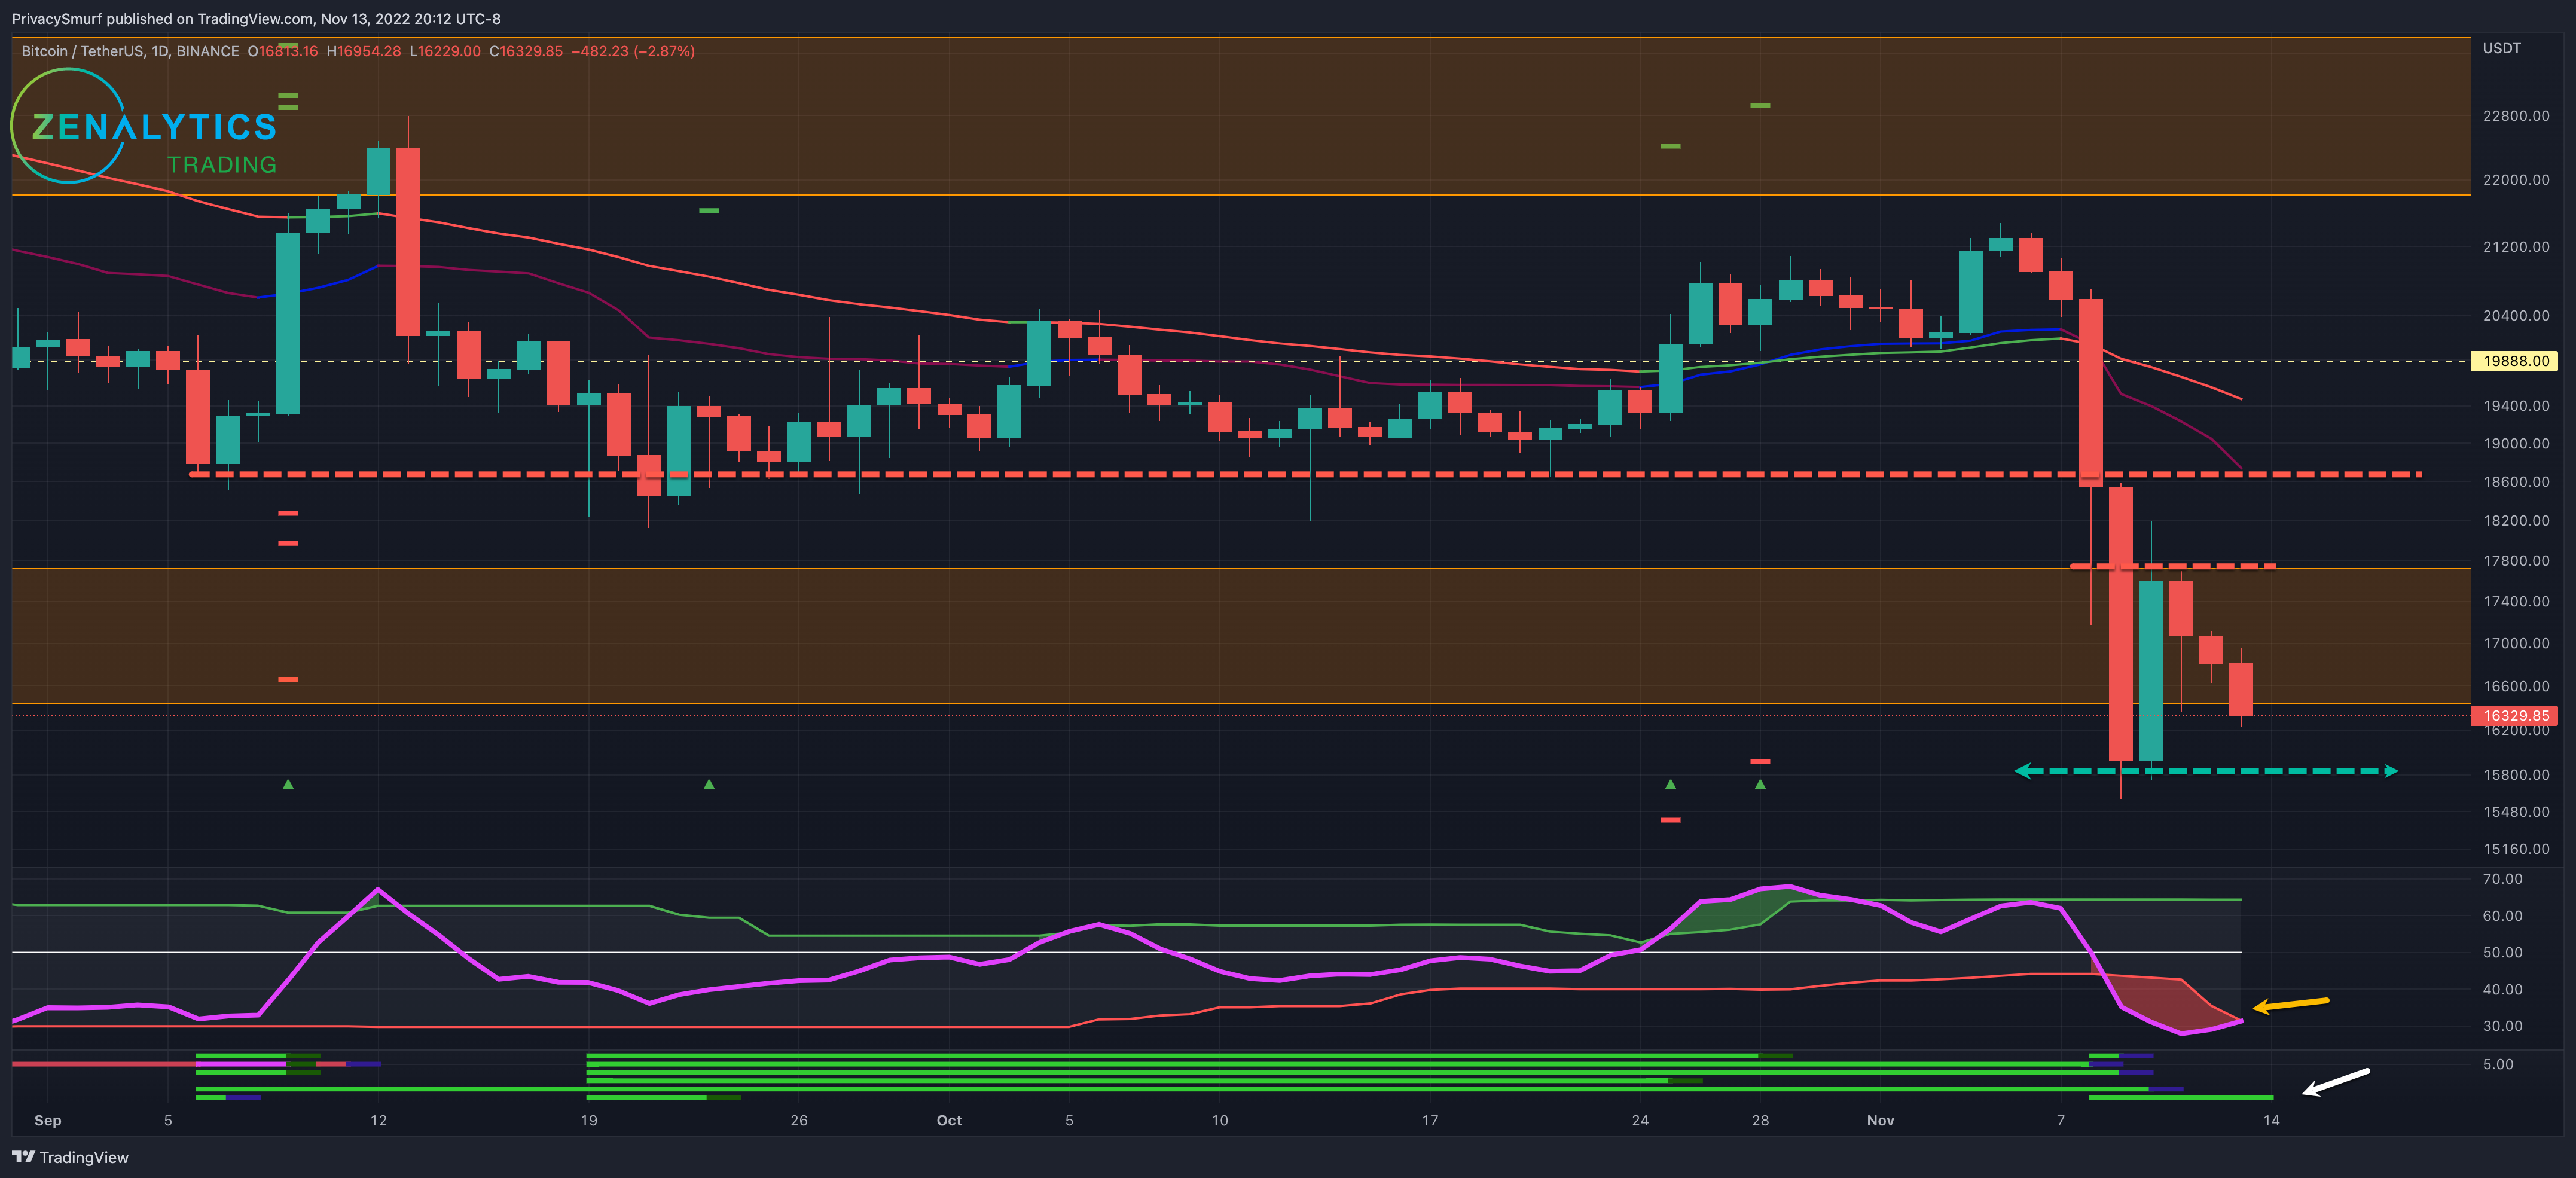
BTC/USDT Daily Chart
https://www.tradingview.com/chart/jjSdFW4b/
From last week:
“…the RSI… is slightly diverging in a bearish fashion… suggest a waning of momentum and another retracement… 2HR timeframe and down may determine whether the support will hold. Bullish divergent signals at that level would be where I’d consider front-running the reversal… may be a less-than-ideal situation… If the RSI continues to decline and is closer to the midline, the risk of a bearish break increases… still anticipating the retracement to support before bullishness…”
Last week's retracement played out with a vengeance, and the 2hr timeframe did indeed show to stay away from a bullish trade. As the price approached the zone I annotated last week just above the 50-day EMA, no bullish divergence was present. My custom indicator, at the bottom (yellow box), showed no oscillators in bullish divergence, suggesting that momentum was trending in line with the price. There was little reason to suspect support to hold as no buyers were entering the market to prop up the falling prices. At the moment, there still are no bullish divergences displayed.
Given the week's current technicals, I expect prices to continue lower. A potential range may be established as the RSI crosses above the bottom band again, suggesting the end of bearish volatility for the moment. After such a huge shakeout, I typically hesitate before making any moves to give the time market to settle. A wide range of 15800 to 17800 may cover prices for the week. But anything is possible with all the external factors surrounding liquidity, fear, and macro context. I have lower bids in the $10-$12k range at the moment. These are DCA orders and are not meant to time the market.
My bias this week is still bearish, prioritizing intraday shorts after losing the $18.6k level. However, a bullish divergence forms with the momentum oscillator on the daily timeframe. There is an underlying buy bid that may keep prices from moving too much lower.
ETH/BTC Daily Chart
https://www.tradingview.com/chart/gTkSjkj6/

From last week:
“…daily closes set lower lows and lower highs, creating a bearish trend… lookout for… RSI crosses down the midline… ETH and ATLS will likely bleed off... This is a much higher risk entry… the RSI… crossing below the midline, suggesting a bearish continuation… bias is now bearish… losing the 0.071 level, I’d exit those positions…”
Last week's analysis was on point, and the ETH to BTC ratio failed at the first support as the RSI continued lower and broke down from the midline. However, the RSI (yellow arrow) elevated over the midline again with a strong reaction from the lower support at the 0.067 level. The trend is still bearish despite this rebound. The 50-Day EMA failing again would likely see another violent reaction to the downside. This would likely coincide with a failure of the current support around 0.073
Given the current technicals for the week, I’m expecting ranging values. The RSI is currently presenting a bullish influence but is battling against a confirmed bearish trend in prices. I’m hesitant to make the levels from 0.073 to 0.078 the trading range for the week as there are still plenty of external reasons to expect volatility. Still, the technical data support those levels being drawn, in my opinion.
My bias this week is still bearish, prioritizing intraday shorts. There is no bullish divergence on this timeframe, so I am very hesitant to consider new bullish positions on ETH and alts as the risk is substantial for more downside. I need more confirmation on bullish transitions on lower timeframes to influence that decision.
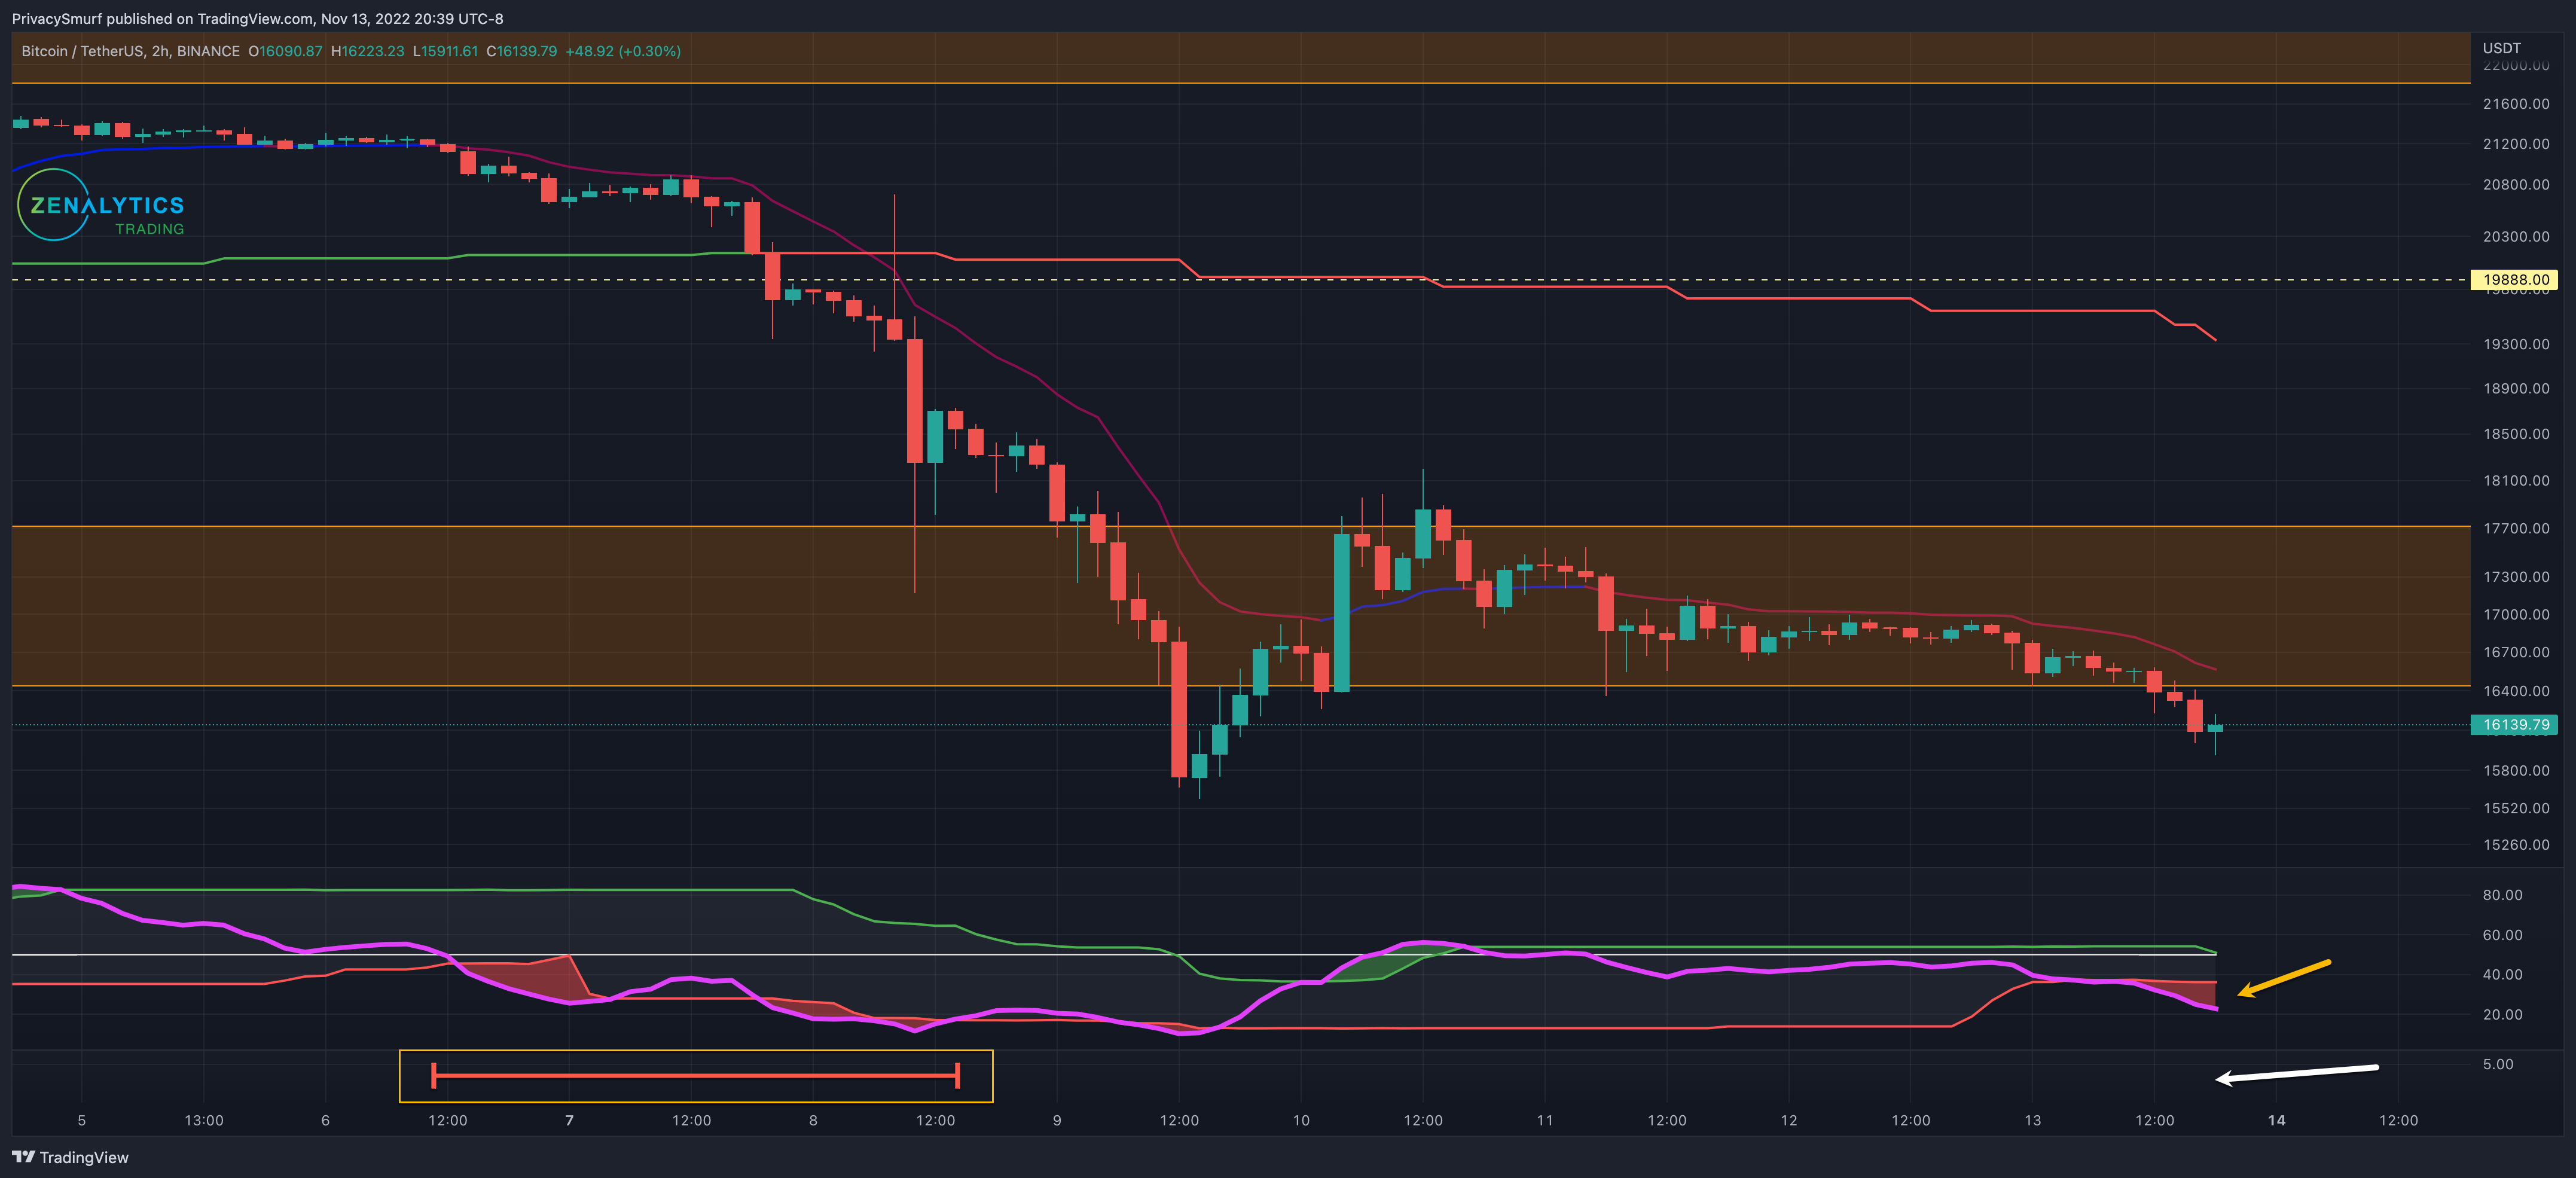
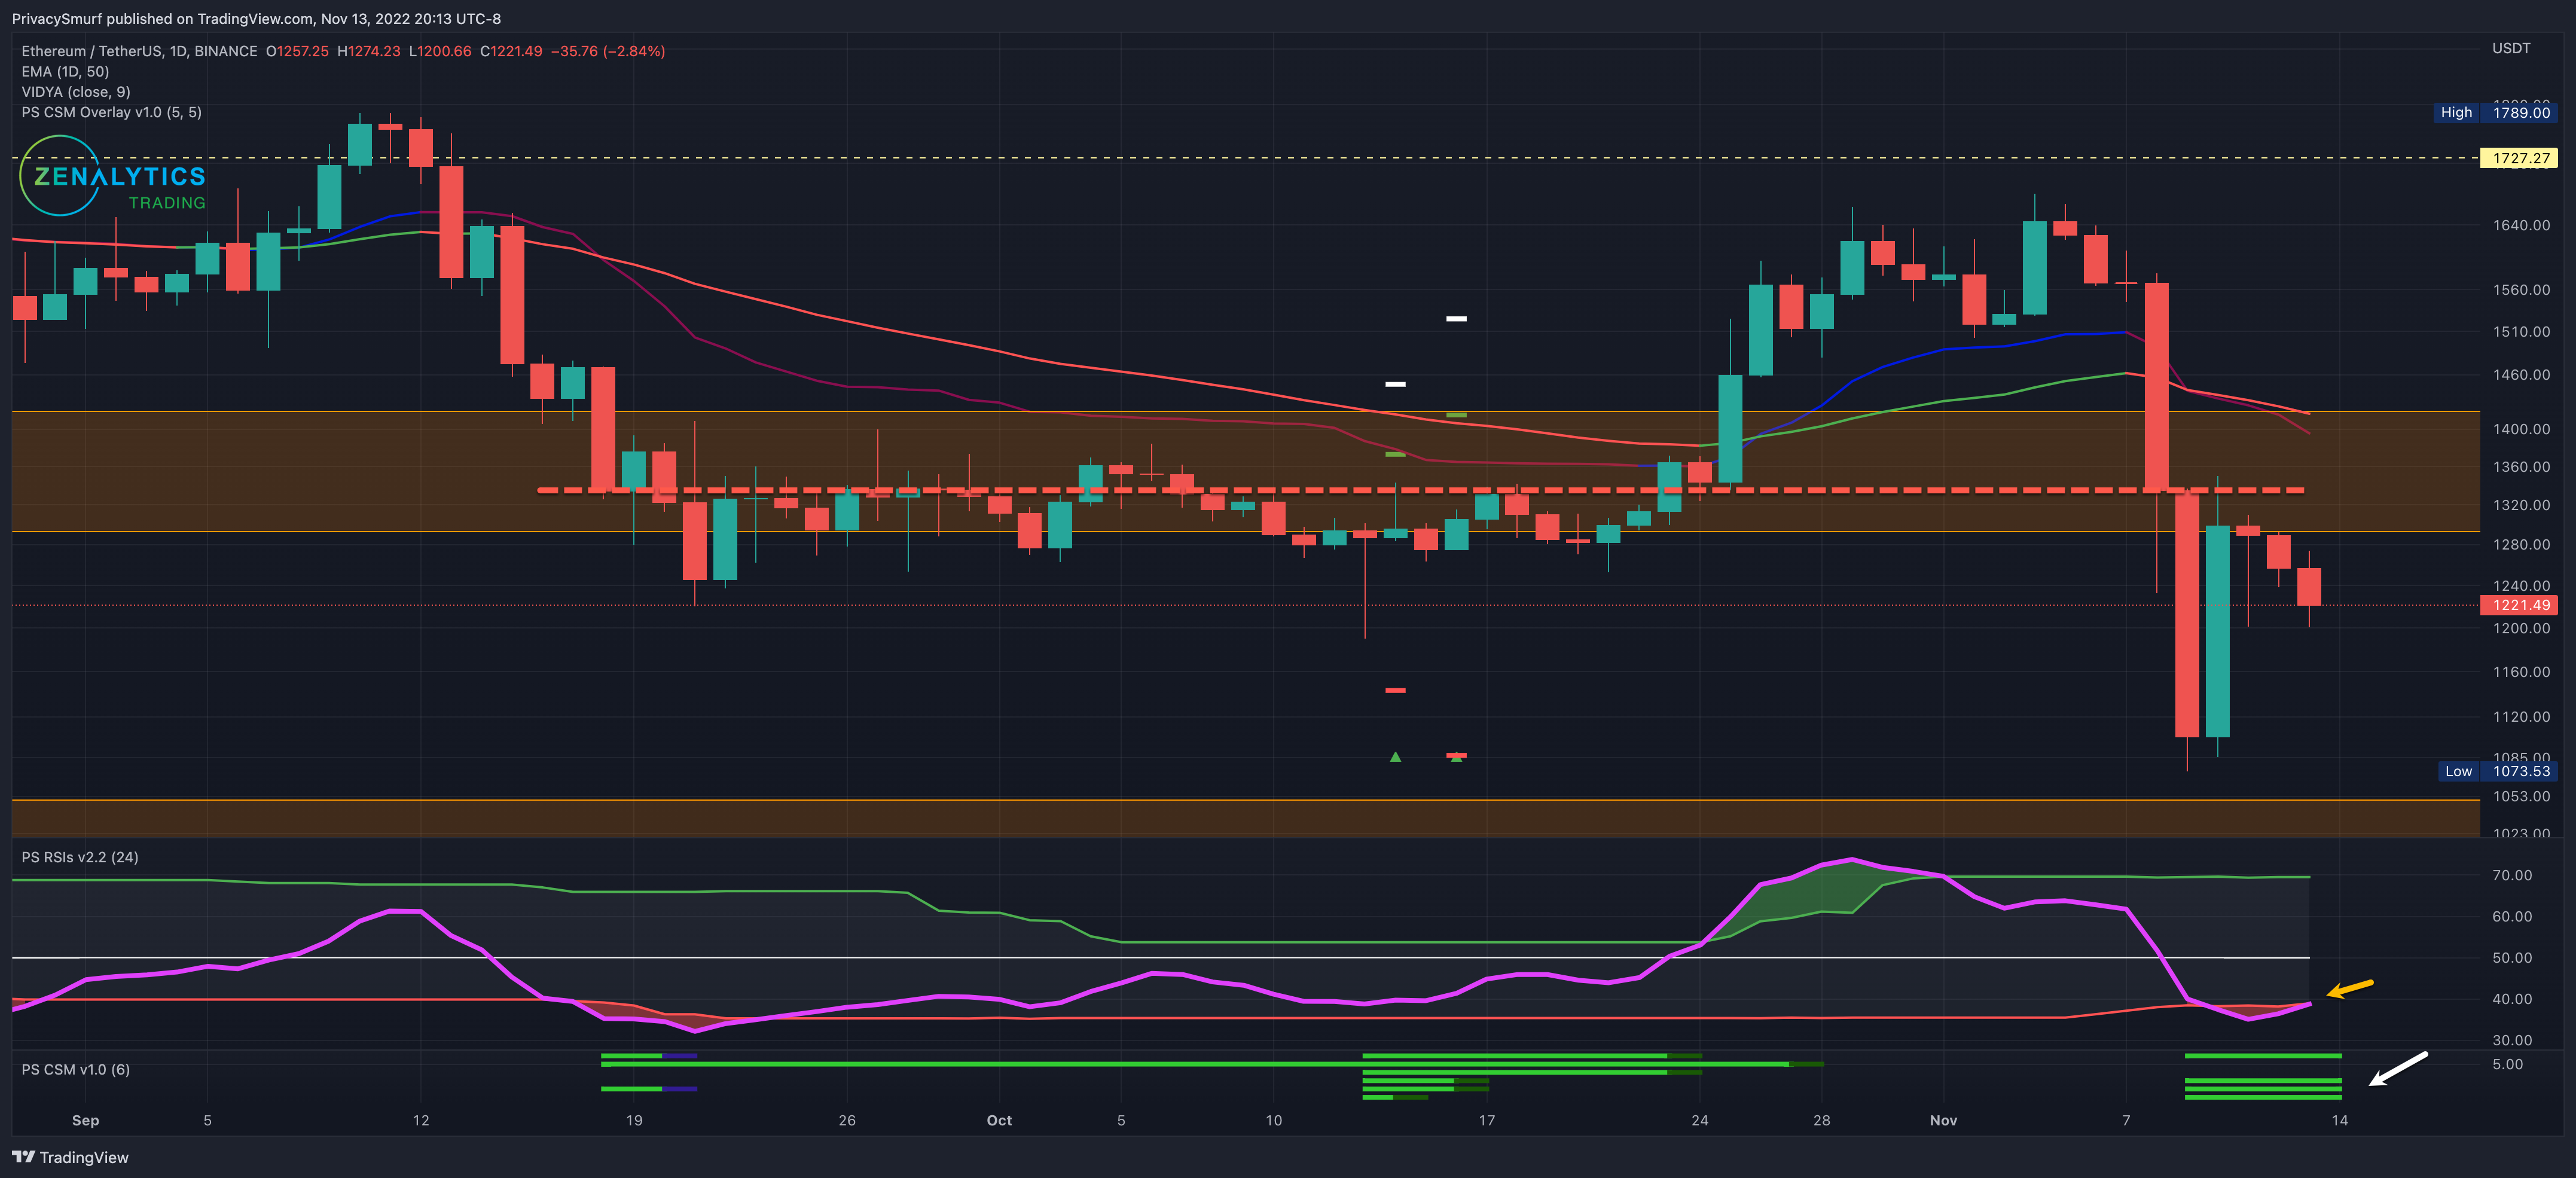
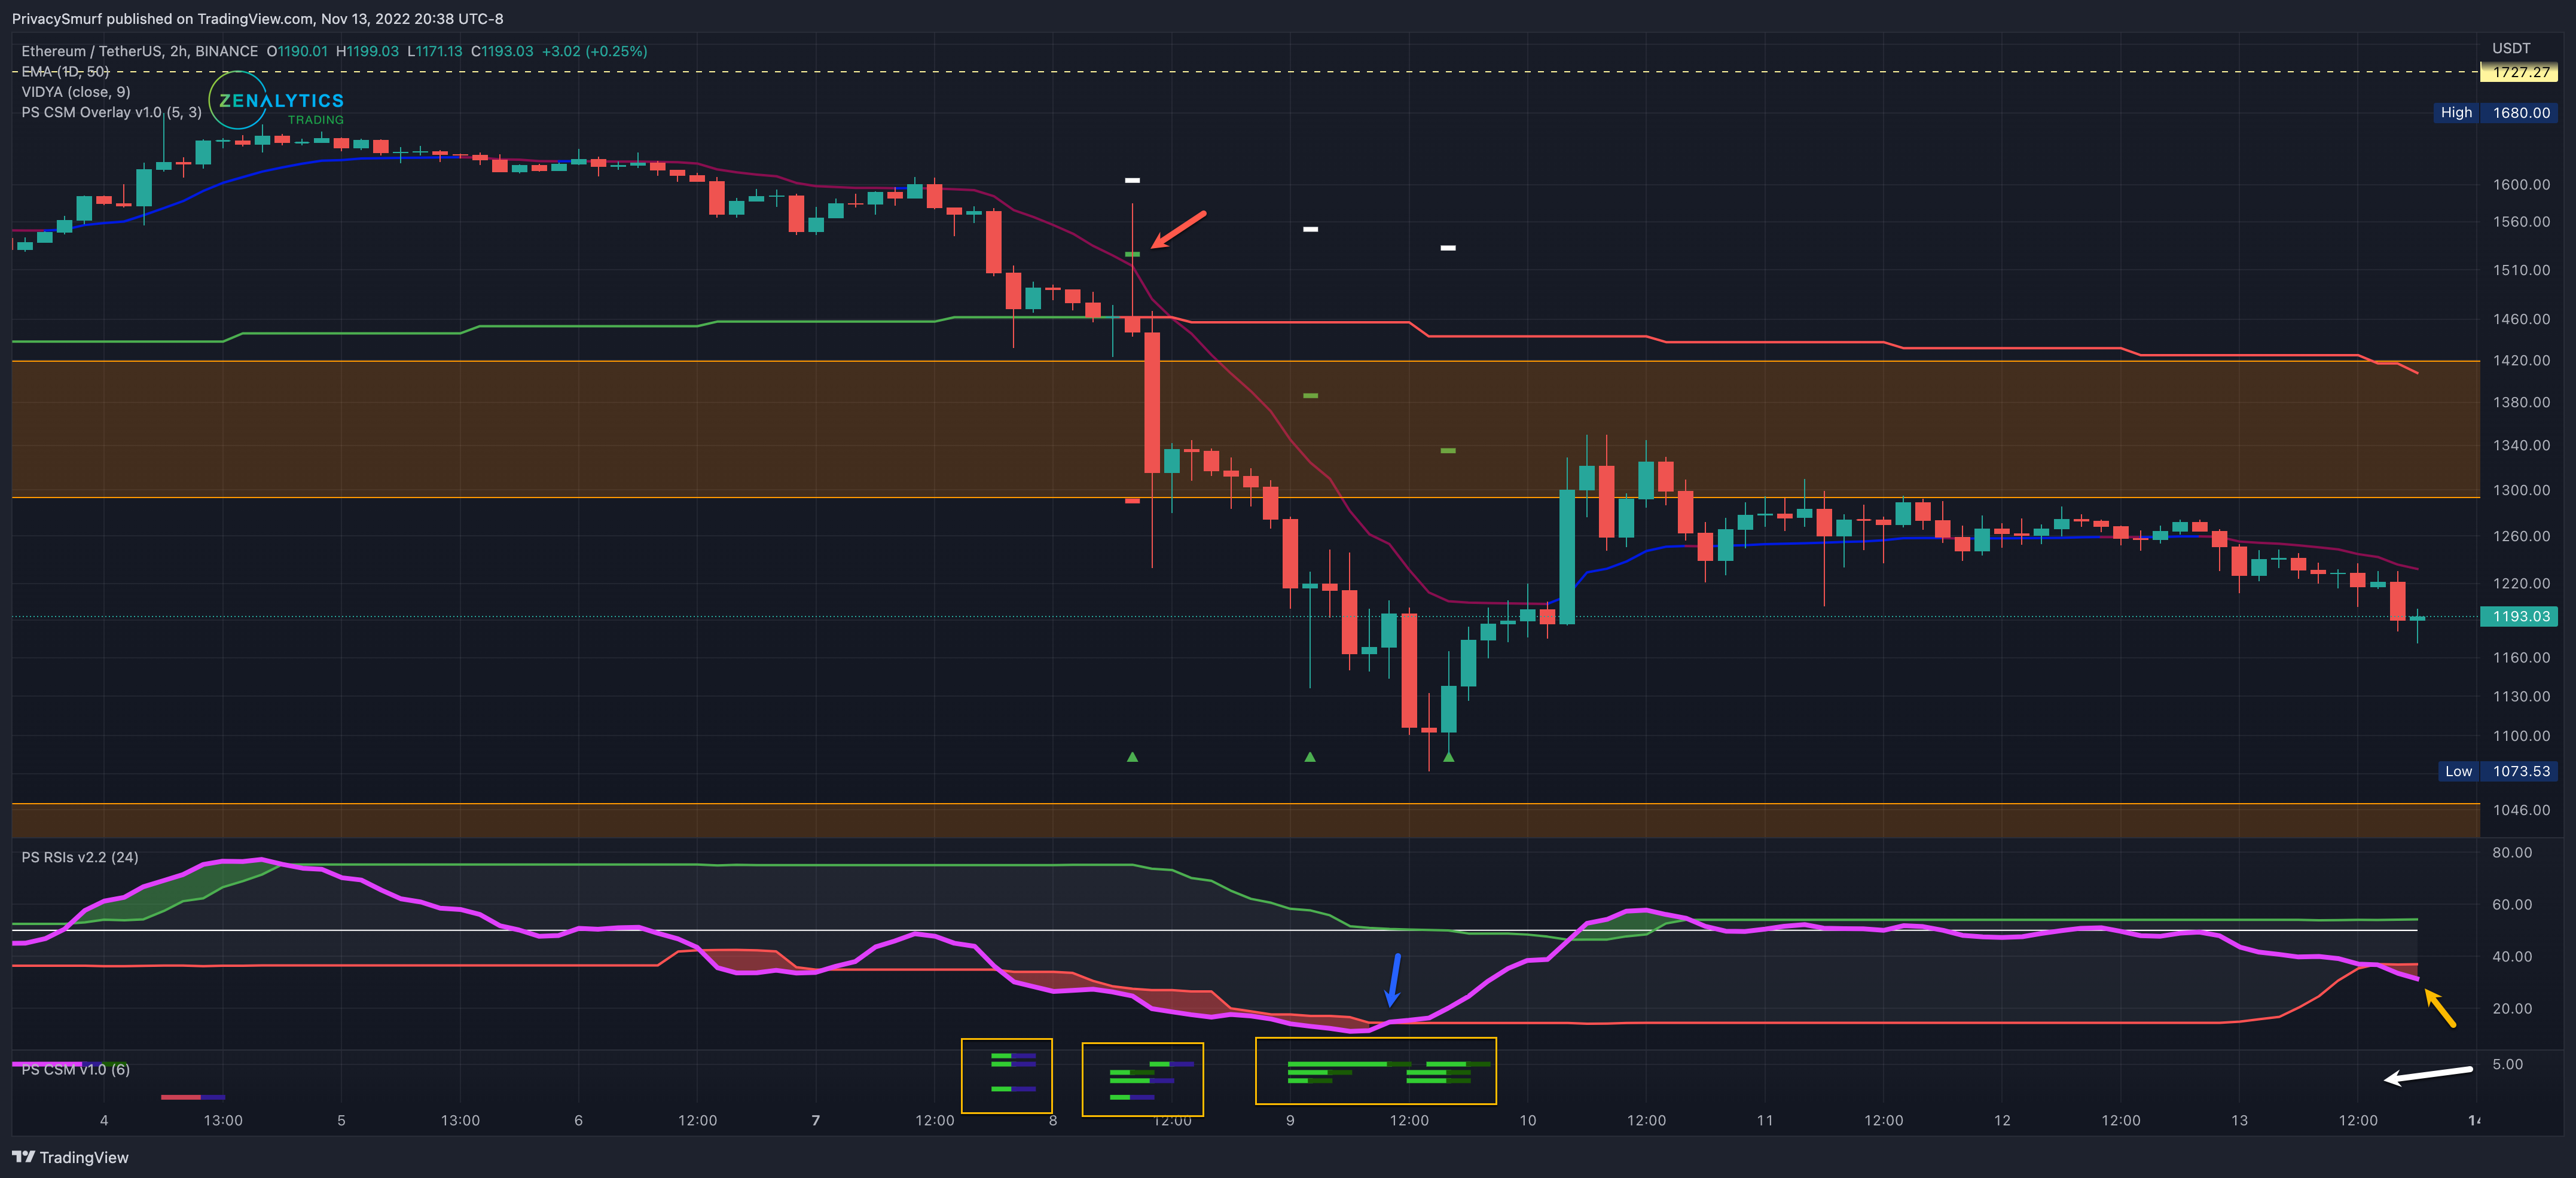
ETH/USDT Daily Chart
https://www.tradingview.com/chart/xbB6lkZu/
From last week:
“…RSI… is diverging in a bearish fashion… suggest a waning of momentum and another retracement… less-than-ideal situation… the risk of a bearish break increases… there is a greater risk for exposure to ETH and alts…
Last week's retracement played out with a vengeance, and the 2hr timeframe did signal some bullish divergent trades however the first signal (red arrow) met targets on the triggering candle. This is VERY RARE and suggests an overwhelming bearing pressure. Subsequent bullish triggers appeared on my custom indicator at the bottom (yellow box). However, the RSI still measured below the bottom band, suggesting bearish volatility. I would avoid those entry signals. The final trade signal appeared when the RSI curled back into the band (purple arrow), suggesting the bearish volatility's end. This trade hit the first target before trailing off. No bullish divergences are still displayed at the moment, and the RSI is again breaking below the bottom band, which would suggest a short-term downside.
On the daily timeframe chart above, multiple oscillators in bullish divergence are shown by my indicator plotting green lines at the bottom (white arrow). The RSI (yellow arrow) has moved into the bands, suggesting a range is established, and bearish volatility is ending. I trust this sign from a purely technical standpoint, but I’m not doing anything with it yet. There’s still too much external influence on prices.
Given the current technicals for the week, I’m expecting ranging values. There is bullish divergence and an underlying buy bid but is battling against a confirmed bearish trend in prices. A wide range of 1050 to 1350 may cover prices for the week.
My bias this week is still bearish, prioritizing intraday shorts. even with the bullish divergence, I am very hesitant to consider new bullish positions on ETH and alts as the risk is substantial for more downside. I need more confirmation on bullish transitions on lower timeframes to influence that decision.
If you want some extra homework while waiting for the market to do stuff, start checking out resources on the self-custody of your crypto. I just finished working out all the DNS registration for the trading site. It was a mess. I’ll start unlocking some of that content this week!
@theprivacysmurf
Thanks for your guiding hand
Thank you, incredibly level headed as always with the insane market meltdown. Can't thank you ENOUGH!