

Sunday Synopsis #58: Take Me Out
Sunday Synopsis #58: Take Me Out
So if you're lonely, you know I'm here waiting for you.

This is the beginning of the end. I’ve started posting these on the new site. The Sunday Synopsis is free for all those who register on the site. This will all be done by the year’s end on Substack.
Hope to see you there.
Such a nasty time out there for the bulls. The crypto market feels like it’s on life support and everyone is holding their breath, like ‘if I move, this could die’.
BTC/USDT Daily Chart
https://www.tradingview.com/chart/jjSdFW4b/

From last week:
“… I expect prices to continue lower… range may be establishing… 15800 to 17800 may cover prices for the week.
The price range expected last week was covered in a single day on Monday. This was followed by a stagnant week and a solid red day to close the week. The technical conditions haven’t changed much from last week.
Given the week's current technicals, I still expect pricing in the $15800 - $17800 range. There are a few concerning factors. The last bullish divergences are invalidated with price action oscillators setting new lows(white arrow). This suggests the potential for bearish continuation. Also, the RSI (yellow arrow) is bending back down towards the adaptive bottom band. Some downside volatility may follow a breach below. Perhaps this leads to wicks below the support.
My bias this week is still bearish, but considering the price is closer to support at the moment, shorts wouldn’t be entertained unless there are daily closes below the support, and I’d look to play the failure of the $15800 level. Intraday bullish divergences may be good, yet risky plays to the long side when the price gets to the support.
ETH/BTC Daily Chart
https://www.tradingview.com/chart/gTkSjkj6/
From last week:
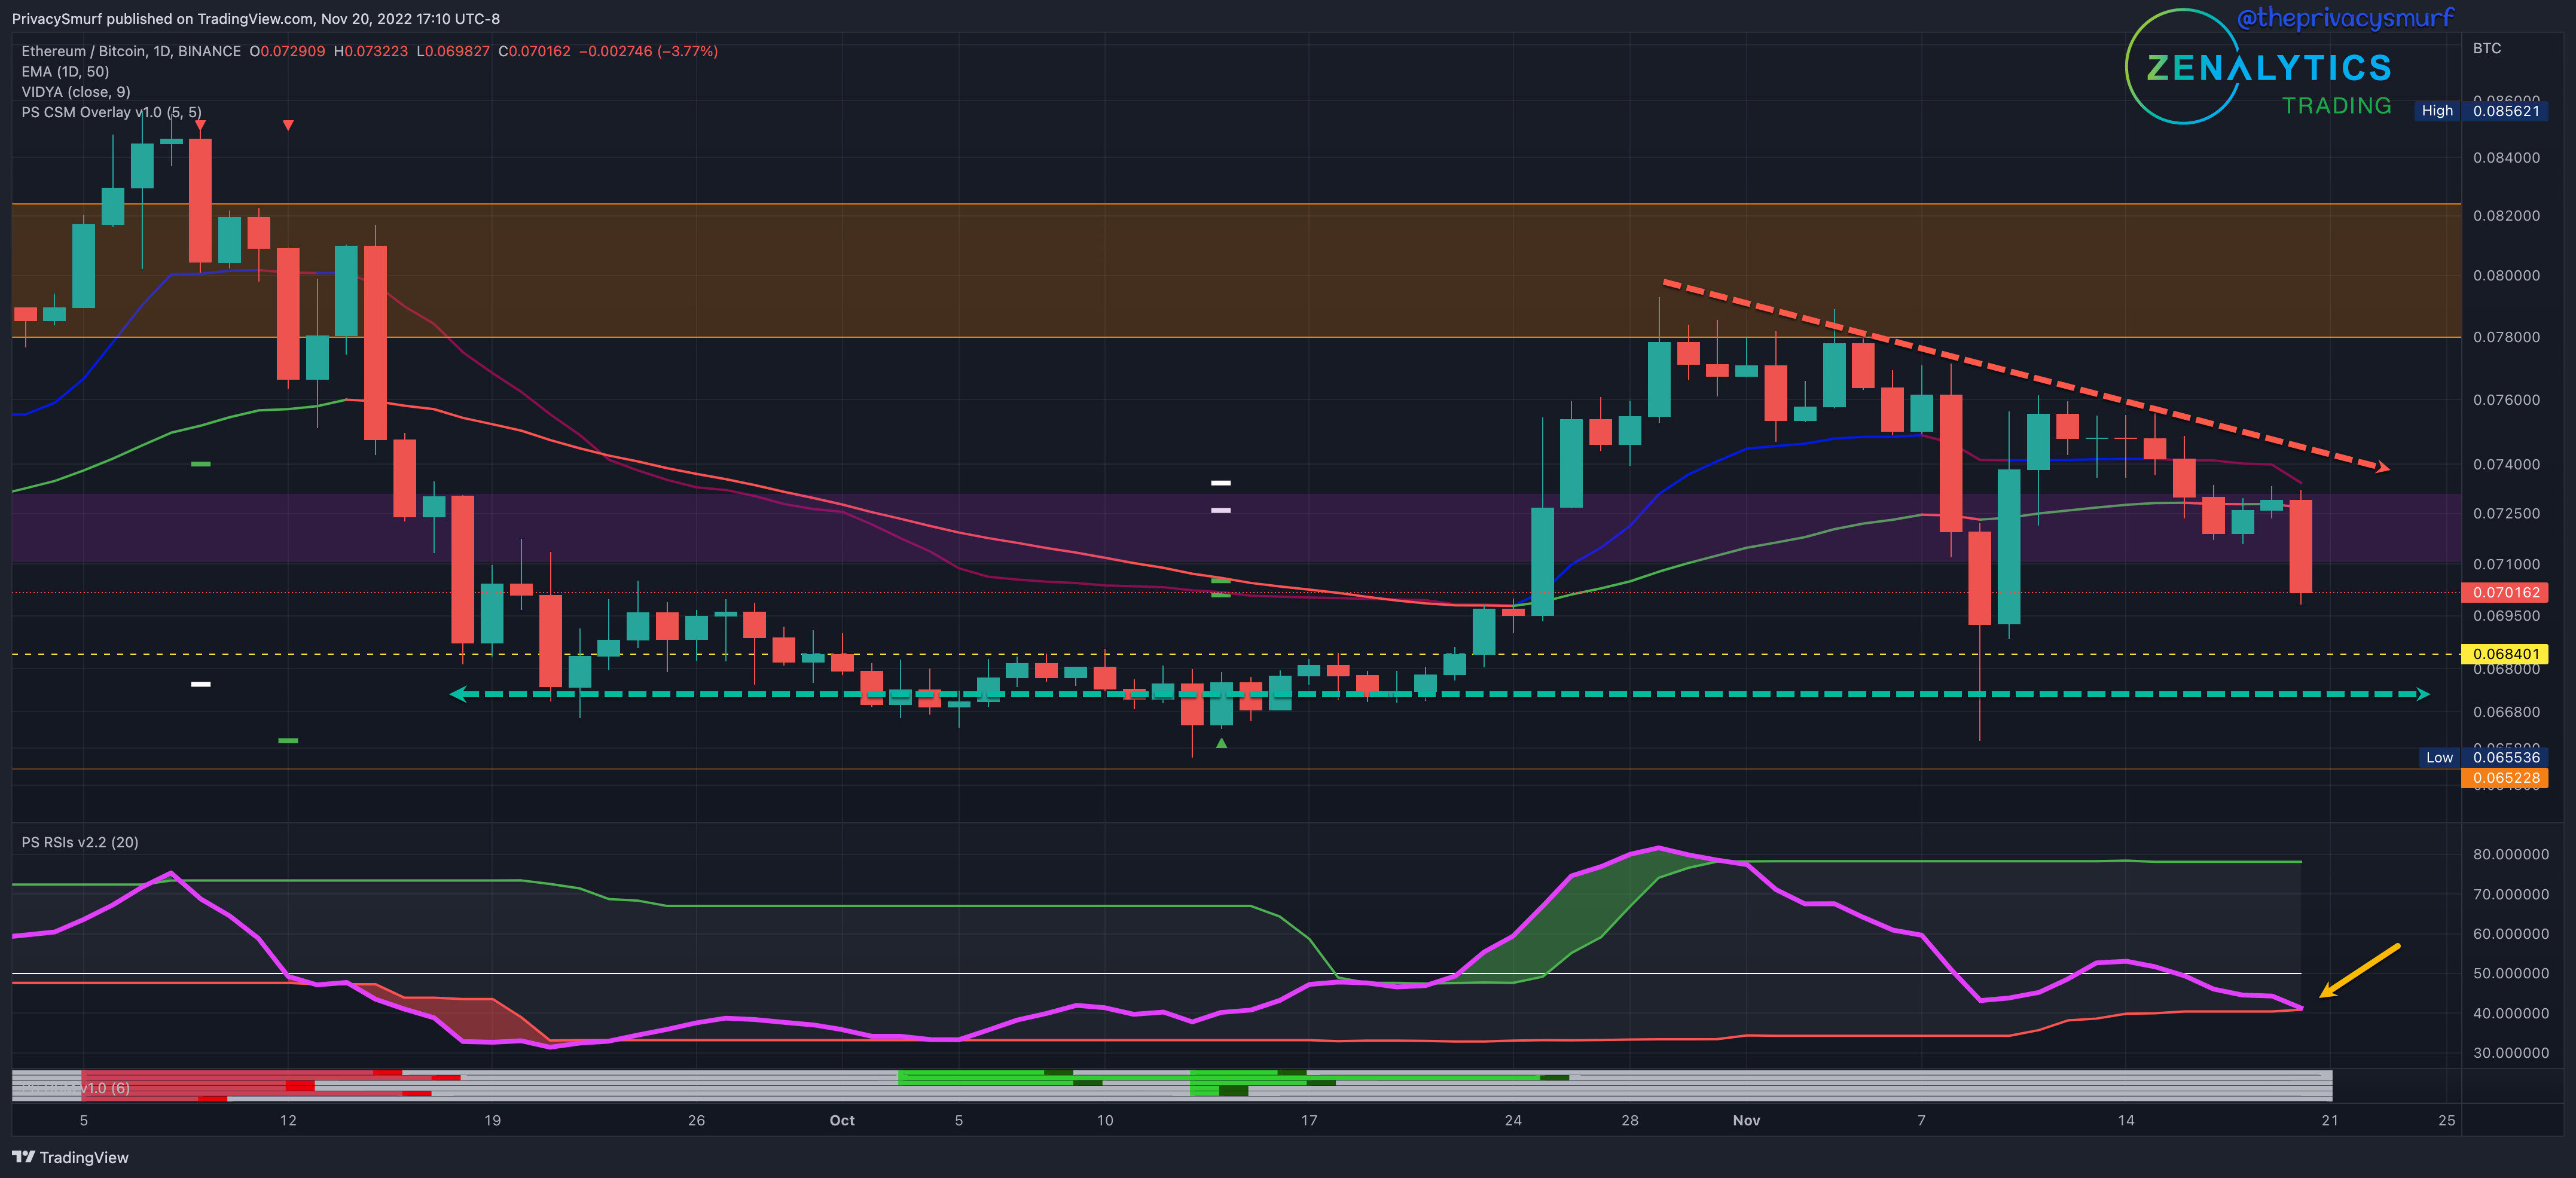
*“…*trend is still bearish despite this rebound… 50-Day EMA failing again would likely see another violent reaction to the downside… coincide with a failure of the current support around 0.073… hesitant to make the levels from 0.073 to 0.078 the trading range… bias this week is still bearish… risk is substantial for more downside…“
There wasn’t much range in values in the ratio of ETH to BTC, as the chart plotted mostly bearish candles. The 50-Day EMA and 0.073 level failed, and the week ended with a larger bearish candle. The trend still very much remains down. A big-picture compression pattern can be drawn with a descending trendline and lower-range support. This may lead to a volatile break, but that may take some time to materialize.
Given the current technicals for the week, I’m expecting more bearishness. The RSI is currently presenting a bullish influence below the midline and teasing a bearish break of the adaptive bottom band. This suggests downside volatility. A test of the low support or wicks below this week is within expectations.
My bias this week is still bearish, prioritizing intraday shorts. There is no bullish divergence on this timeframe, so I am very hesitant to consider new bullish positions on ETH and alts as the risk is substantial for more downside. I need more confirmation on bullish transitions on lower timeframes to influence that decision. Exposure in bullish positions for ETH and ALTs is still not within my risk tolerance.
ETH/USDT Daily Chart
https://www.tradingview.com/chart/xbB6lkZu/
From last week:
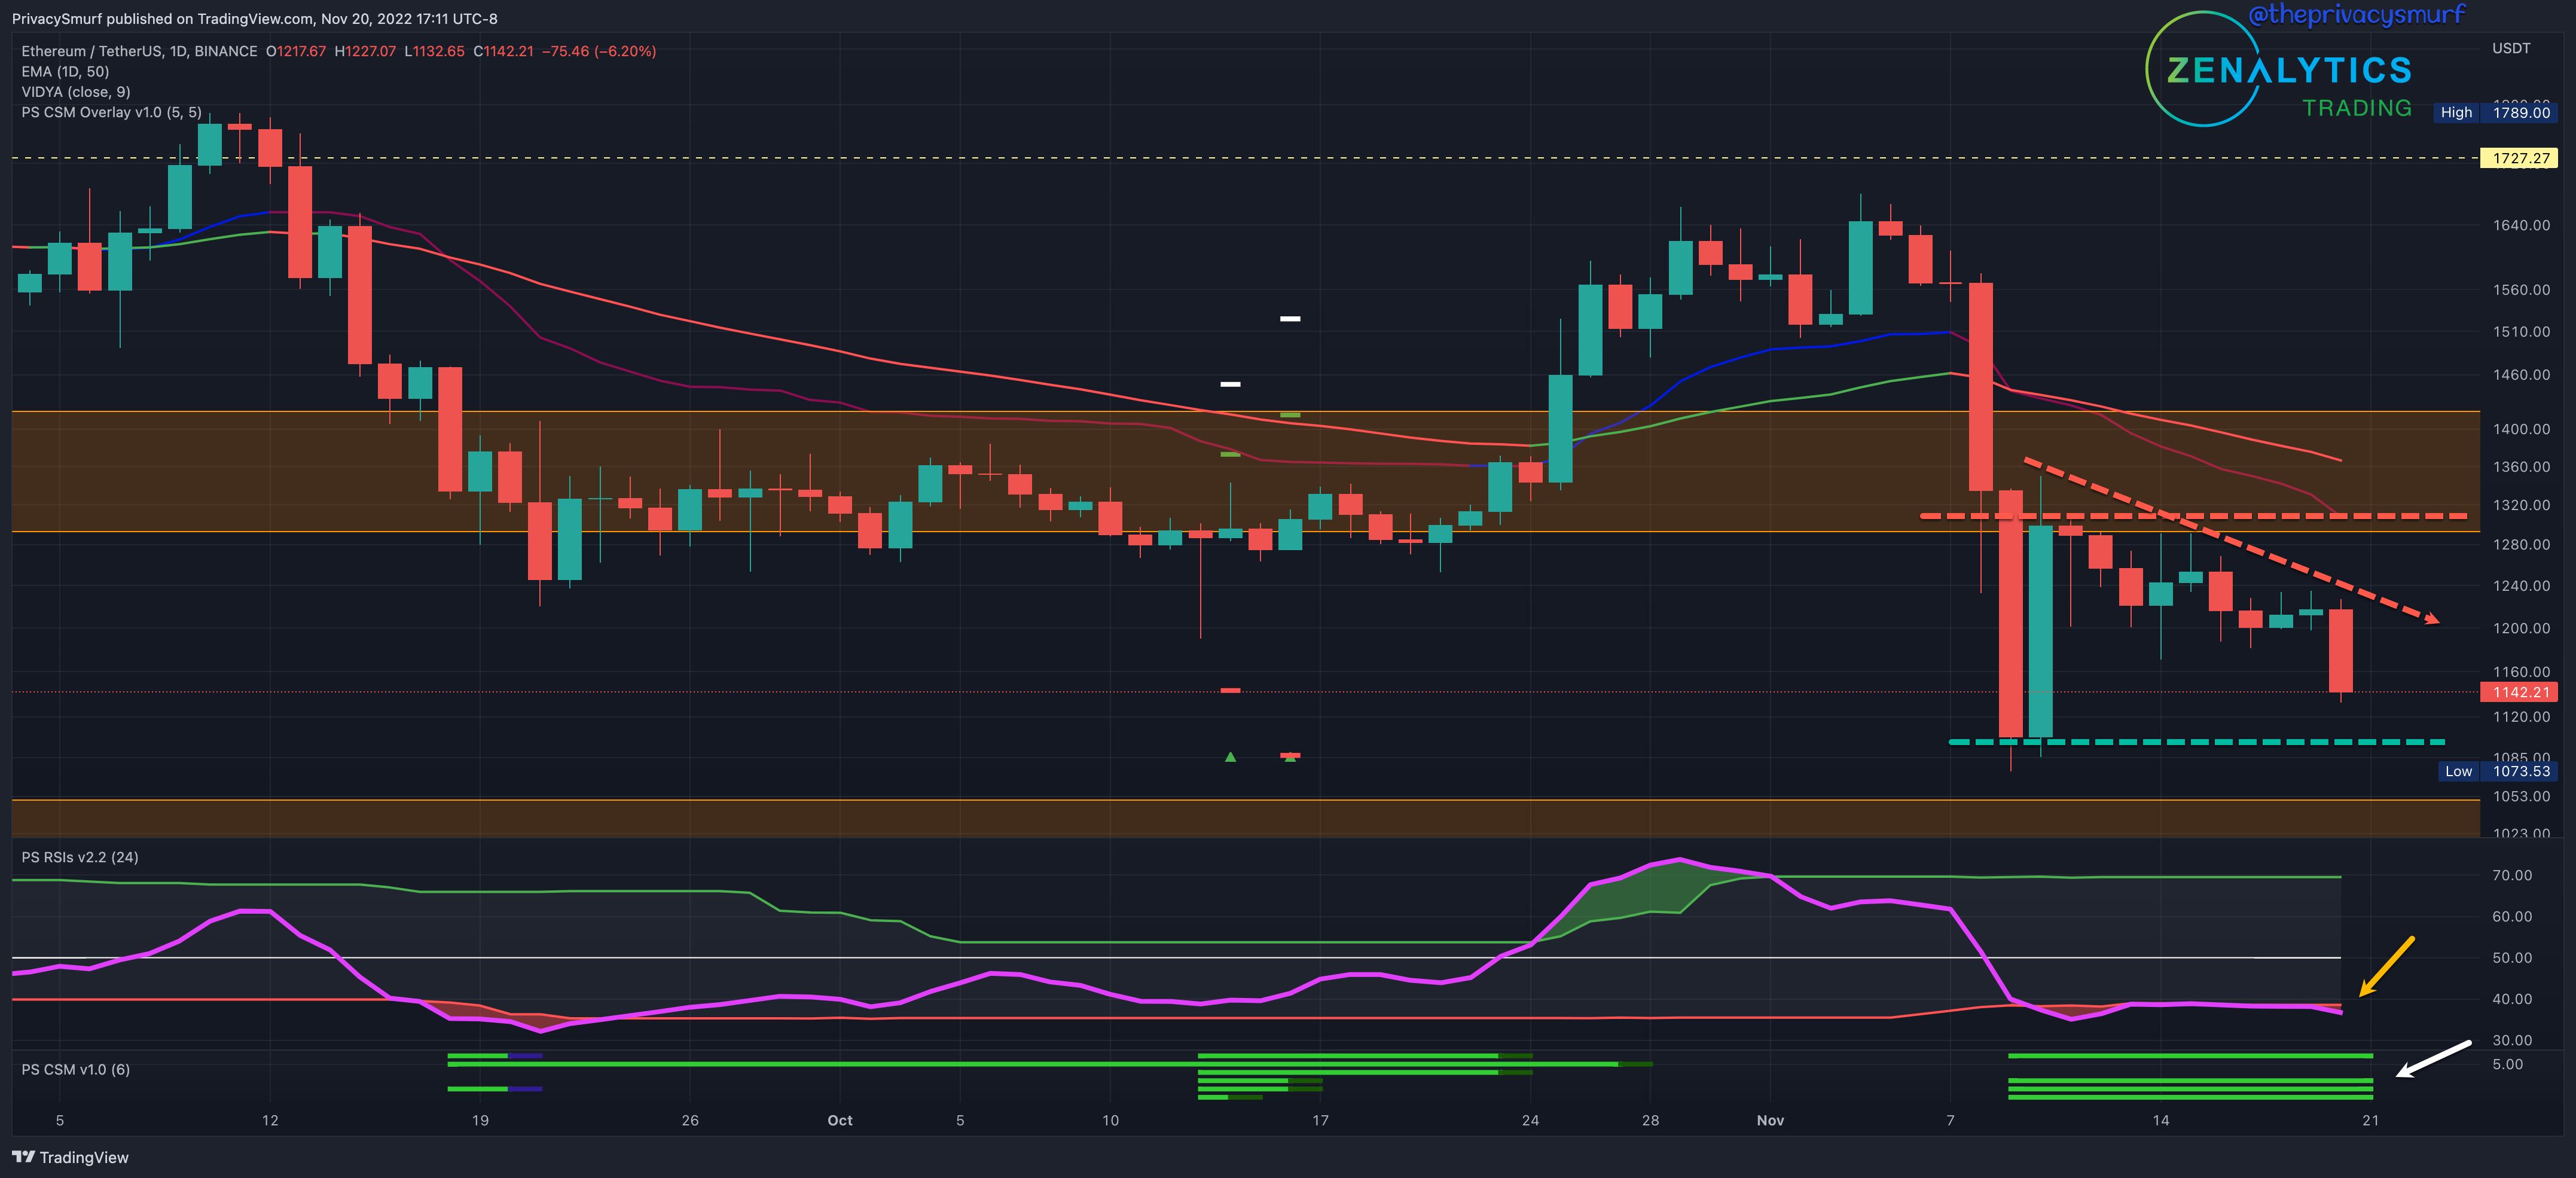
“… RSI has moved into the bands, suggesting a range is established… I trust this sign… but I’m not doing anything with it yet… range of 1050 to 1350 may cover prices for the week… My bias this week is still bearish… even with the bullish divergence, I am very hesitant to consider new bullish positions on ETH and alts as the risk is substantial for more downside…”
Last week, caution and patience were the right calls with long positions on ETH. The trend still very much remains down. The RSI (yellow arrow) is still below the adaptive bottom band, so the potential for bearish volatility still exists. The Correction Strength Meter (white arrow) still shows a bullish divergence on my custom indicator. This suggests an underlying buy bid, but it will be important to continue monitoring oscillators as new low measurements are near, and invalidation is possible. A compression pattern can be drawn with a descending trendline and lower-range support. This may lead to a volatile break, but that may come into play later in the week.
Given the current technicals for the week, I’m expecting ranging values. There is bullish divergence and an underlying buy bid, but it is battling against a confirmed bearish price trend. I’m still keeping the wide range of 1050 to 1350 to cover prices for the week, but wicking below support is possible.
My bias this week is still bearish, prioritizing intraday shorts. Still, considering the price is closer to support, shorts wouldn’t be entertained unless there are daily closes below the support, and I’d look to play the failure of the $1050 level. Intraday bullish divergences may be good, yet risky plays to the long side when the price gets to the support.
It feels good making the first post on the new site. I hope you are enjoying the stuff so far. I’ll have more content out this week.
@theprivacysmurf