

Sunday Synopsis #7
Sunday Synopsis #7
They wanna get my They wanna get my gold on the ceiling

I hope you were following along yesterday. If you weren’t you sort of missed out on a great trading opportunity. It sure happened faster than I was thinking it would but there’s no way to really time things like this. It’s all about recognizing the setups and being prepared ahead of time. I underlined the critical part.
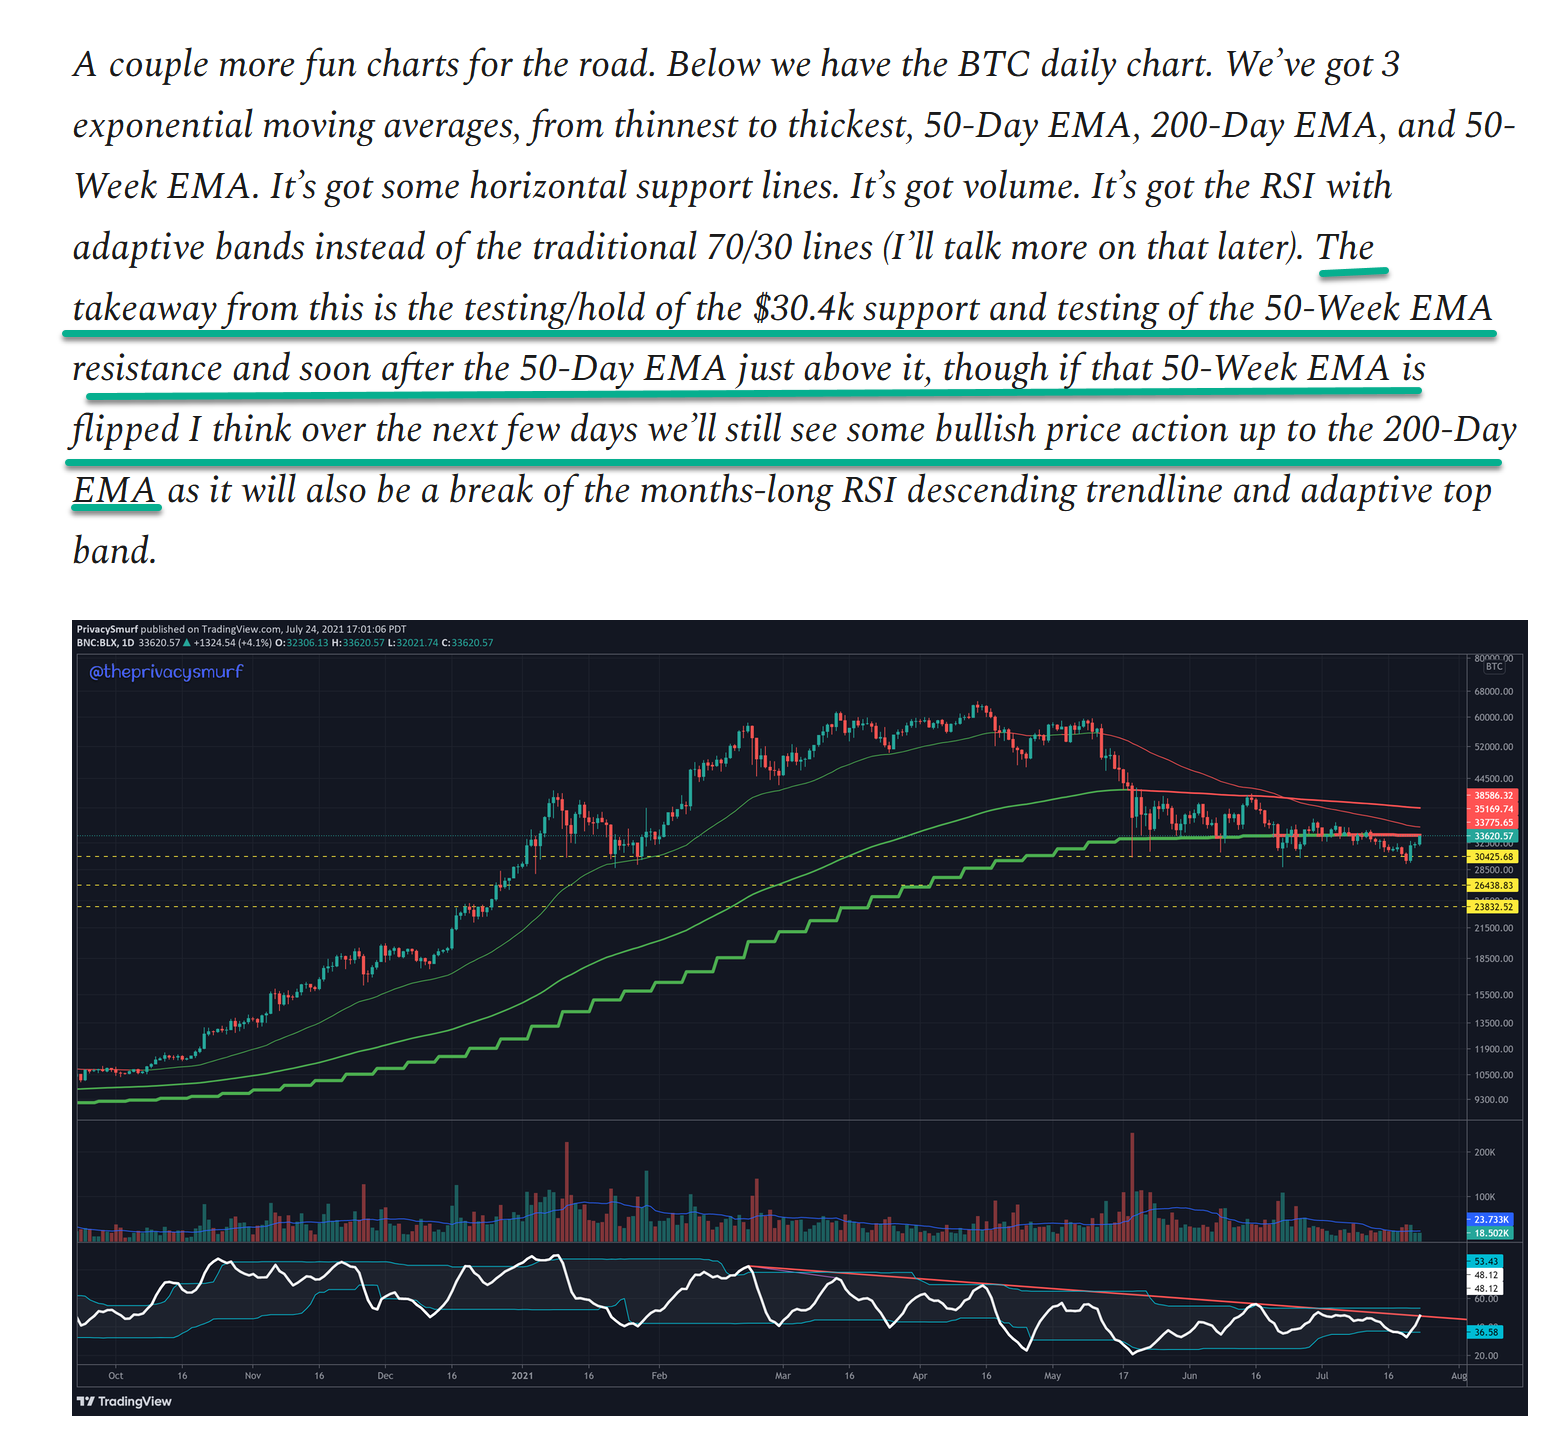
And today that played out as suggested .

Multiple opportunities to buy in on the support test of the 50-Week EMA.

Ok. That’s enough back-patting, haha. I mostly just want you to recognize that the stuff I’m saying works and I’m hoping you are trying to absorb the info so you can replicate it for yourself because the stuff works on every different asset class. You can trade more than just BTC. I can’t/won’t catch every good setup. I can’t/won’t be around forever. I’m trying to help you all become self-sustainable by explaining my process and providing consistent and repetitive analysis that you can compare with your own thoughts. By now if you’ve been following along you can reasonably assume that every Sunday (unless I’m a jerk and away/busy) there will be a write-up from the top-down, weekly to daily, and sometimes lower on BTC/USD, ETH/BTC, and ETH/USD. During the week try to replicate what I do BEFORE you read my Sunday newsletter. Compare your results with mine afterward. See how the week plays out. Where were you and I right or wrong? Feel free to comment about it. I’m happy to answer questions or address comments. Alrighty, on to the normal post.
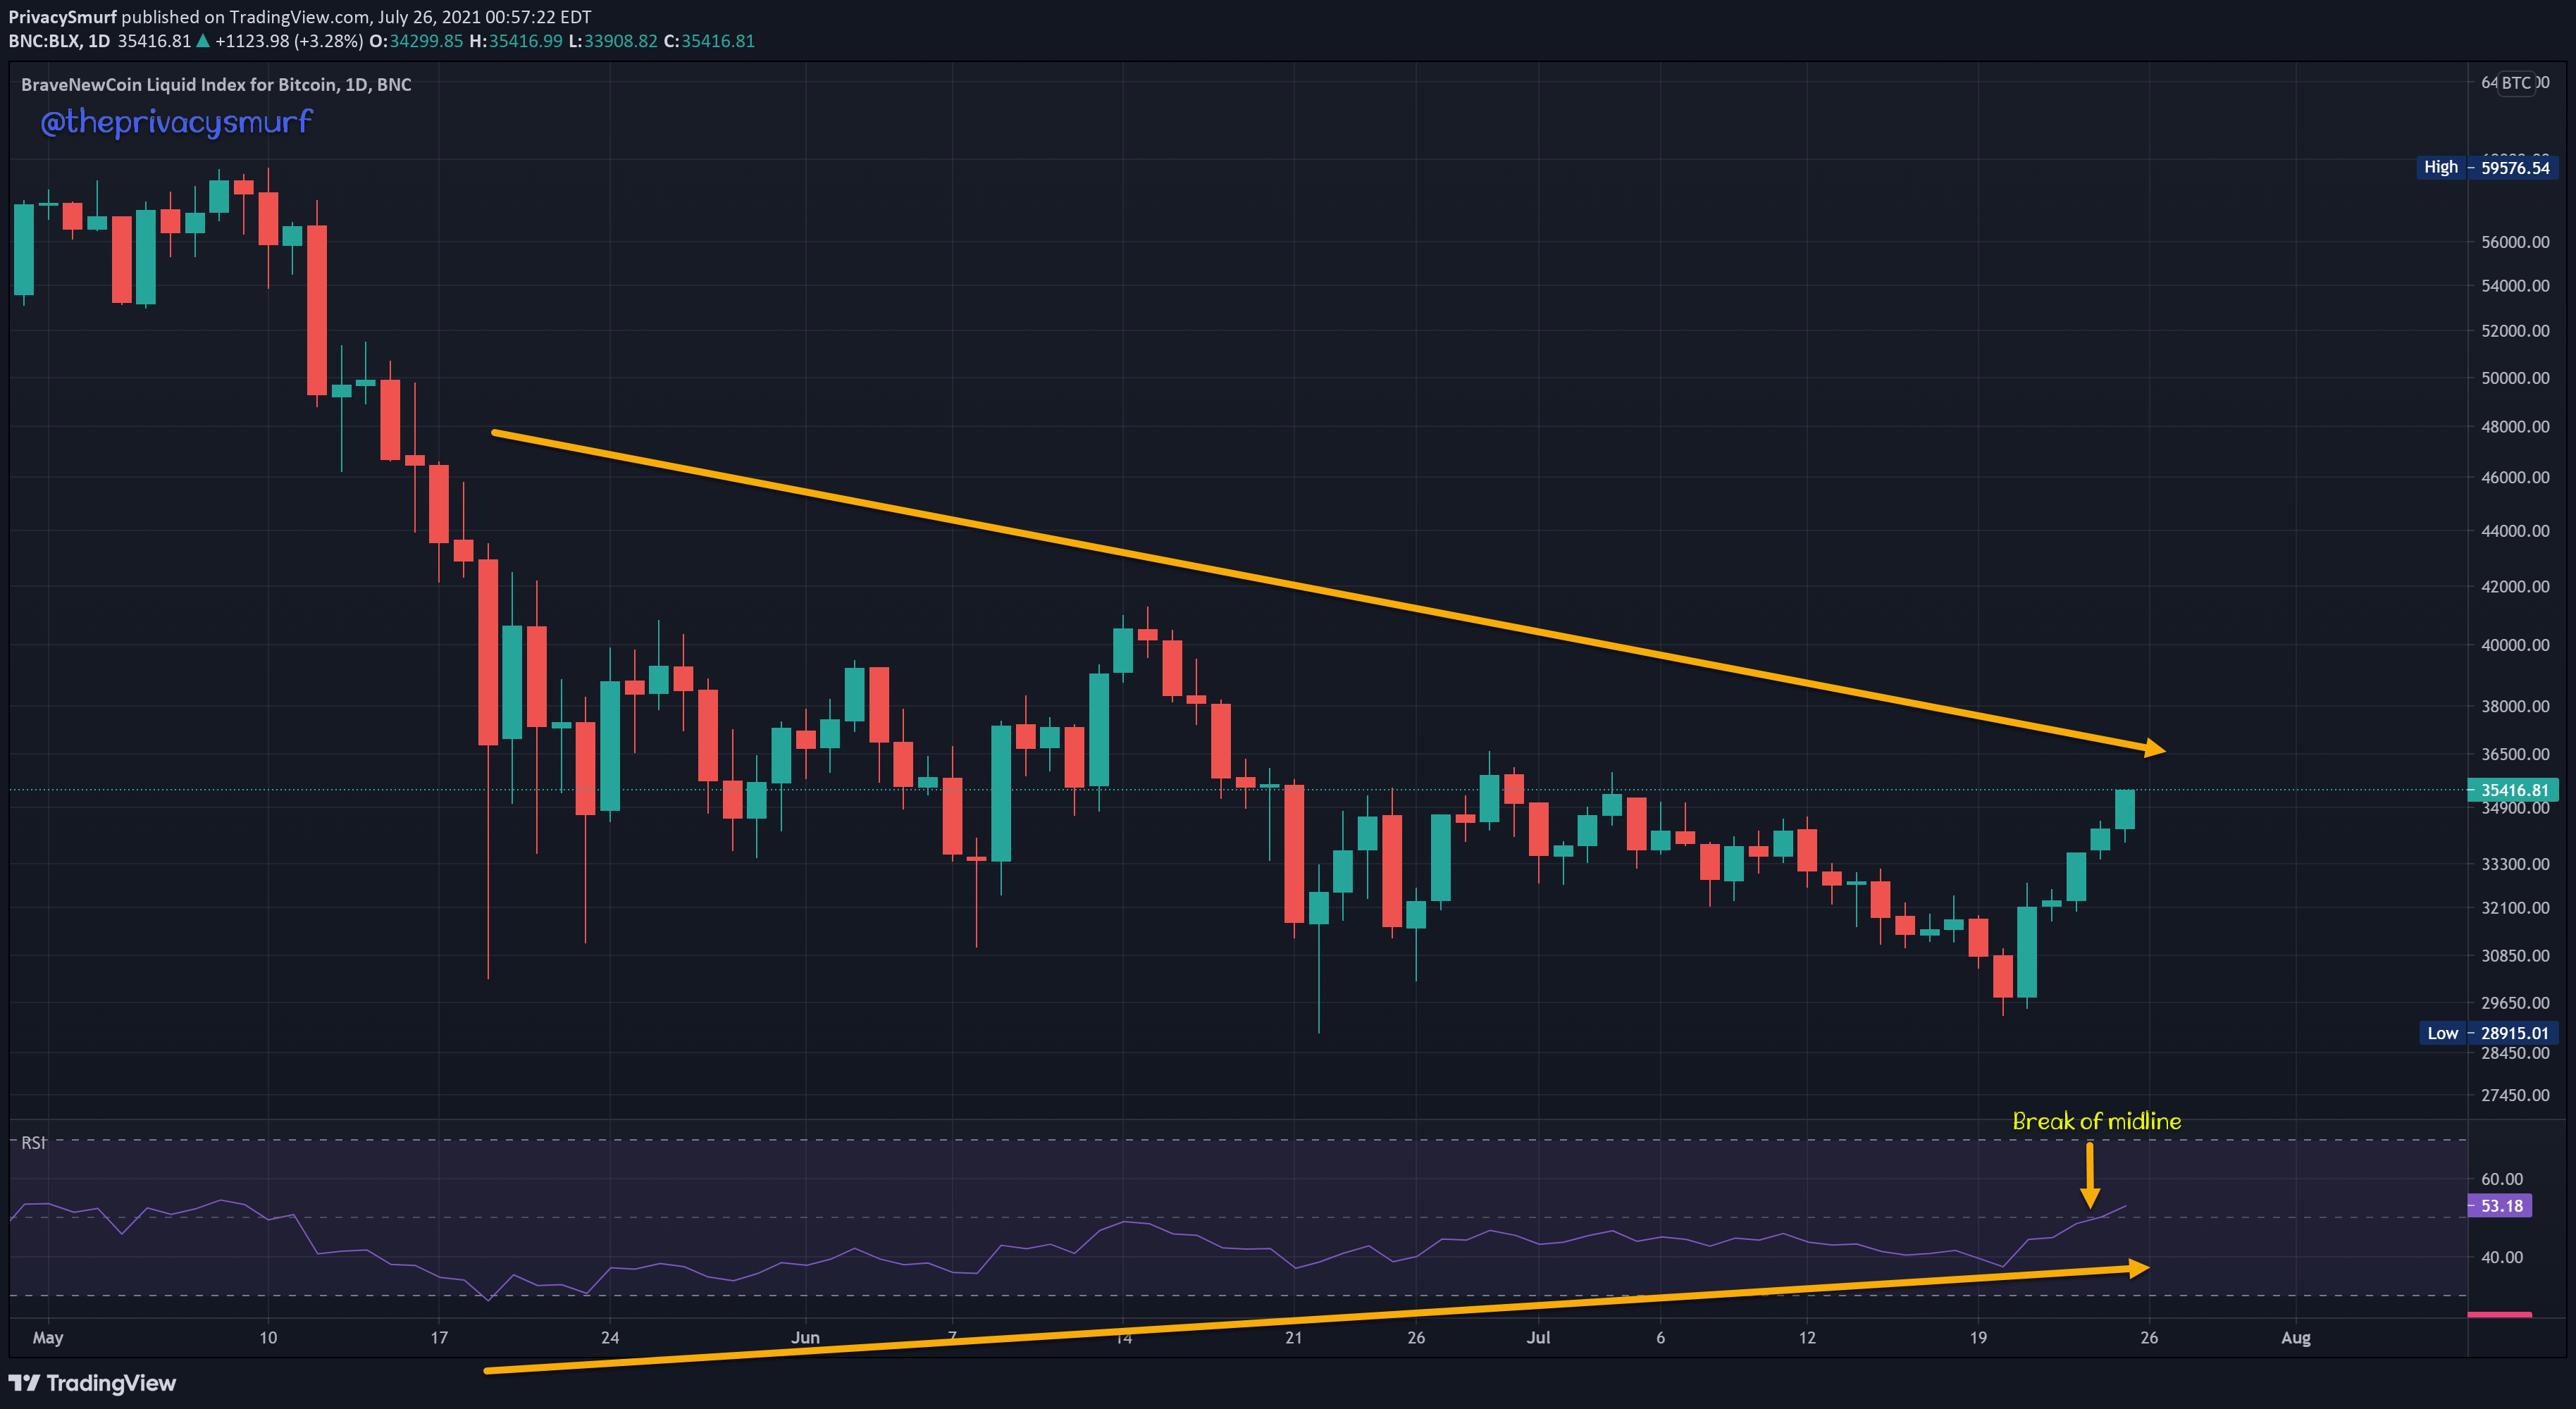
The wild price action today really sorta skews the charts. It occurred AFTER the weekly close but I can’t in good conscience ignore it and pretend like it doesn’t have any relevance. This Sunday will be a bit weird. I’m not gonna put it everywhere but just know that in front of every chart there’s a big *.
The weekly chart of BTC closed above the prior high close. The current market structure support is sitting at $31796 and the next highest resistance is at $39024. A weekly close above that and we are starting to sit pretty.
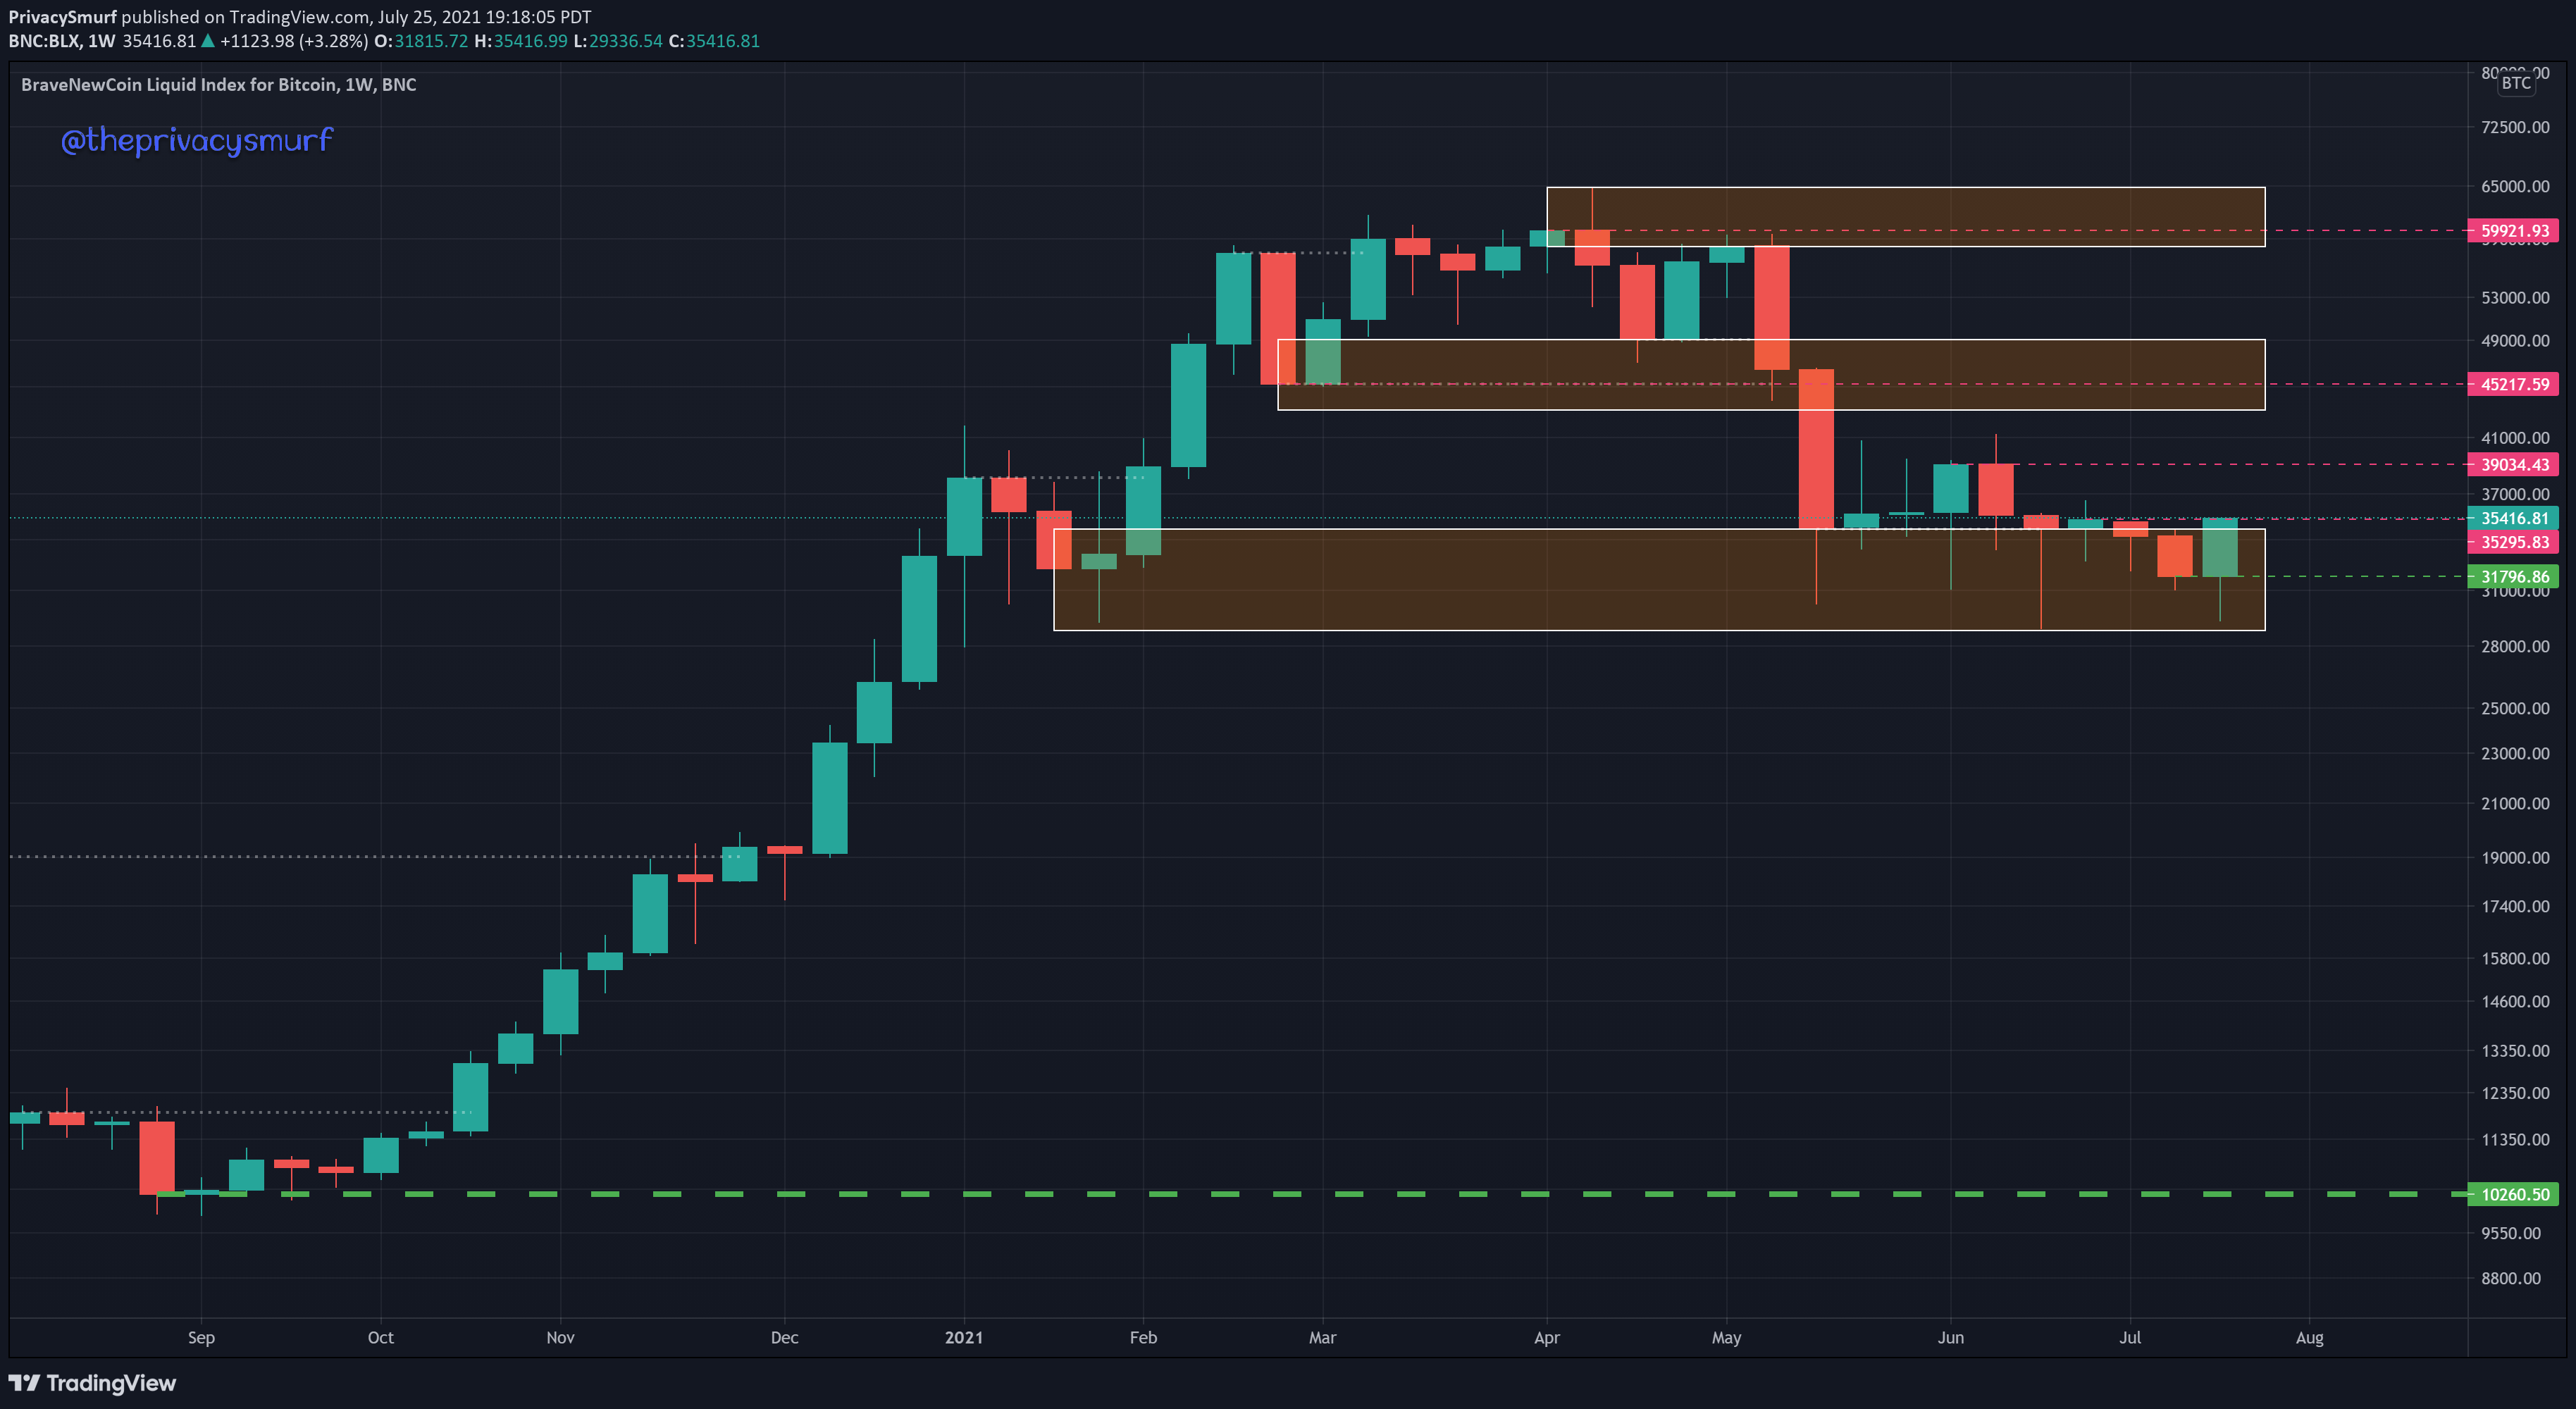
The value relationship of ETH/BTC is relatively unchanged this week. I don’t expect much action here and won’t really expect any major breakthroughs in the altcoin market outside of typical market increases matched with BTC until a break of .065822 sats and then the alts should really start increasing once ETH has surpassed .077152 sats.

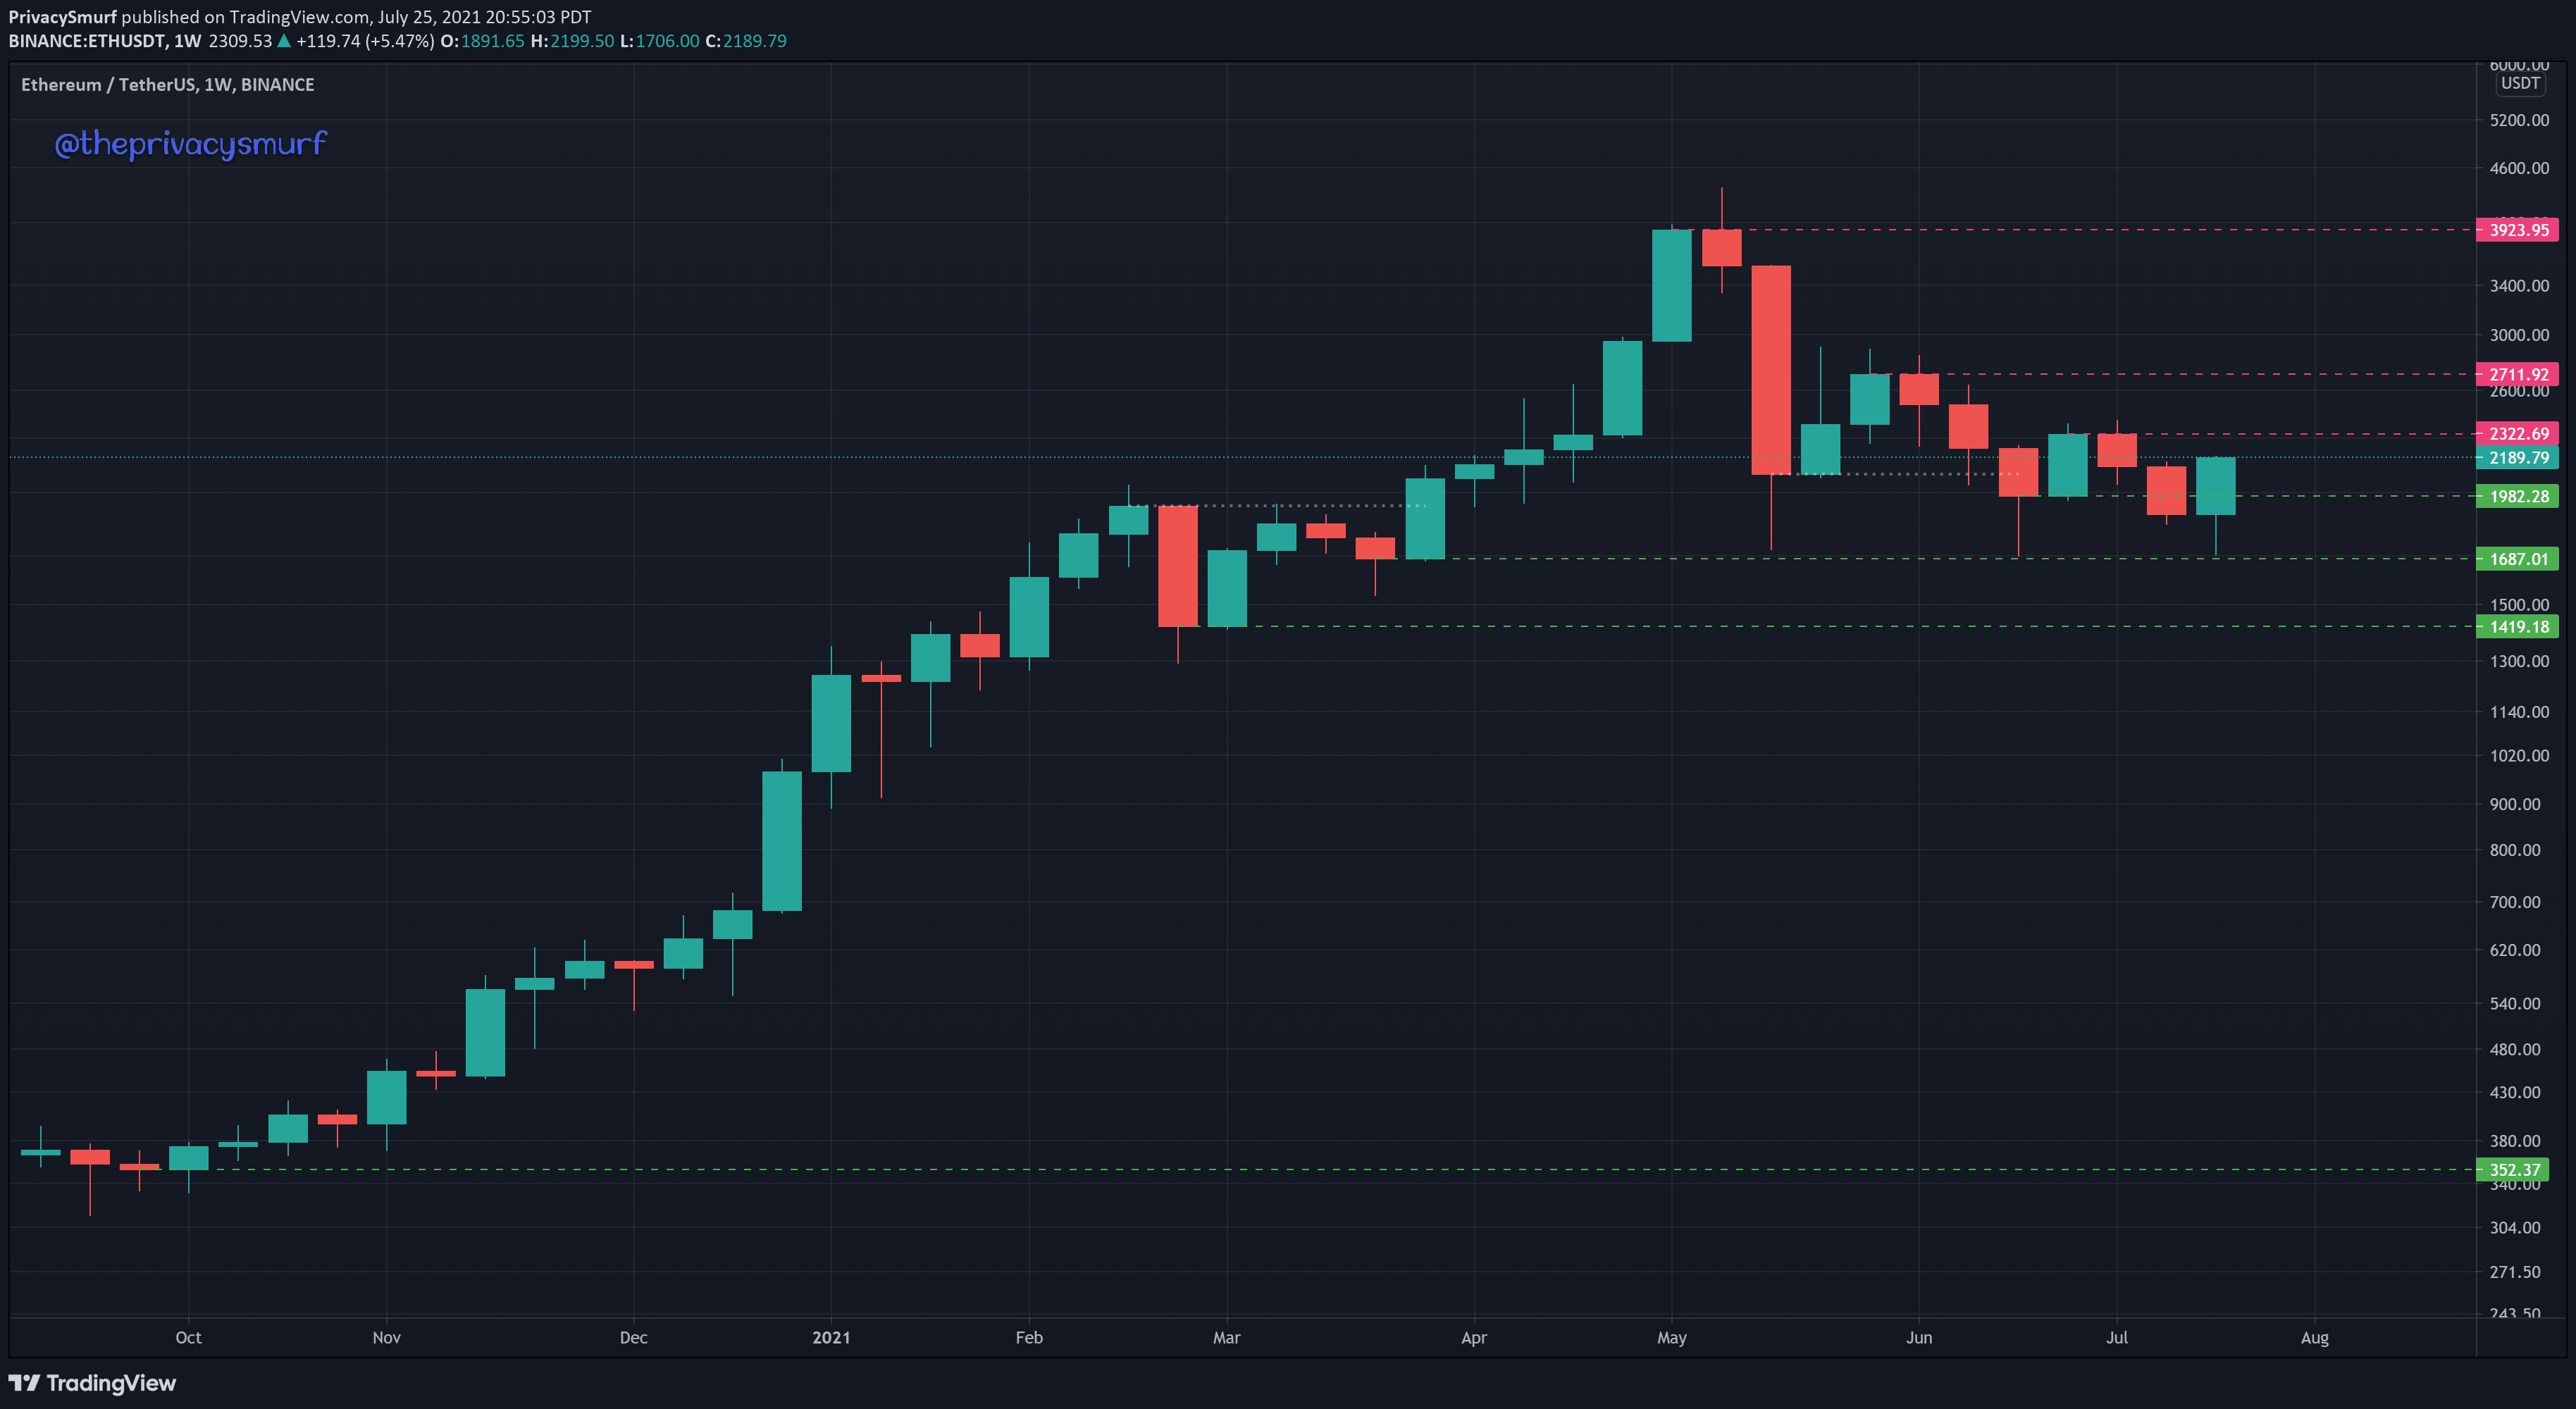
If you are a long-term ETH accumulator and you don’t have staged buy orders around 1687-1700 I’d like to hear your reasoning why. That price range is consistently showing it holds value for the bulls and has been respected 3 times now. This week closed as a bullish engulfing candle since the open and close contain the open and close of the previous bar. Presenting this way paired with the support it bounced off of paints a bullish picture. A close this coming week over $2322 would indicate a potential continuation of the bullish trend and move up to the next market structure resistance at $2711.
I don’t really want to get too further down in the timeframes since we had such a wild price move today. I’ll leave that for the Micro Monday post tomorrow. Instead, I’ll get into some other technical things that I look at to make a case for the bottom being in.
One metric I watch is William’s Accumulation and Distribution. It is a leading indicator that is measuring buying and selling pressure. Typical usage of Williams A/D has a trader looking for divergences in price and the WAD plotted line but I go a bit differently. Writing up a custom Tradingview script and adding in a moving average of the Williams A/D plotline gives you a way to measure the trend. When WAD is above the moving average that’s bullish, when WAD is below the moving average that’s bearish.

Today we closed with the first bullish WAD trend since April. While there’s still a ways to go before I think the prices will be hitting the ATH this is a crucial first step.
Another metric that I mentioned in the post yesterday is the bullish divergence on RSI and the final push over the long-term RSI descending trendline and the midline of the RSI.
Last is a less objective measure but an important part mix of market psychology and identifying areas of liquidity for large volume buyers.

The 2 previous above photos show that the market technicals are bullish but price action has not been matching. The recent dip and rally make the strongest case for the floor being created, in my opinion. Big money needs liquidity to execute orders without massively moving the price and a really juicy pocket of liquidity just presented itself again. All buy orders have to be matched by sells or else nothing happens. If big money wants to buy 5000 BTC retail has to sell 5000 BTC. Knowing where that liquidity exists is HUGE when it comes to locating potential tops and bottoms. The photo directly above shows the moment when the price was nearing $30k. The region below $30k is a pocket of liquidity for big buyers because there are lots of things that one can expect to happen there.
Traders in long positions will have stop losses under $30k because it has acted as support. If support fails you want to exit your position. To exit a long position a trader must sell.
The prior lowest market structure support on the daily chart was $30.4k. This day closed below that mark, indicating a potential for lower prices and the next lower market structure support is all the way down at $26k, and traders that were long prior to that probably don’t want to risk that value loss and want to lock in profits. This means the trader must sell.
Traders expecting further lower prices will look to short the breakdown of $30k. To enter a short position a trader must sell.
All these conditions create a perfect storm for big money to enter long positions without affecting the price. The red hazy dot I have pointed out shows when a large volume sell order was executed. The big money wanting to go long will stage multiple buy orders or have bots set up to do the same. They will sell a big chunk of the asset to dump the price. As price falls, stop losses are triggered (1), traders see the falling price and lock in gains they had before they wither away further (2), and risky players look to capitalize on leverage the downturn of price and short the market (3). All these retail sell orders fill the big money buy orders in this pocket of liquidity. Then the price returns to being bullish because the underlying technicals were already supporting a bullish price. Other retail buyers out of the market see the hold/strength of support, want in (or back in), and buy. Risky traders in shorts get pressured out of positions as price rises, are liquidated, and forced to buy.
This has happened every single time price has gotten near $30k, but this is also the first time it’s happened when buy pressure has exceeded sell pressure. Regardless I’ve suspected from the beginning that $30k was the floor (as evidenced by my oft reposted “can-kicking chart”) but I think BTC has now started its recovery phase. While I’m not saying we are headed to all-time highs I think we’ll start seeing higher lows more consistently now. There are larger macro concerns if we don’t surpass $60 before the end of the year but that’s for another post.
Not a normal Sunday Synopsis, I know... but we had a not normal end to the week. Tomorrow’s Micro Monday will pick up the slack that was created by the absence of smaller timeframes here. If you aren’t on the paid side you’ll be missing that post.
I’m super curious to see how the week plays out. It’s really nice to get some excitement on the charts. Have a good one!
@theprivacysmurf
This is 'off the charts' the best explanation!! Thanks for all your help!! Love your analysis. Any way to get a hold of your custom (MA & WAD) indicator???? :-)