

Sunday Synopsis #10
Sunday Synopsis #10
But green's the color of spring And green can be cool and friendlylike And green can be big like an ocean Or important like a mountain Or tall like a tree


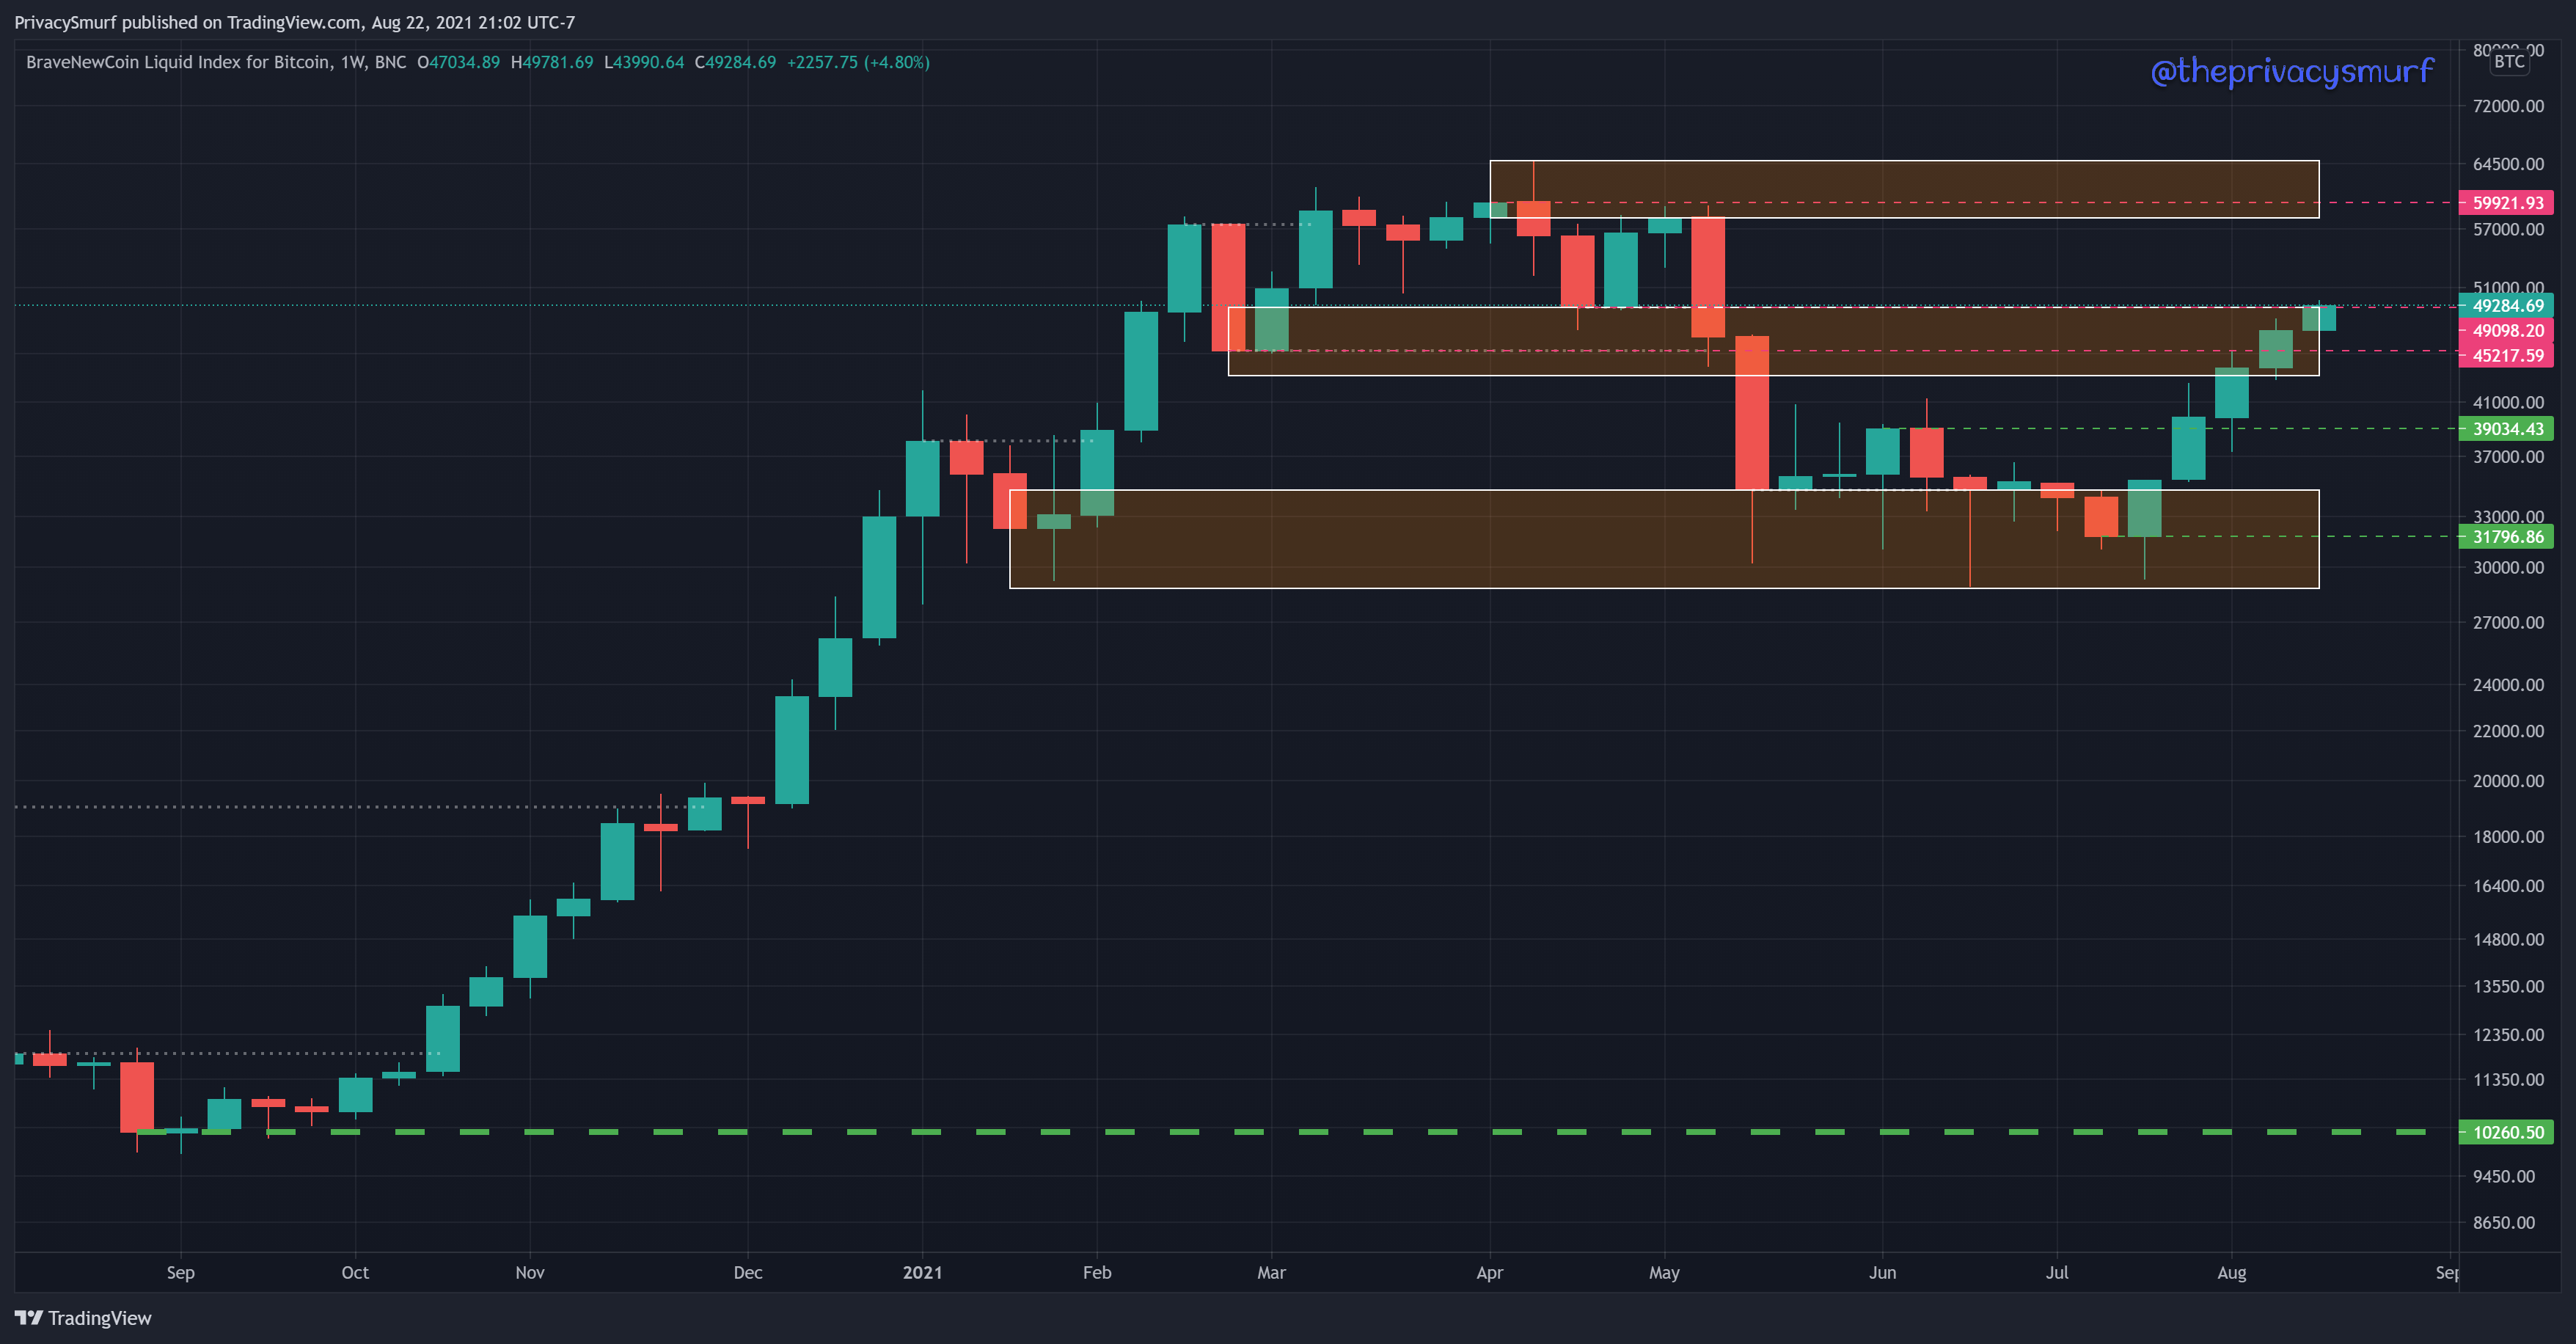
It’s been a sea of green. Last week’s projection of a dip and rally to 50k for BTC played out nicely. While we are looking great across the market there are still reasons to be cautious in positions. It’s not all completely clear skies ahead. Don’t forget to make and have a plan for your positions and don’t forget to take profits on short-term positions on the way up.
We have before us another green weekly candle on BTC and a close above the dreaded low close pivot resistance at $49098. Holding above that is the goal. Another week over and a test of that as support would be a strong look for BTC and the continued bullish wave. Take note of the earlier bullish trend. There was a sustained 7 week period of green candles, over a 70% gain. Similar price activity would put BTC around $56k. That’s not really something that I anticipate specifically but it’s an interesting comparison and could potentially speak to the strength of this bullish wave comparatively. If $49k ends up holding as resistance the next weekly lower market structure support is around $45.2k.
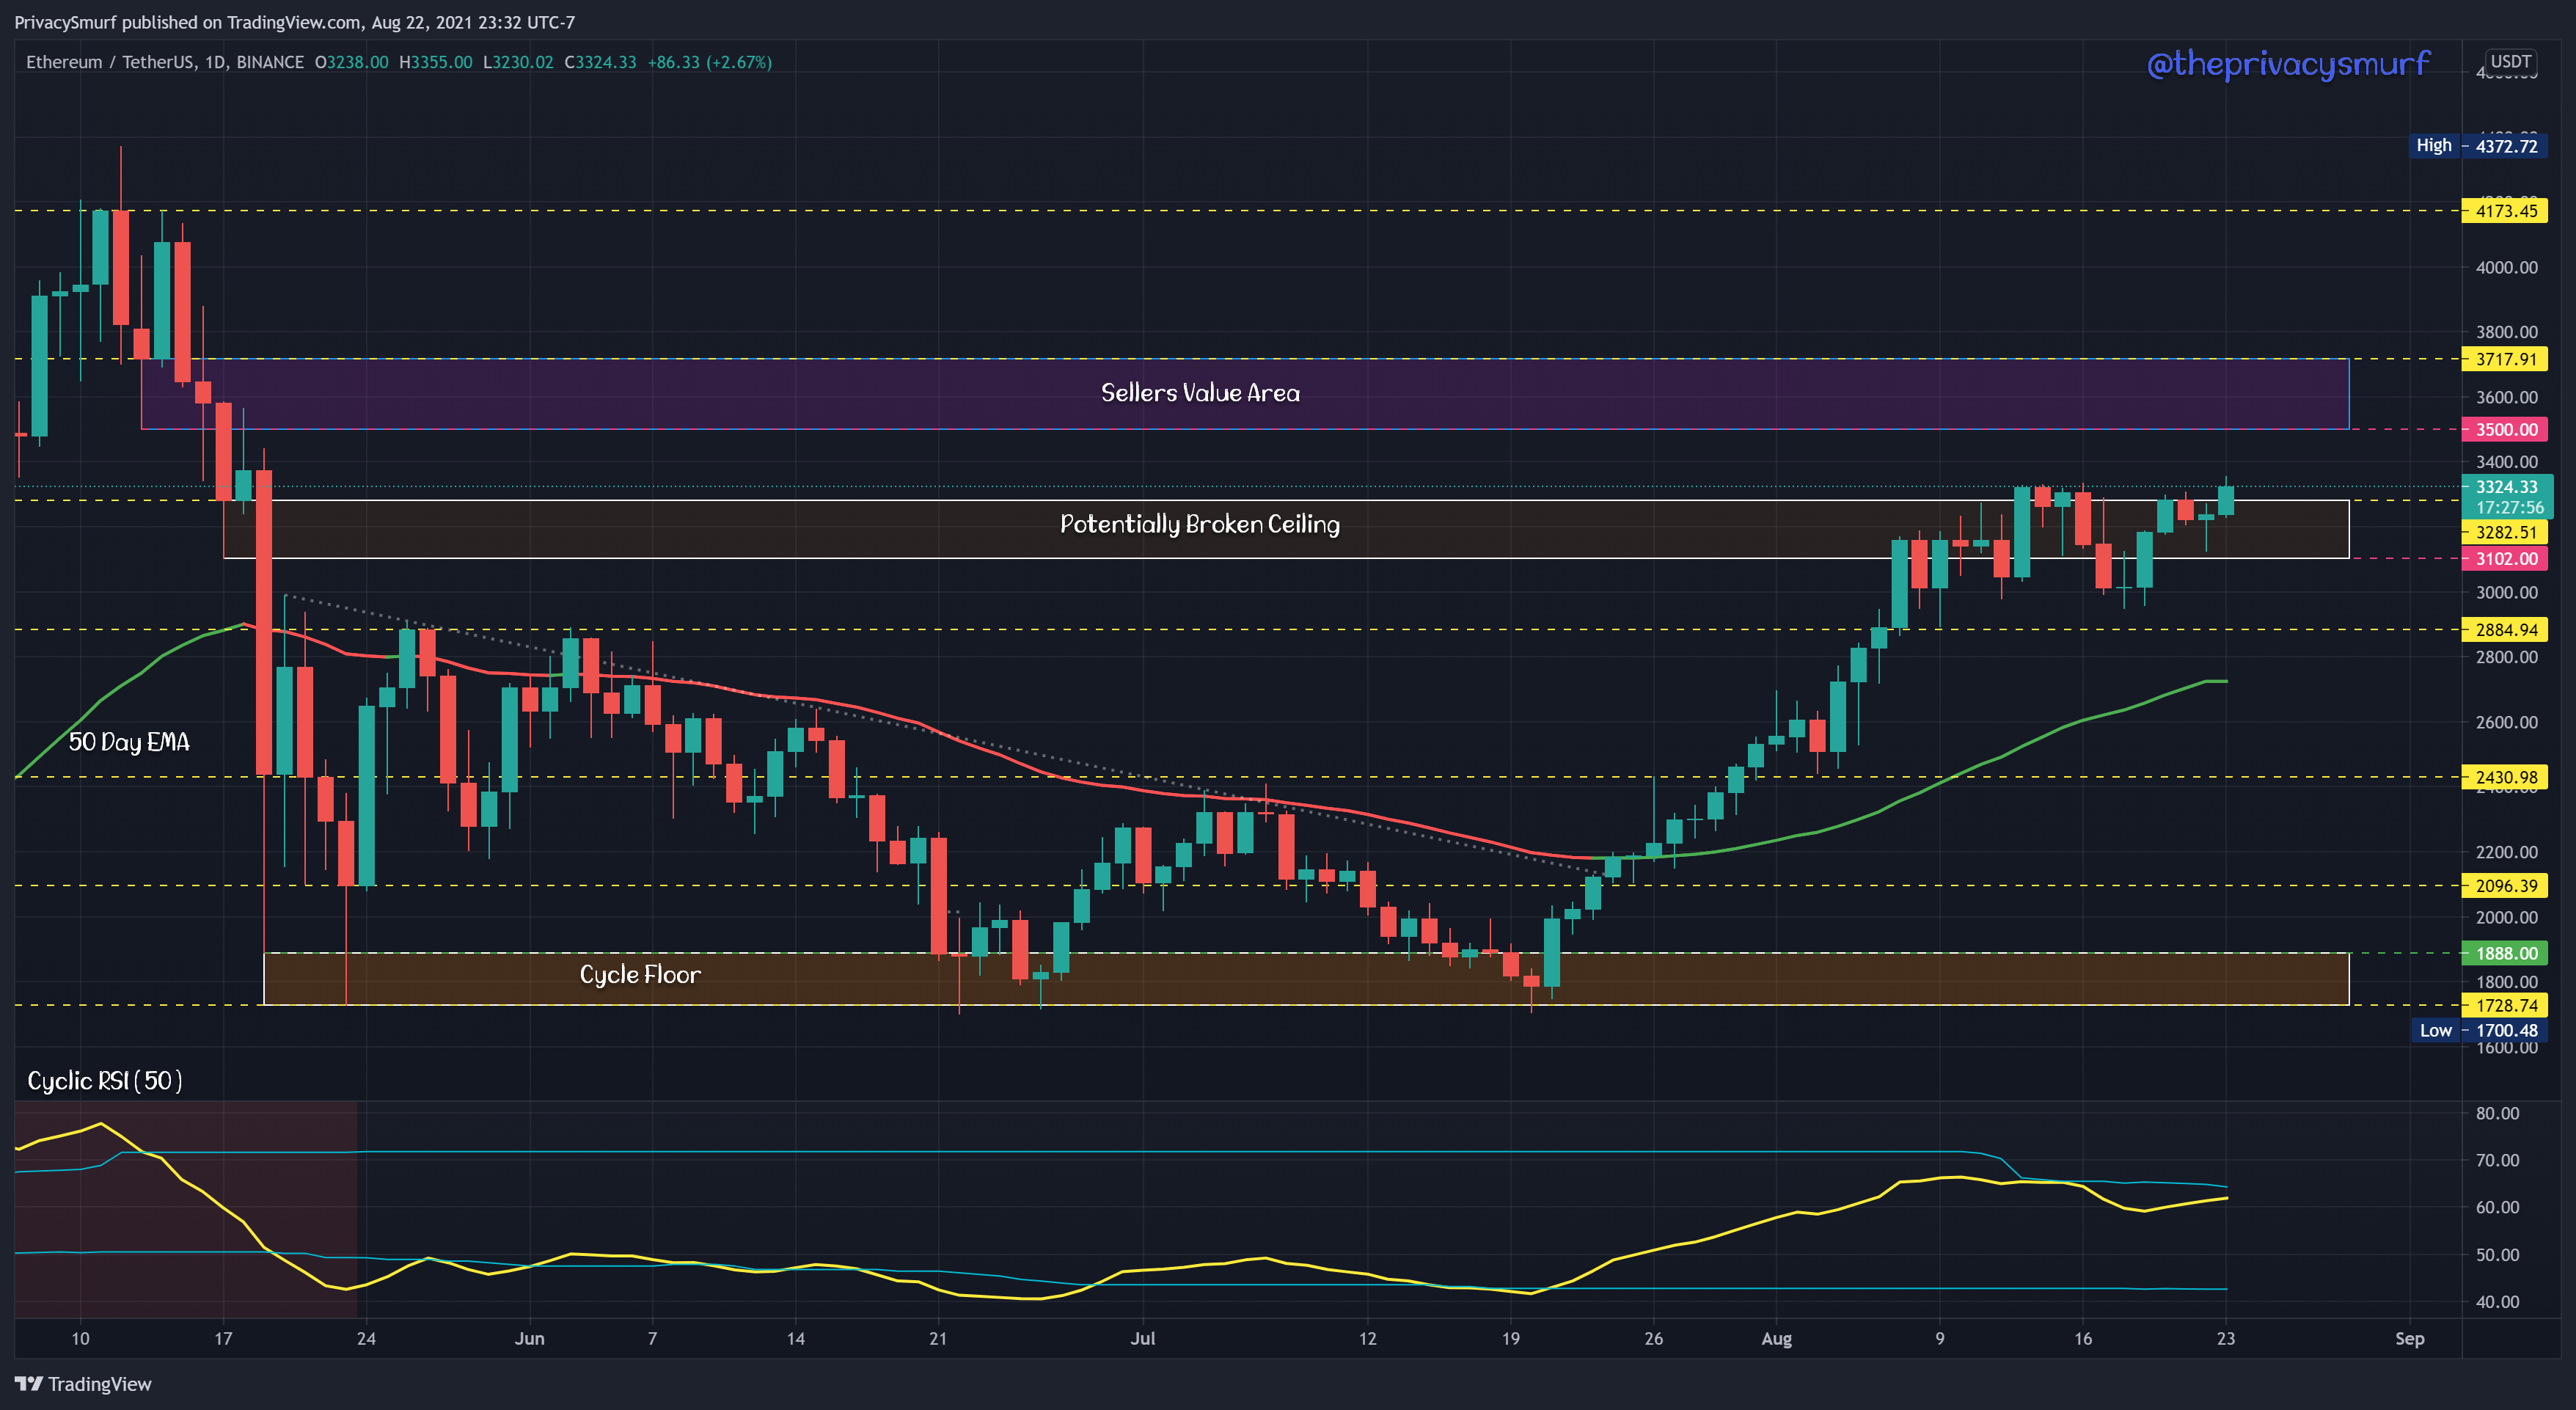
I’ve added plenty to the daily chart. We are going to work from the middle out.
The zone around $44k which was the top of the rangebound period is what I would consider the new value area or floor for mid-term buyers. A correction downwards I would expect to be bought up from there. I don’t think prices in the near to mid-term will get below $42k.
Next, we will look at the “potentially broken ceiling” zone. For that to be validated and removed I’d want to see a few more daily candles closing above it and a retracement back to it for support. A bullish candle pattern that appears in the region from $46.8 - $49k would be an ideal setup to the long side for me if it’s backed up with aligned momentum.
There’s a new “seller’s value area” up around $56k. This will likely be a region mid-term positions bought up around current prices will be sold off for some profits as the areas above will likely be stiff resistance near the All-Time High.
Bearish divergence is still present annotated with the green and red arrows. Prices have continued to increase while the RSI has decreased. A correction will more than likely occur unless volume can increase and bring the RSI to a new high over the prior cyclical peak.
There are a few added resistances, $51293 and $53200. Either one of these could likely be the location where the bearish divergence begins its retracement from.

Overall BTC is pretty bullish so countertrend signals get a bit less reliable because irrationality becomes more prevalent in the market. This doesn’t mean that bearish signals shouldn’t be heeded. It means mostly that positions can swiftly improve for the better and lure you in and also swiftly turn against you with seemingly no warning. Caution is always urged in conditions like this when the market has experienced an extended period of strong bullishness with waning momentum. For short-term positions in these conditions, caution to me means strict reliance on immediate profit-taking and taking less risky positions (no trades with large stop losses).
Resistances are plaguing ETH at the moment. This past week we see a rejection but a hammer candle. That is a potentially good sign for the upcoming week. I’d expect another test of $3350 in the next week. Failure will have support at $2711 and a breakthrough will have resistance at $3923.

Nothing has changed yet for the daily ETH chart. The price has made another break of the current ceiling but there’s a VERY slight bearish divergence. There’s just not tons looking great about ETH technically yet on this chart. It may make a break up to $3500 and that could be the setup for the bearish divergence to trigger. At that point, I’d be watching for the retracement and test of the “potentially broken ceiling” zone for an entry to the long side.
If ETH retraces earlier than a price bump up to $3500 the price tag of $3000 appears to be a solid price for buyers to scoop up more. I wouldn’t expect prices below $2700-$2800.
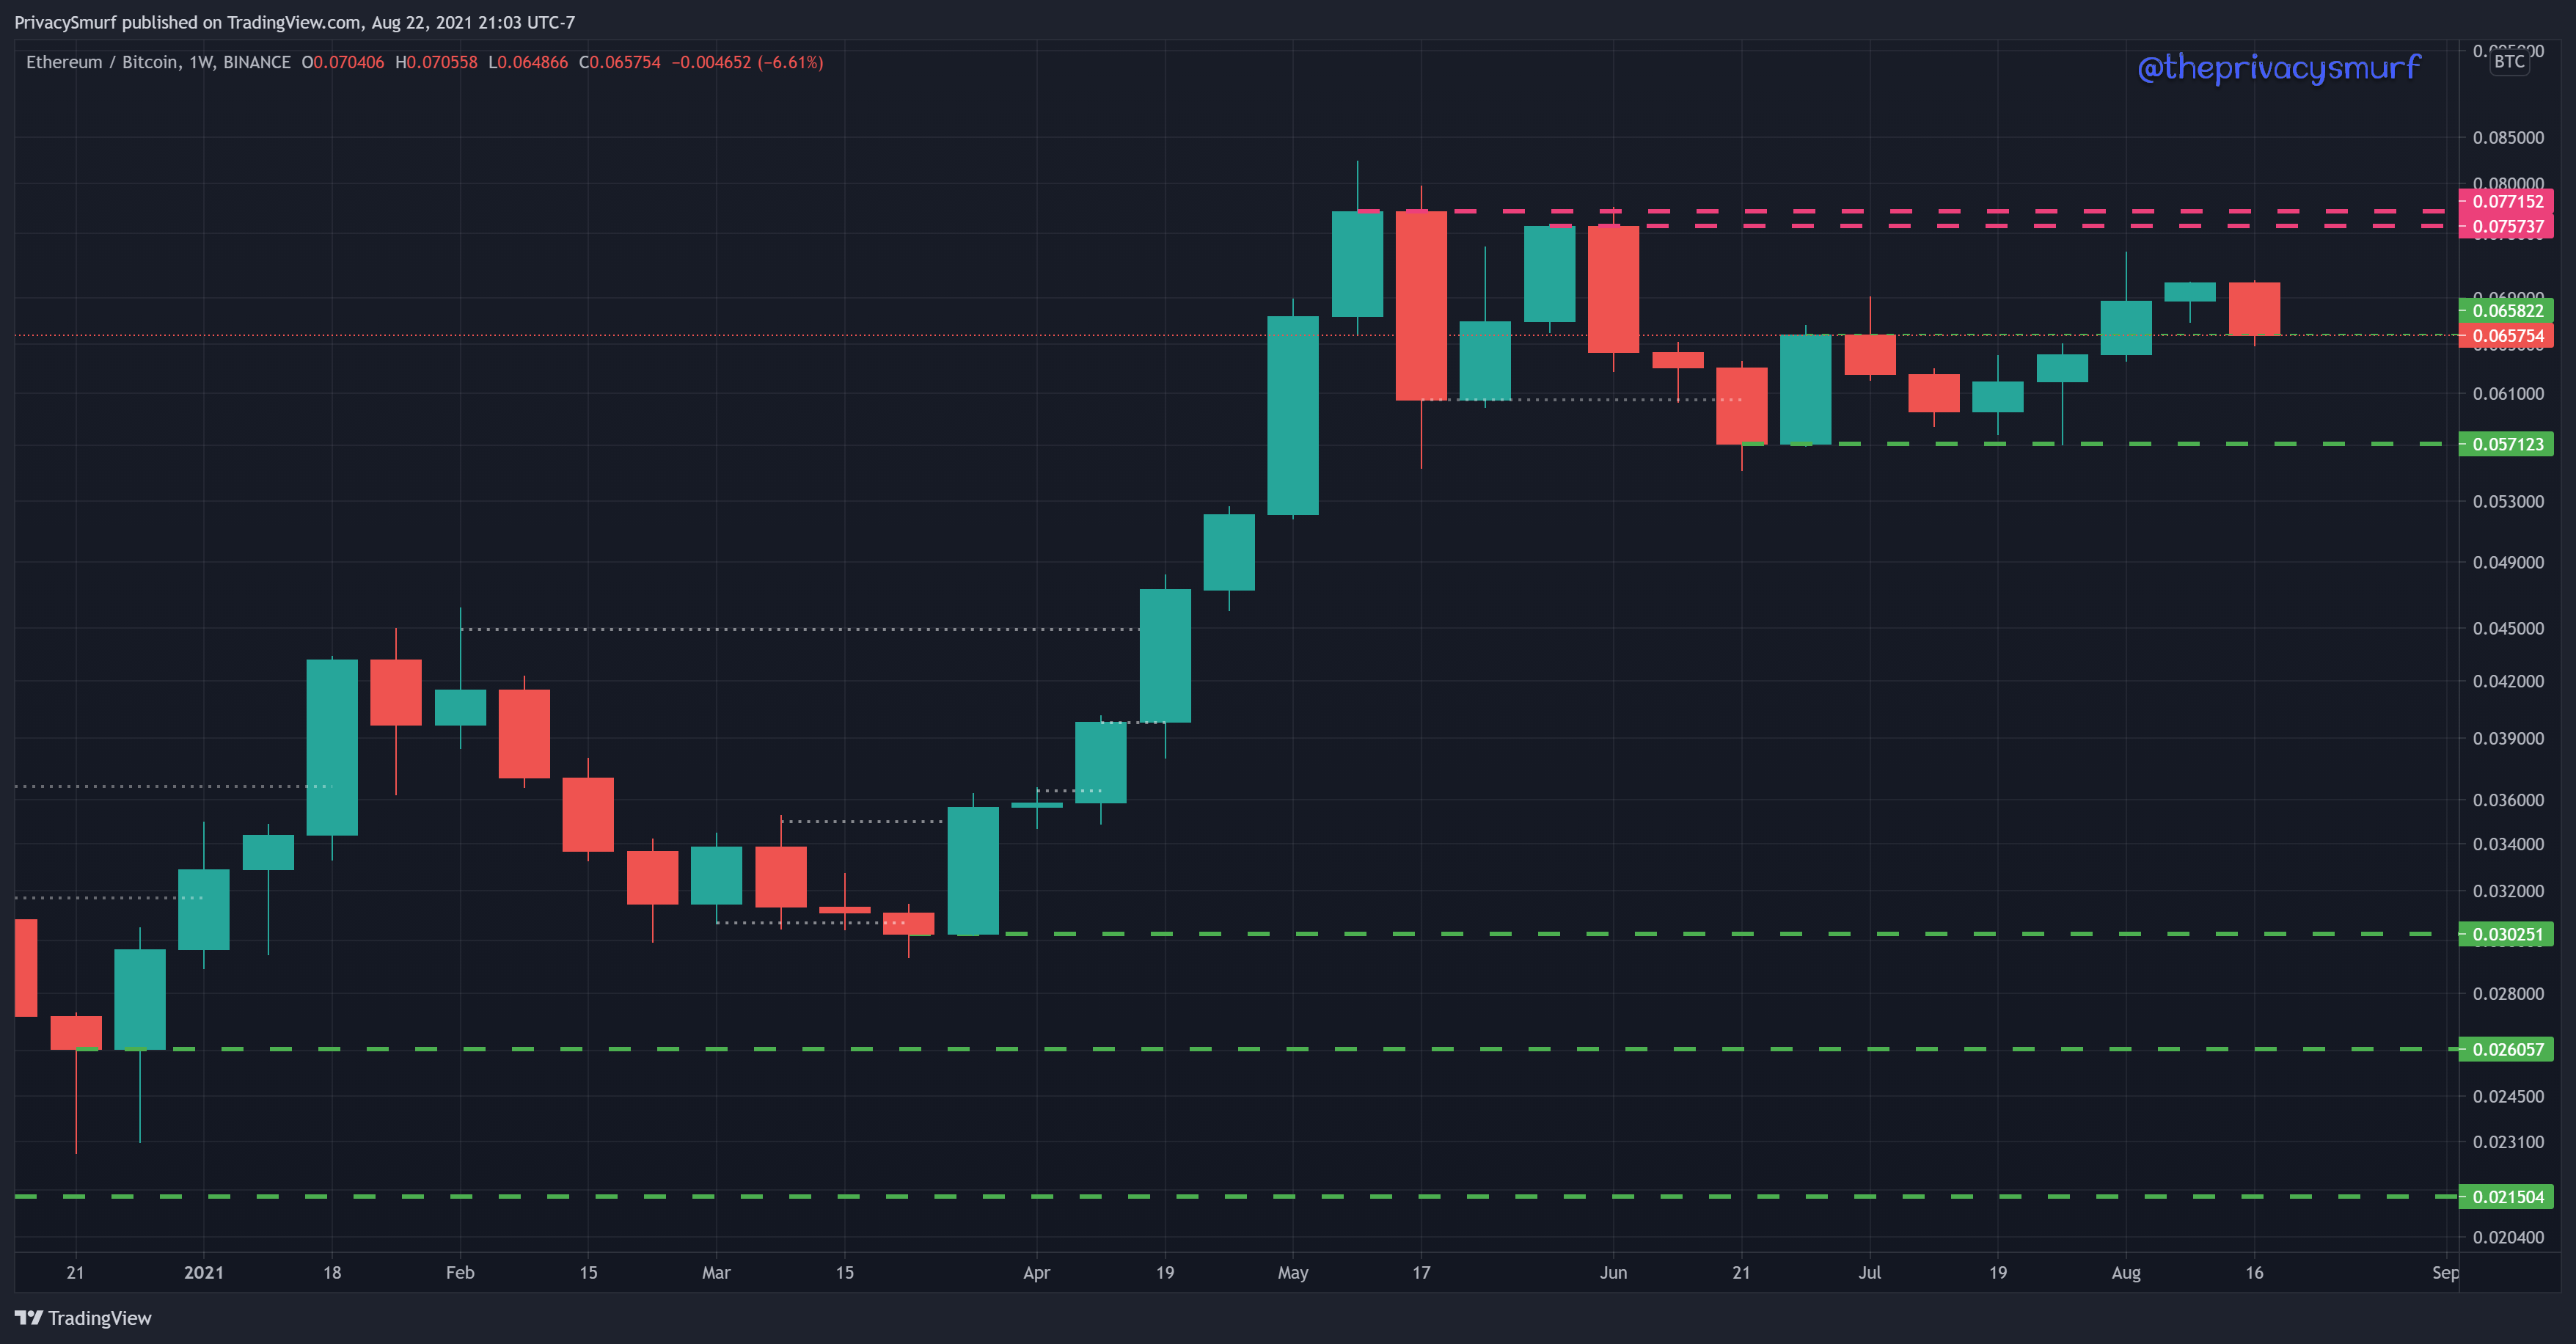
Now we have a less than exciting weekly ETH/BTC chart. There’s currently a test of the 0.0657454 support. Failure here and ETH will decline in value relative to BTC. It’s still BTC’s moment to shine.
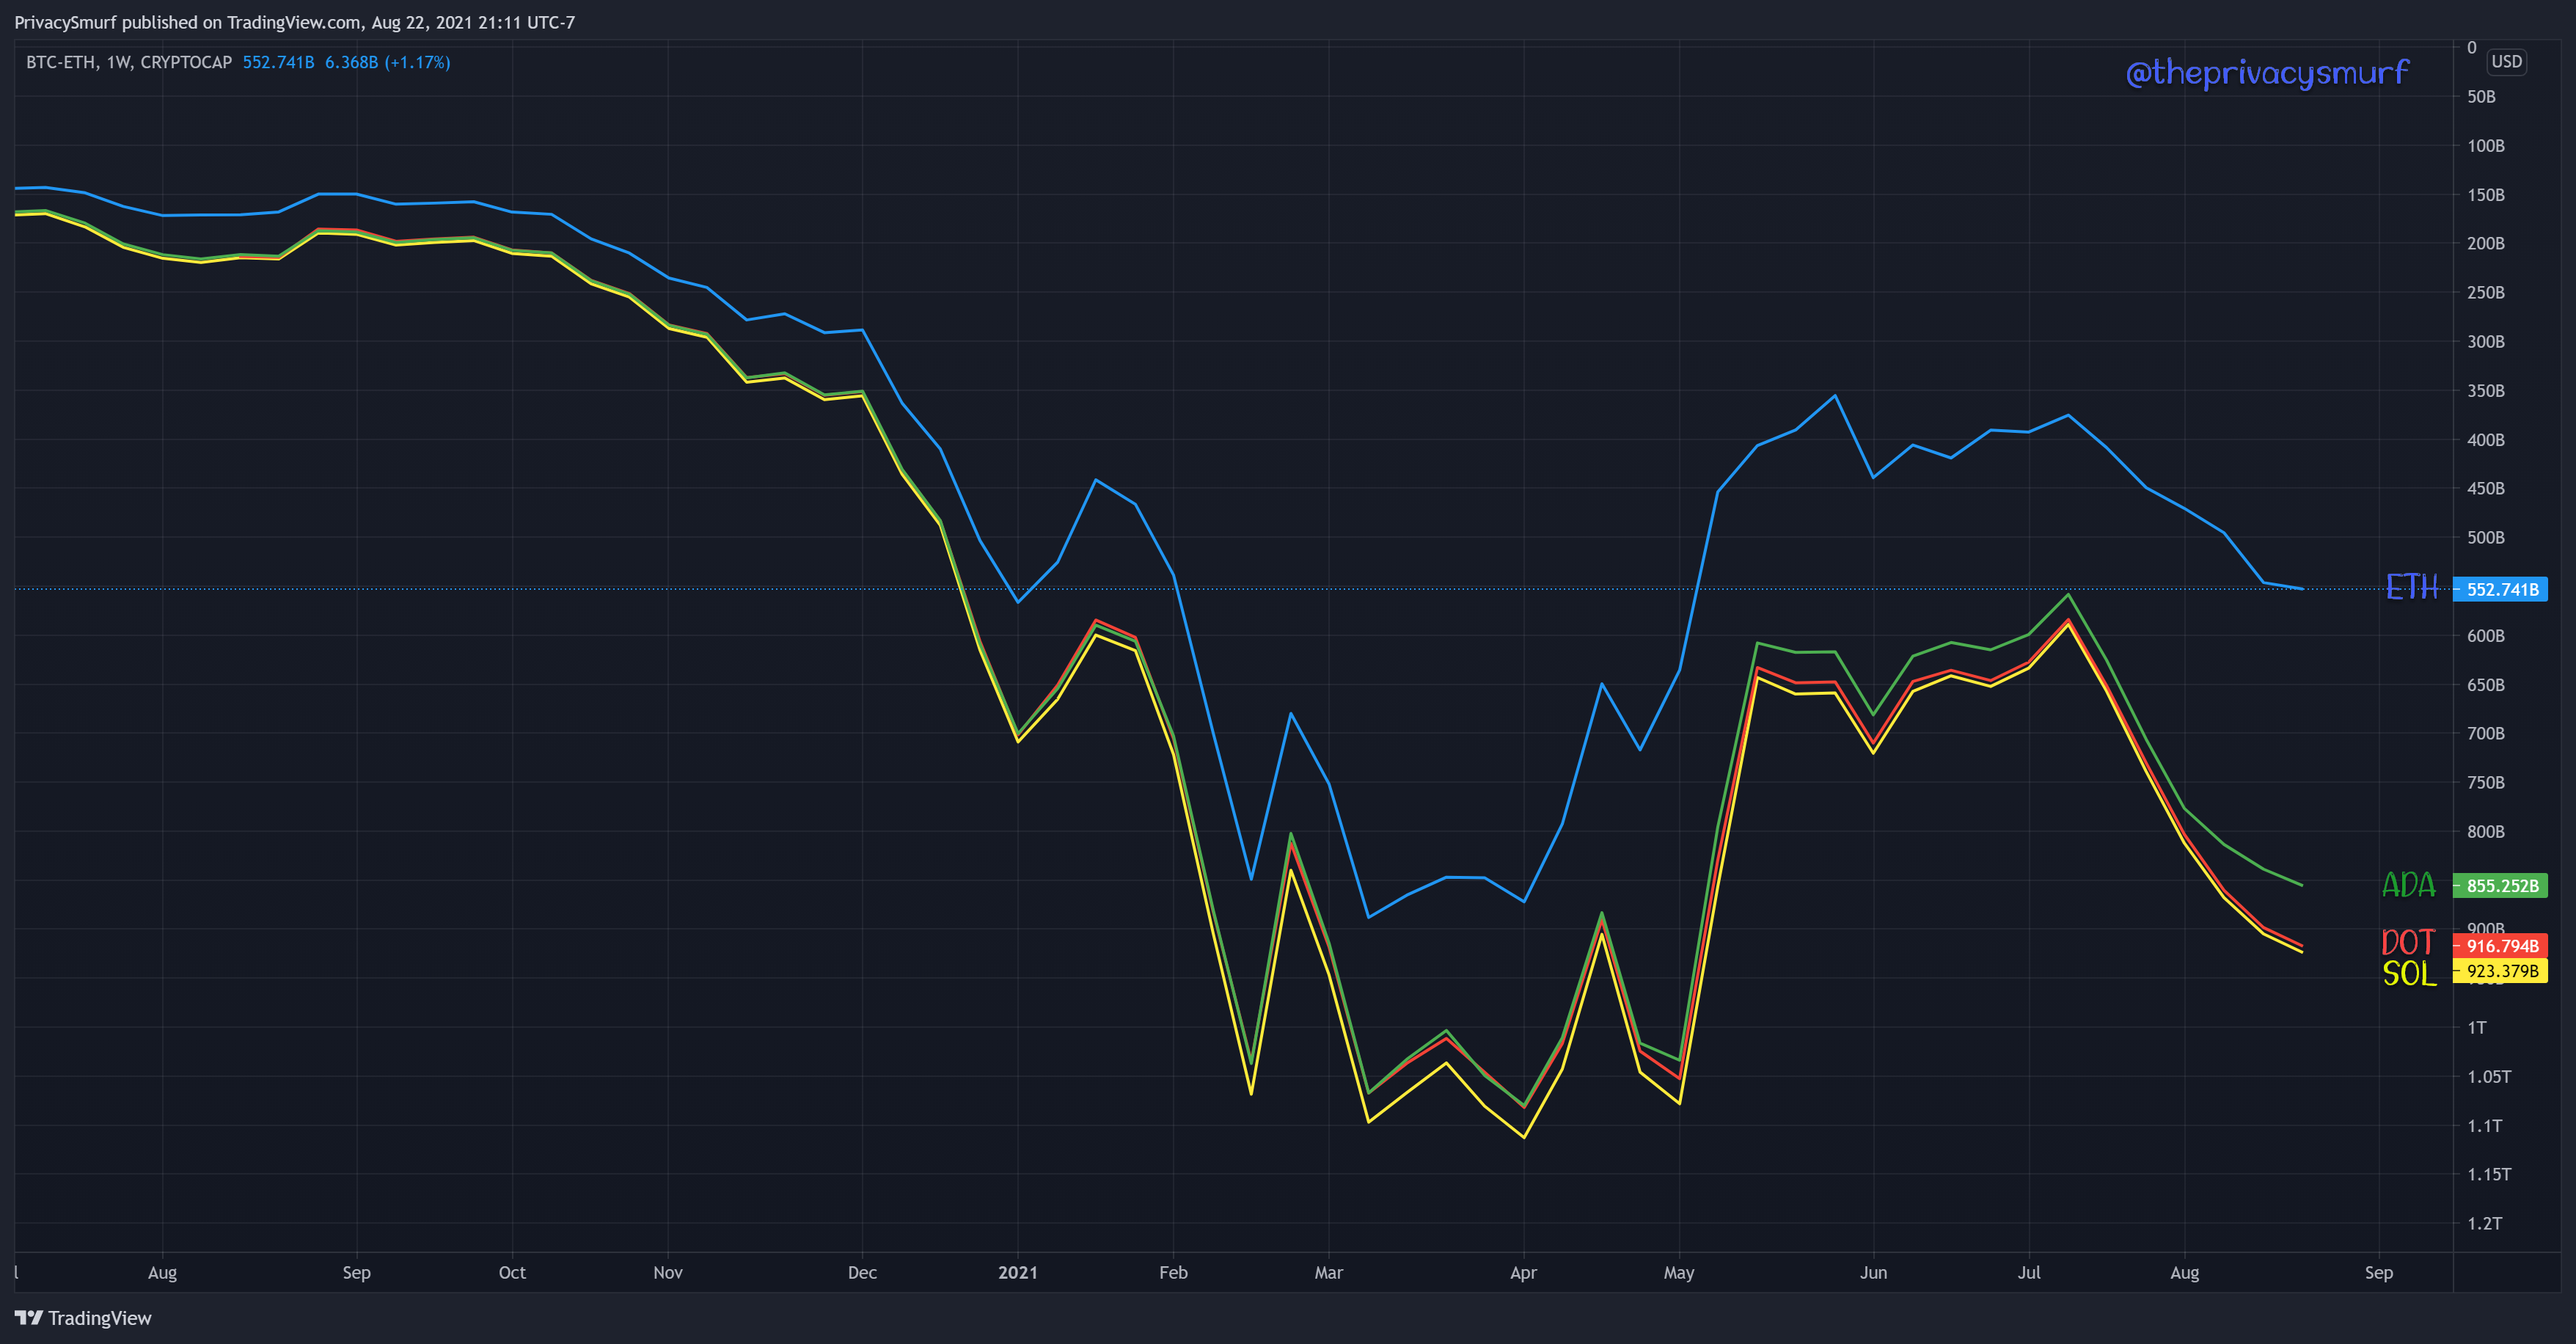
Last week I talked about the market cap spread as an alternative to the ETH/BTC chart. With the recent news of ADA unseating BNB as #3 in total market cap and SOL’s massive +200% run in the last month, I thought it would be neat to show the ETH competitors and their spreads relative to BTC. Here we have ETH in blue, ADA in green, DOT in red, and SOL in yellow. This chart shows that regardless of all the news and hype ETH still is the dominant smart contract protocol and no alternative is making a significant case for overtaking ETH in market share in terms of taking from BTC. ETH is also slightly performing better on downtrends in the spread (technically uptrends (?) because the spread is increasing but we don’t need to get ticky-tacky and that’s just confusing, sorry I even added that to the mix, haha).
What is your fave smart contract platform? What do you think will be the big dog? Do you even care? Leave a comment with your thoughts!
See everyone tomorrow in the Micro Monday post. We may have some good trade setups coming up.
@theprivacysmurf
Loving this subscription man. Always an insightful read. I am more ADA dominant as a holder, but I do carry a bag of ETH as well. I think in the long run both will be around for a good while and that there is room in the space for both to be successful.
I think it is likely to be ADA. ADA may not be a long term winner but, I'll predict that it will be the first to overtake ETH.