

Sunday Synopsis #28: When the Sun Goes Down
Sunday Synopsis #28: When the Sun Goes Down
Press On

I really love this jam. It pumps me up. I know everyone has their tastes but if you can’t get into it I dunno if we can be friends outside of this newsletter. We’ll see…
:-p
Quite a weekend. I’m sure to the uninformed or misinformed (not you fine folks) it looks like the ‘Sun is Going Down’ on the crypto market. What can you do in moments like this? If you are a long-term investor, honestly, nothing. Unless you are a mega whale your buys aren’t gonna hold up the market. Just dust off your diamond hands and ‘Press On’ because there will be brighter days ahead and stuff is getting really cheap. If you are a trader and you haven’t been looking for short sells you are doing it wrong.
BTC/USDT Weekly Structure
https://www.tradingview.com/chart/4v8qizyI/

Sometimes you just have to throw the baby out with the bathwater. The market structure trend here has pretty much skipped the bullish consolidation phase and is straight to bearish. For a strict technical definition, there still needs to be an up week followed by a new lower low close below $36244. A weekly close below $31.7 would be the lowest low close of the year. I anticipate that price level to hold some as support and offers a prime value location for long-term buyers. The daily chart may give some idea if we are heading in that direction this week.
BTC/USDT Daily Chart
https://www.tradingview.com/chart/jjSdFW4b/
First I’ll zoom out a bit so we can see the last time we got to these price levels and why these horizontal lines exist on my chart. It’s a bit impressive and surprising that $38k offered no support at all on the daily chart but the $34k level stopped the bleeding for the time being. I’m EXTREMELY hesitant to create a new range floor zone at the $34k price level even though prices have stopped falling here.
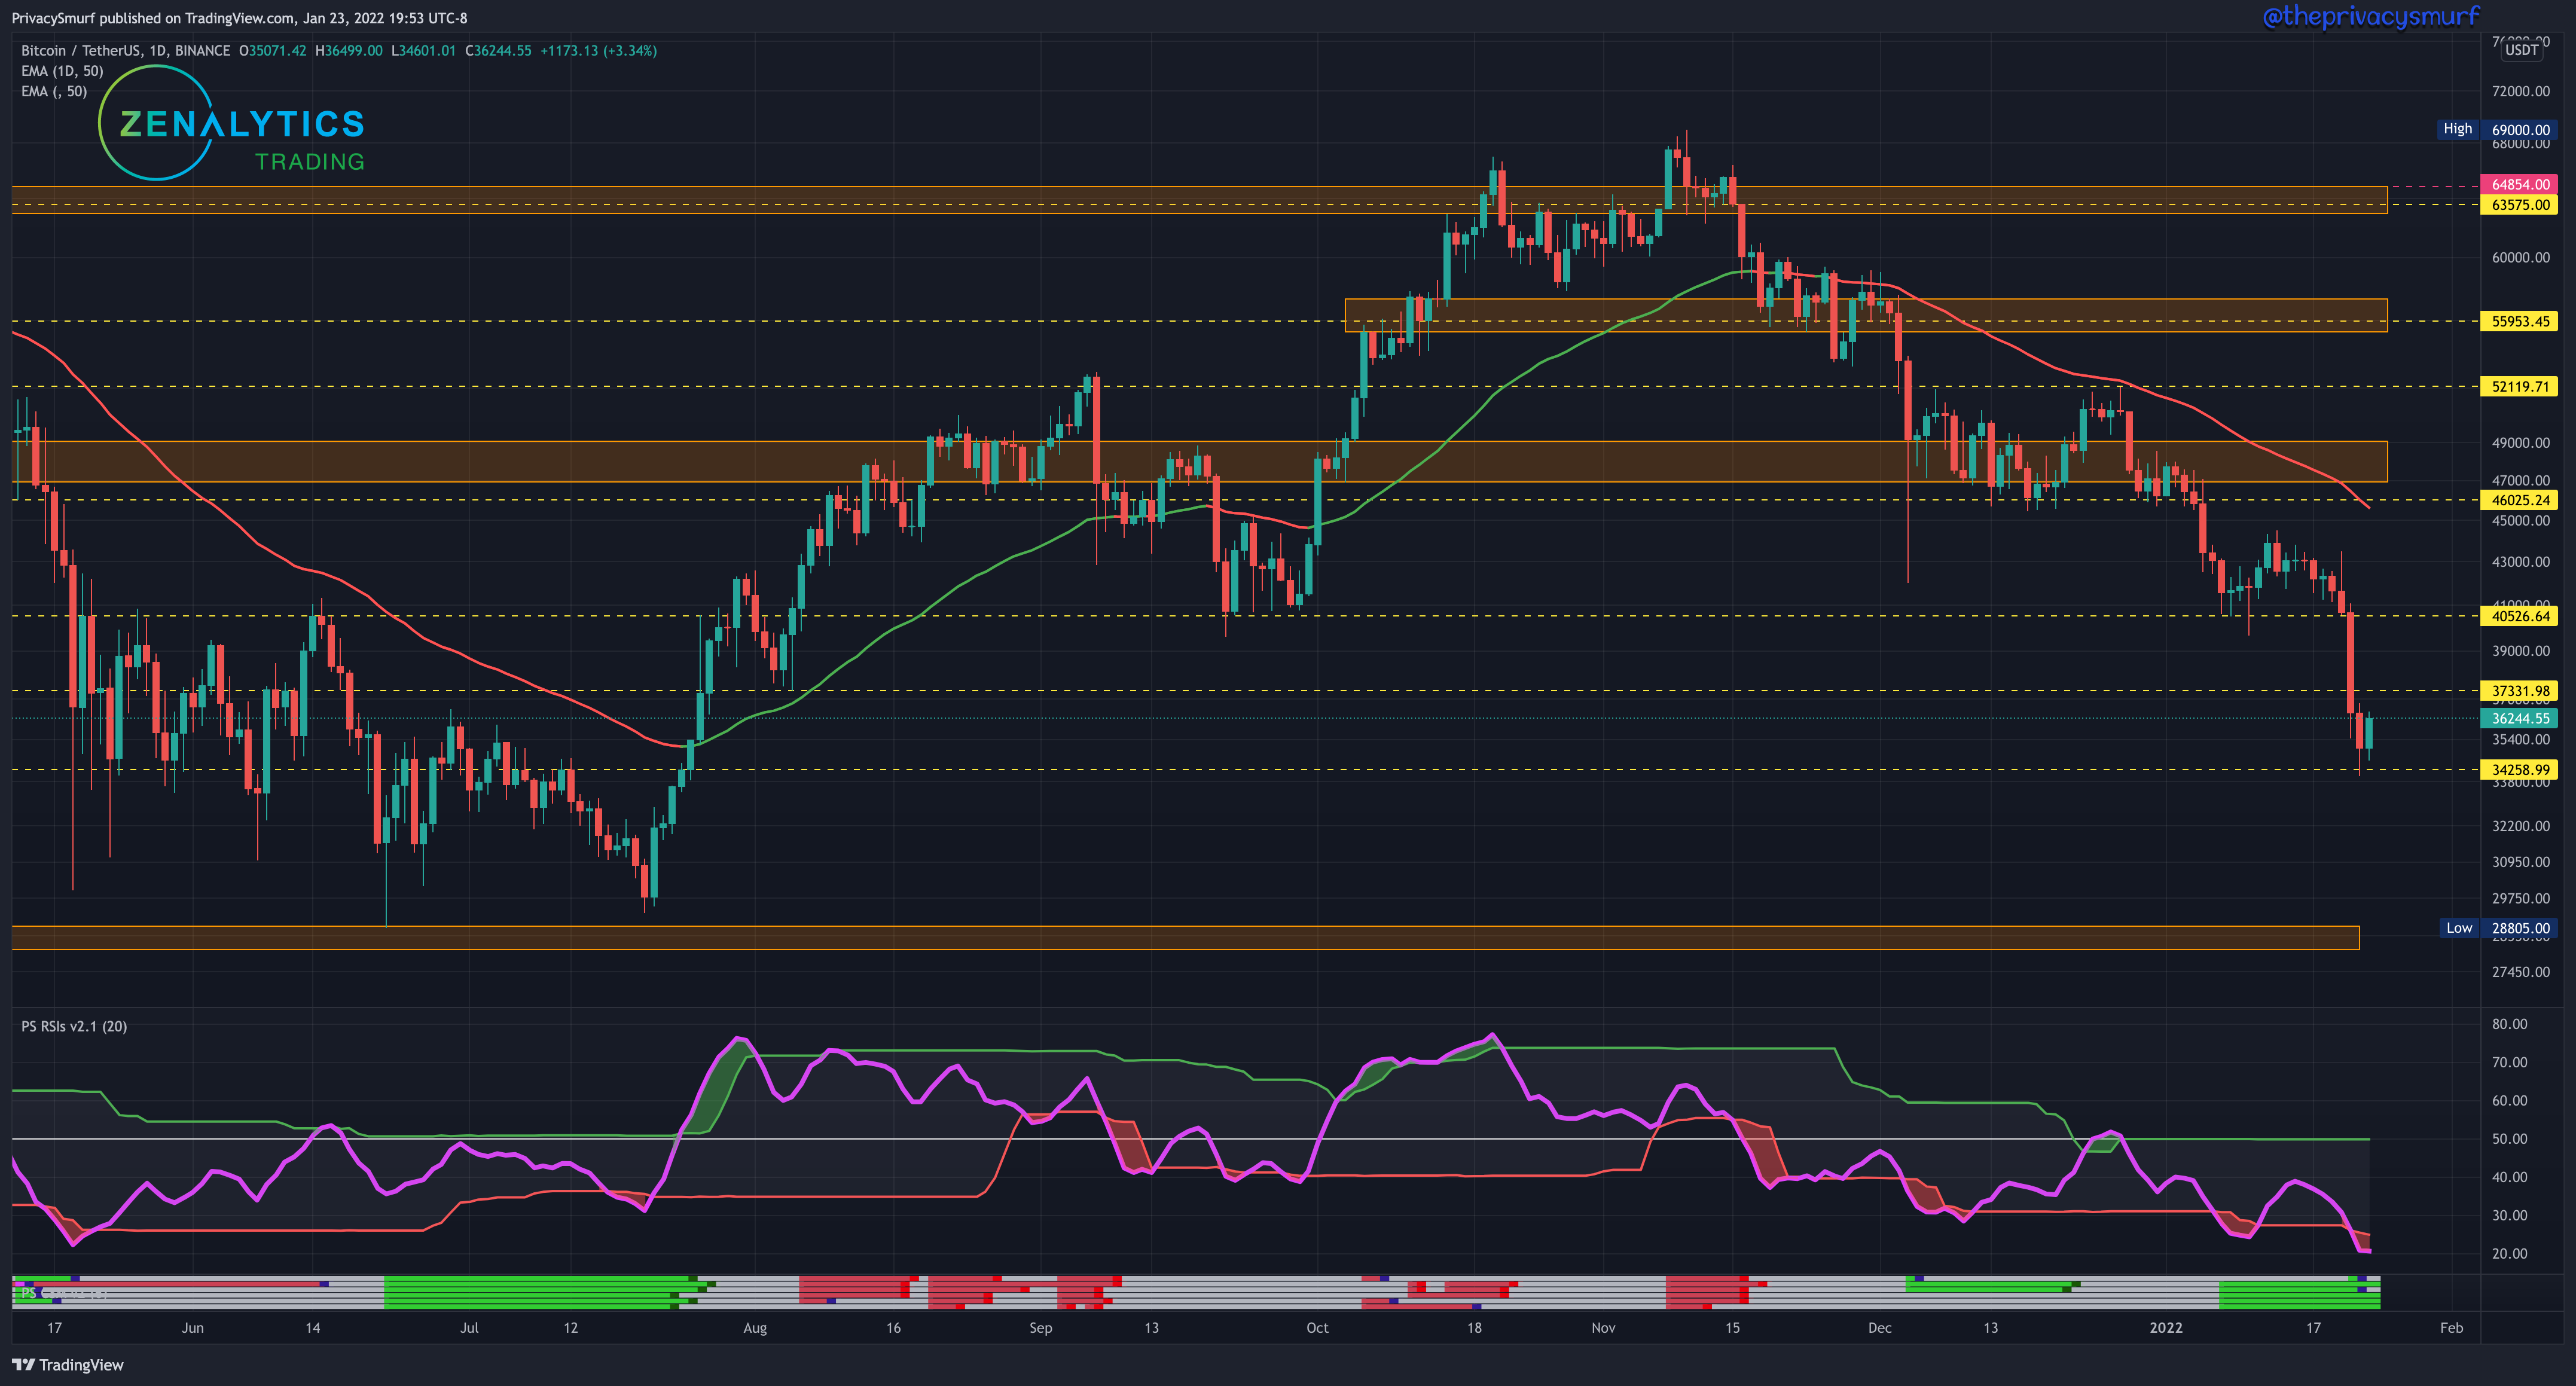
Getting a closer look at the recent price action two oscillators that were in bullish divergence (green lines at the bottom of the chart) have been invalidated (blue dots at the end of the line) suggesting bearish price continuation. If prices stagnate here and go down to test this year’s range floor at $29k it’s likely all the bullish divergences will be invalidated. The bounce here on the up candle also didn’t have enough buyers to plot a bullish engulfing candle. That is not a strong response. I’m likely going to remove the $38k resistance level as it may not be relevant anymore. We’ll see how the price action moves around it this week. This is an important concept to understand and when I draw my supports/resistances on a new chart I always anchor from the current time and work backward (click here for my youtube video on this concept).
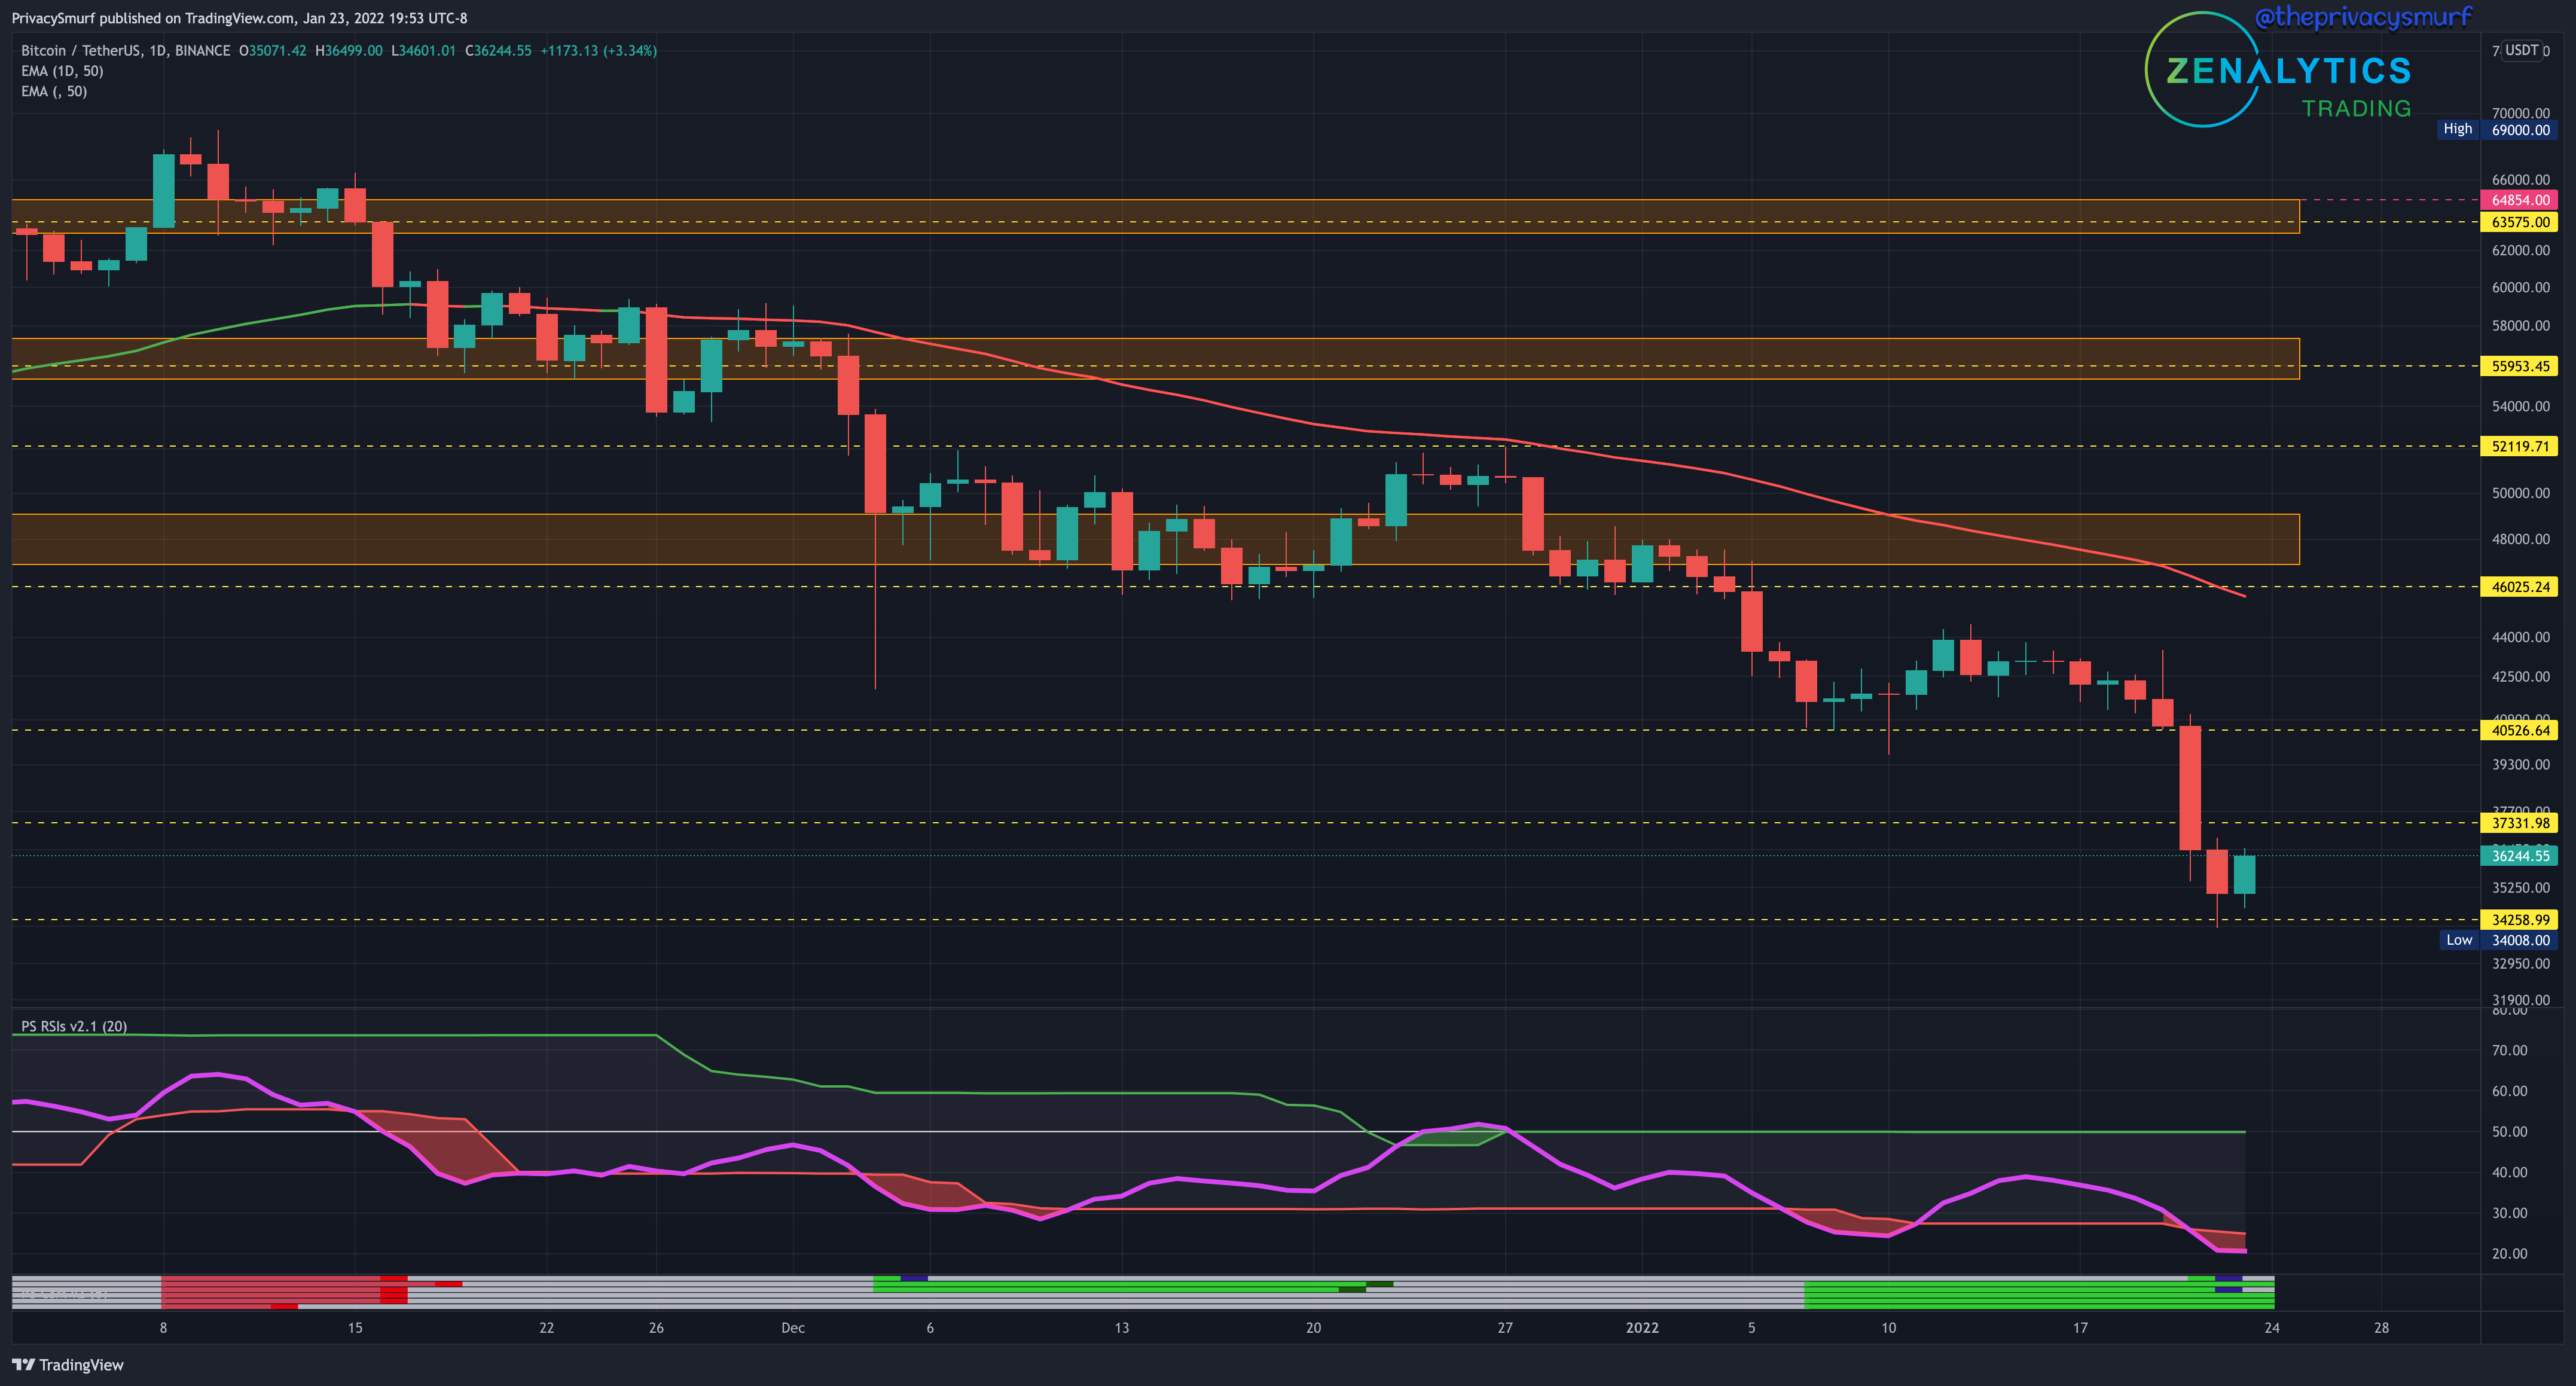
With the RSI trending in line with the price and now being oversold now we may have a week of establishing a new range with some more wicks below $34k and bullish action around $38k. I’d put a high ceiling at $40.4k. The trend is still bearish. The first rally that shows up here is not the sign of a reversal.
ETH/BTC Weekly Structure
https://www.tradingview.com/chart/sacHlXOv/
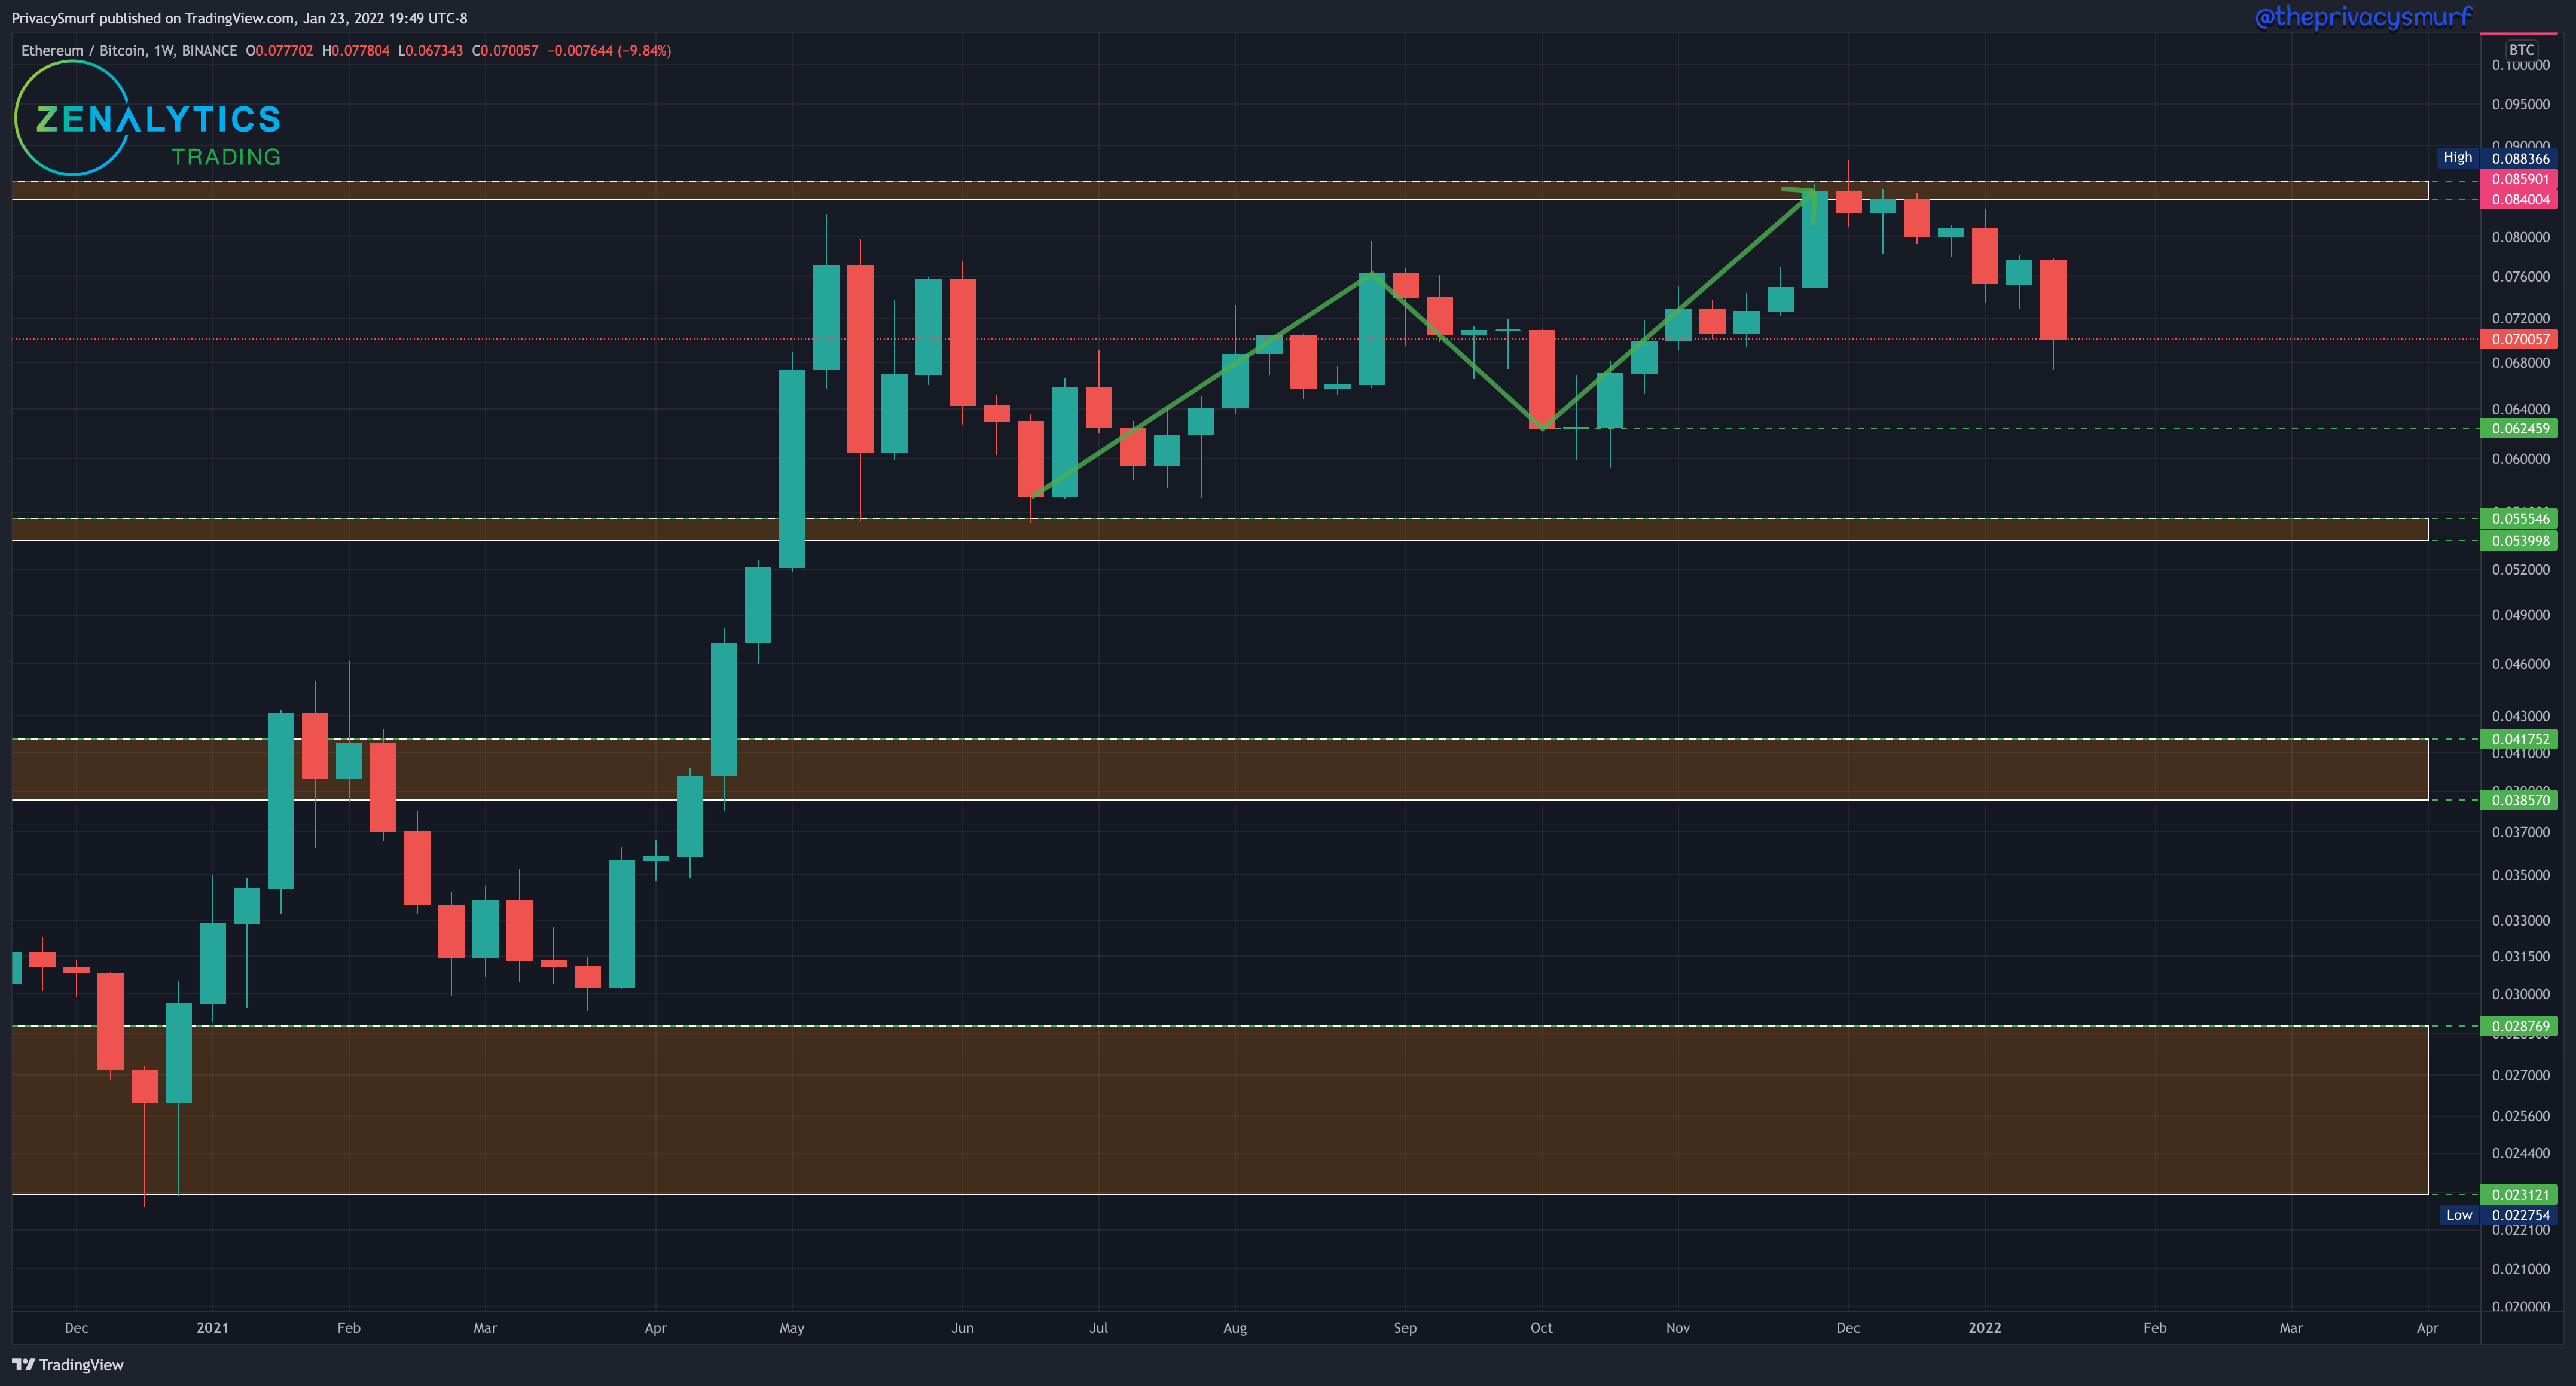
The weekly chart of ETH/BTC is still technically bullish however it’s also encroaching on skipping the bullish consolidation phase as well as it just keeps setting continual lower low closes. Since ETH/BTC is matching the BTC/USD chart we know that ETH/USD is also going down so there’s no rotational play to be made here by moving your ETH to BTC or BTC to ETH. Both are going down together. Still the waiting game here. A close below 0.0624 will establish a new lower low close and a technical market structure bearish trend but I’d also accept a rally from here and a lower close below 0.07 as a bearish trend.
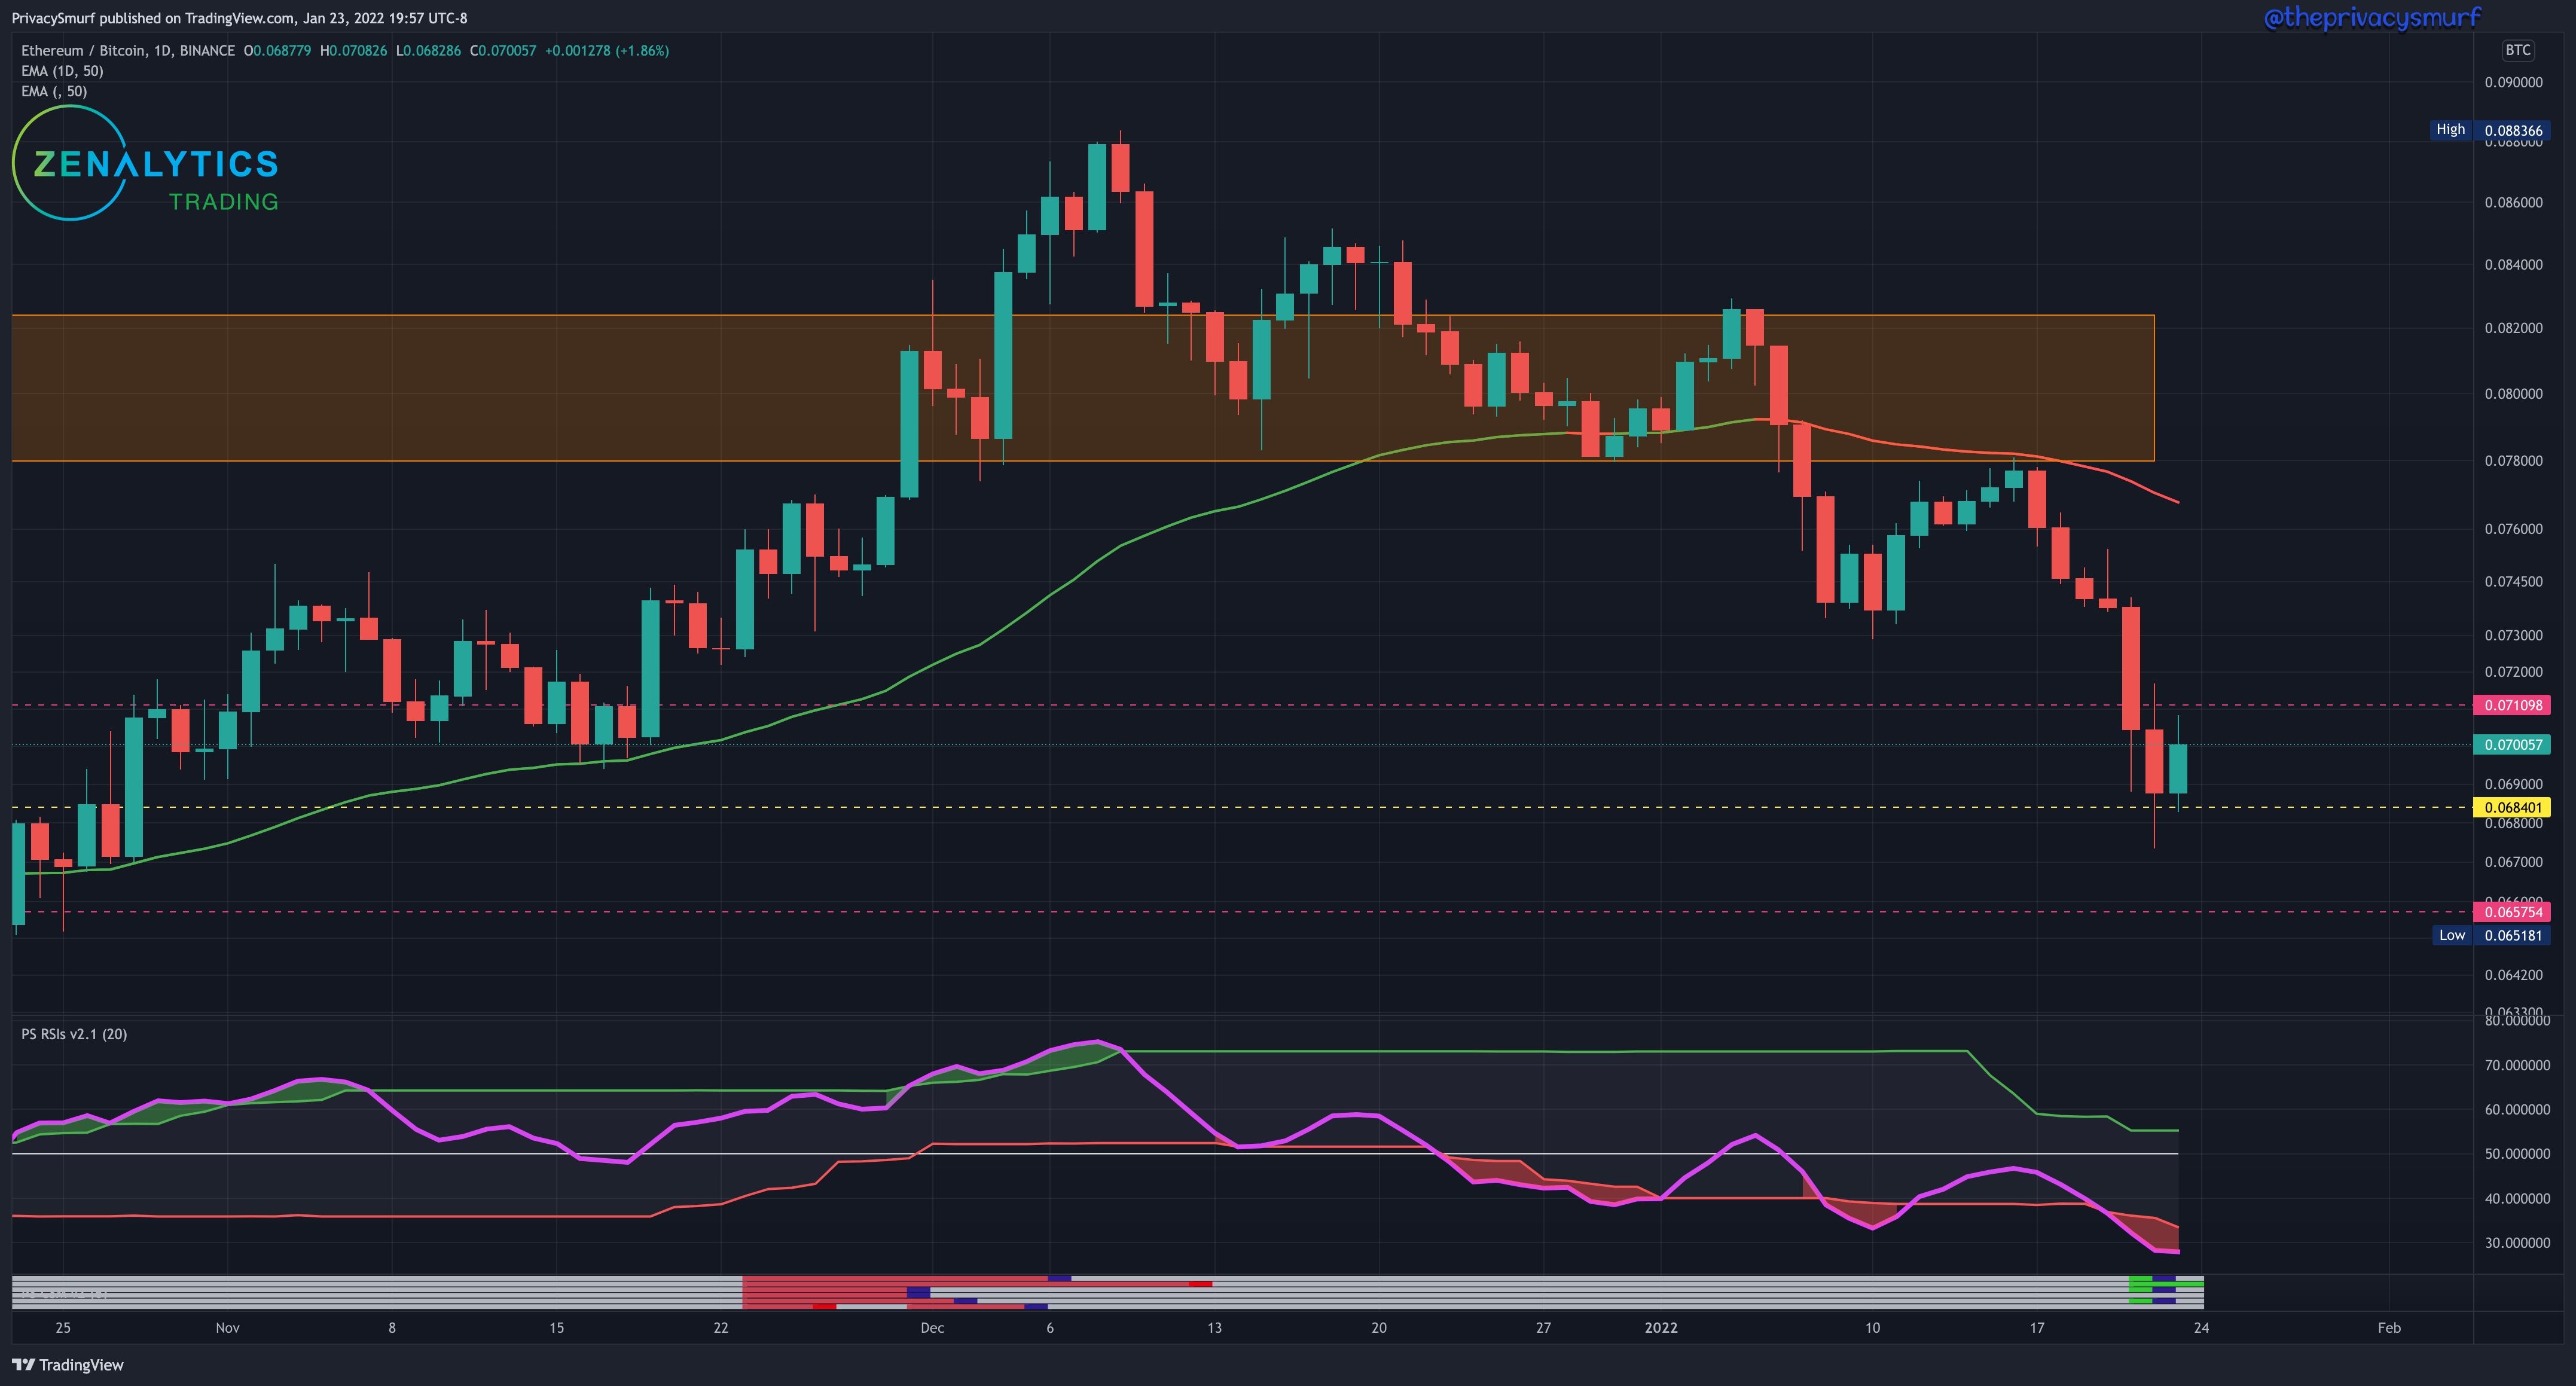
ETH/BTC Daily Chart
https://www.tradingview.com/chart/gTkSjkj6/
I’ve zoomed out a bit here to give a wider view of the next range down we may be visiting. The 0.061 level is the higher value of the range floor and dipping below that is an advantageous position for long-term buyers to rotate some BTC into ETH for a greater return in value if a bullish candle formation appears there.
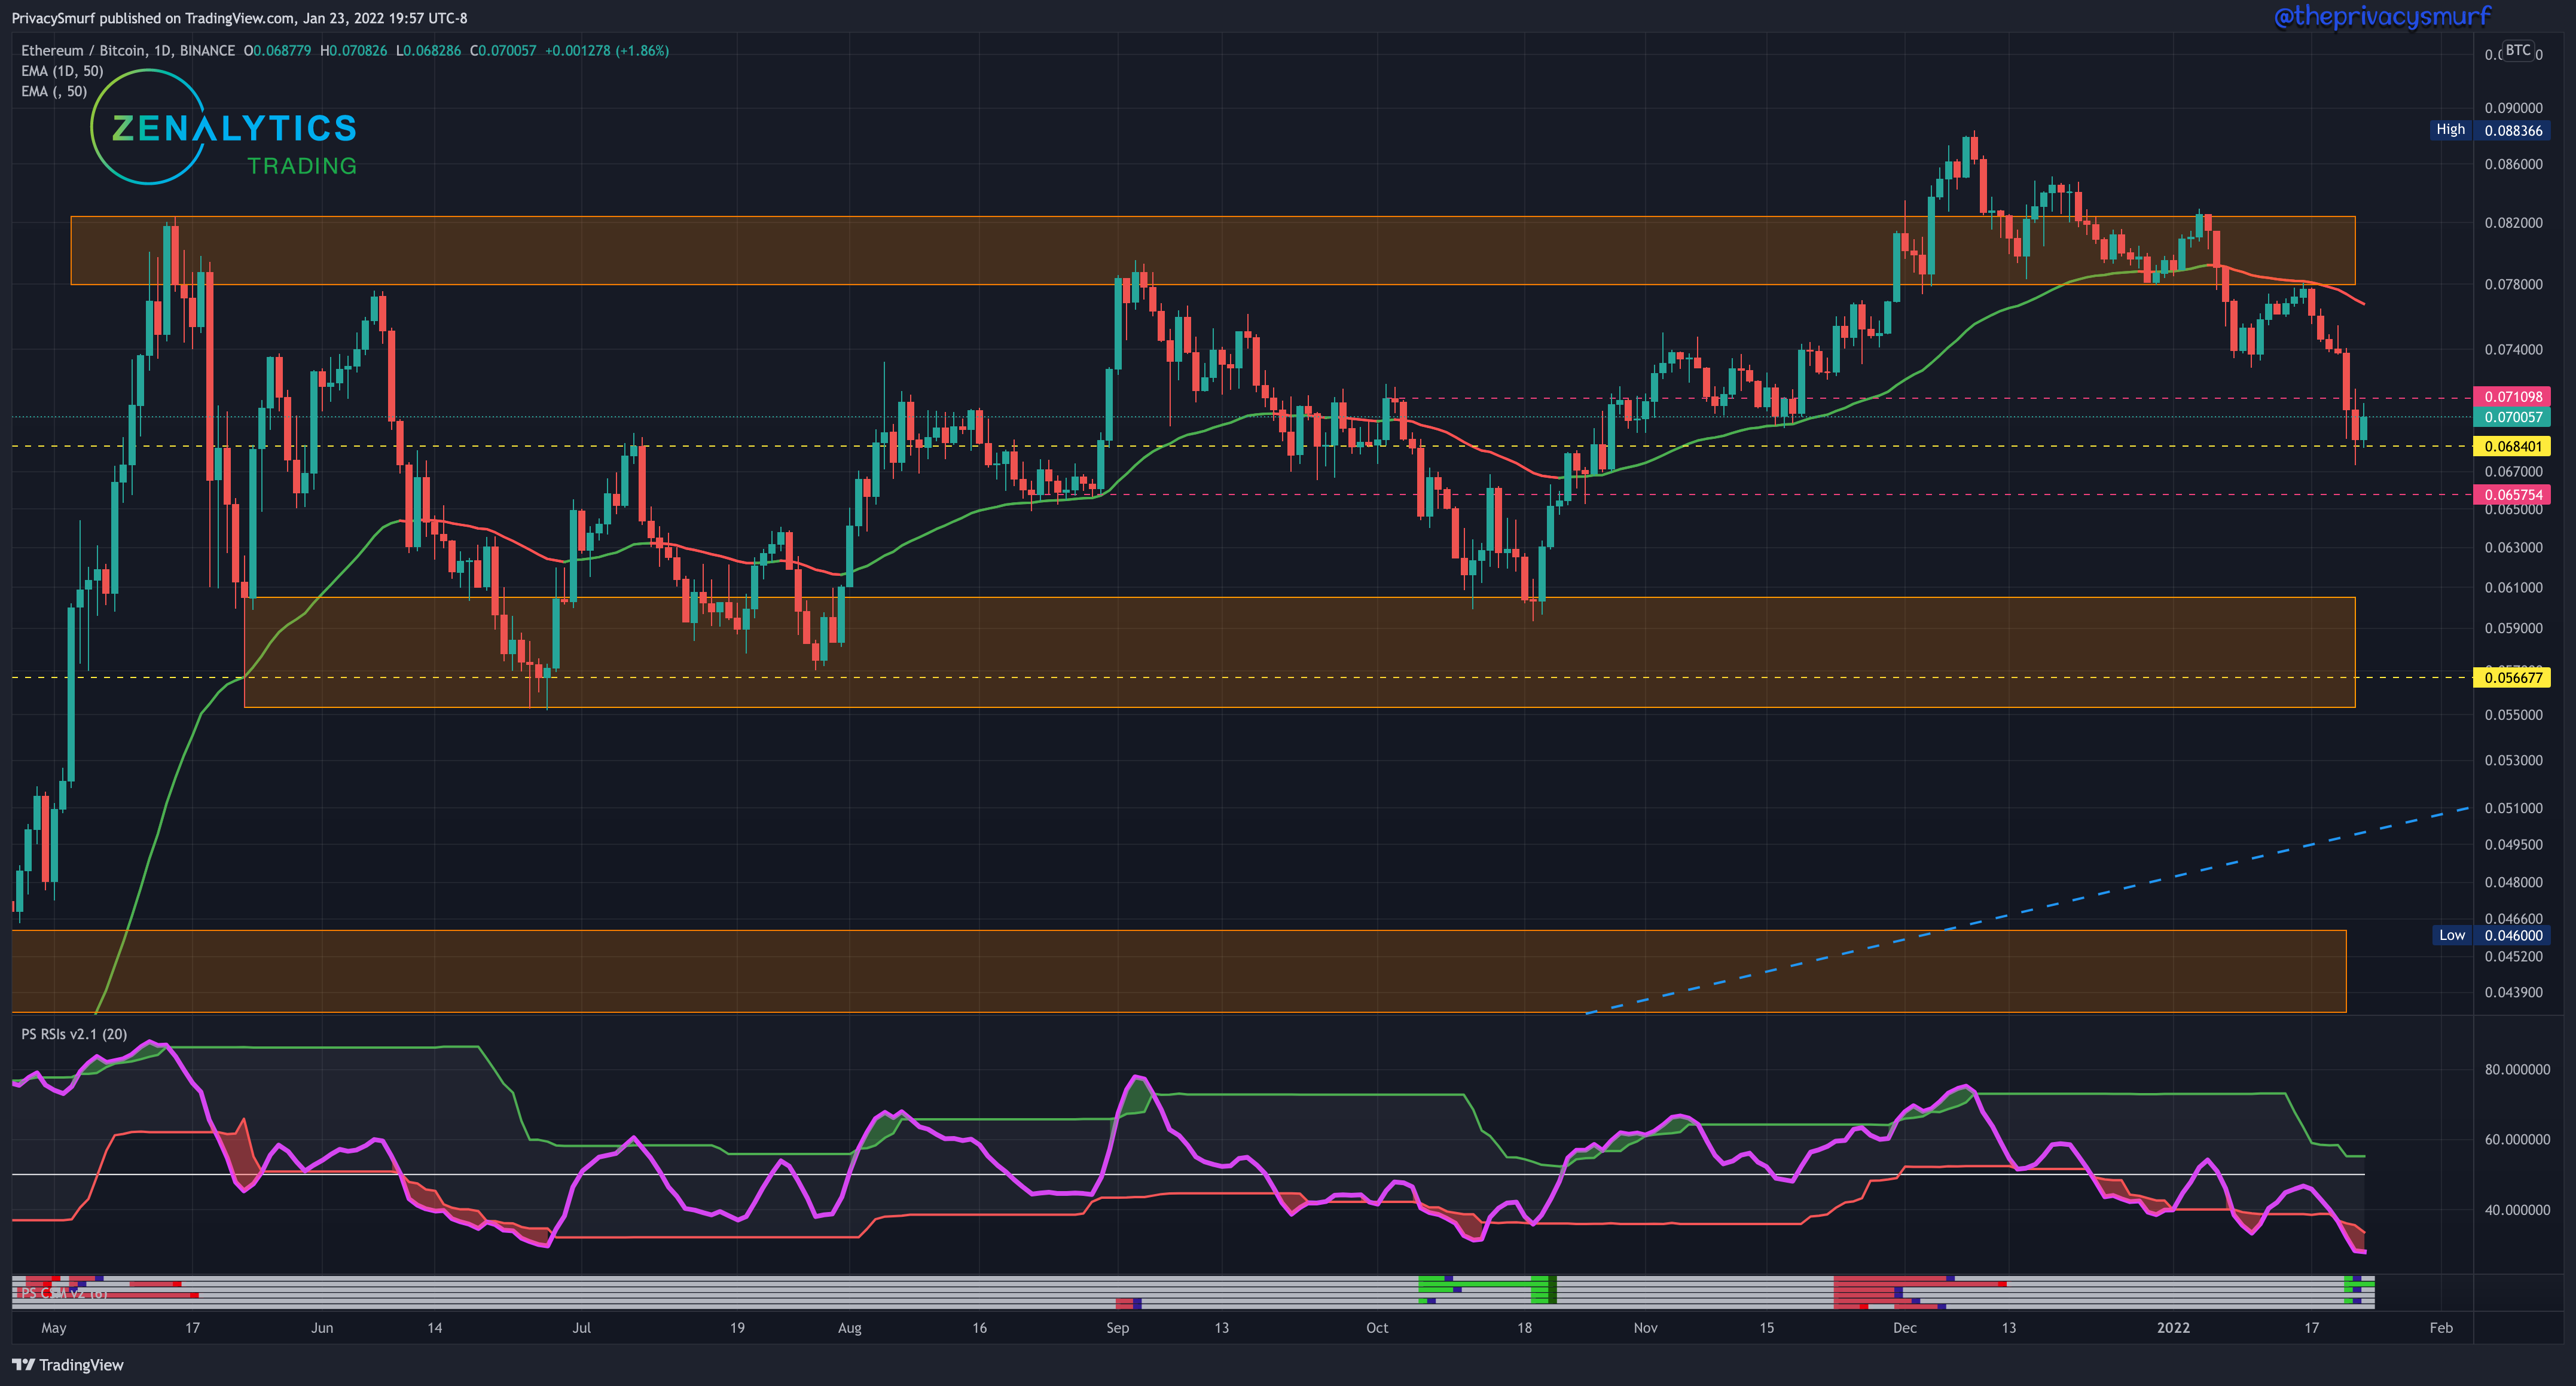
Looking closer at the current price action we see on the bottom indicator that all but one oscillator has been invalidated (blue dots on green lines). This suggests bearish price continuation and ETH to continue to decline in value relative to ETH. You can ignore the fuchsia lines at 0.071 and 0.065. I forgot to hide them. They are no longer relevant. I’d expect this chart to follow BTC and establish a new range around the current price. There’s no reliable short-term play here at the moment.

ETH/USDT Weekly Structure
https://www.tradingview.com/chart/JPTp0aXw/

This weekly close breaks the bullish market structure trend on ETH and is now in consolidation. What we need to see to establish a bearish trend is an up week and a close below $2539 (demonstrated by the yellow arrow). With the support failing, I’d expect $3059 to serve as the new ceiling on a rally. The lower range market structure support zone may be a bit far down for the week as a floor but piercing that zone is a good long-term value buy level under $2100.
ETH/USDT Daily Chart
https://www.tradingview.com/chart/xbB6lkZu/
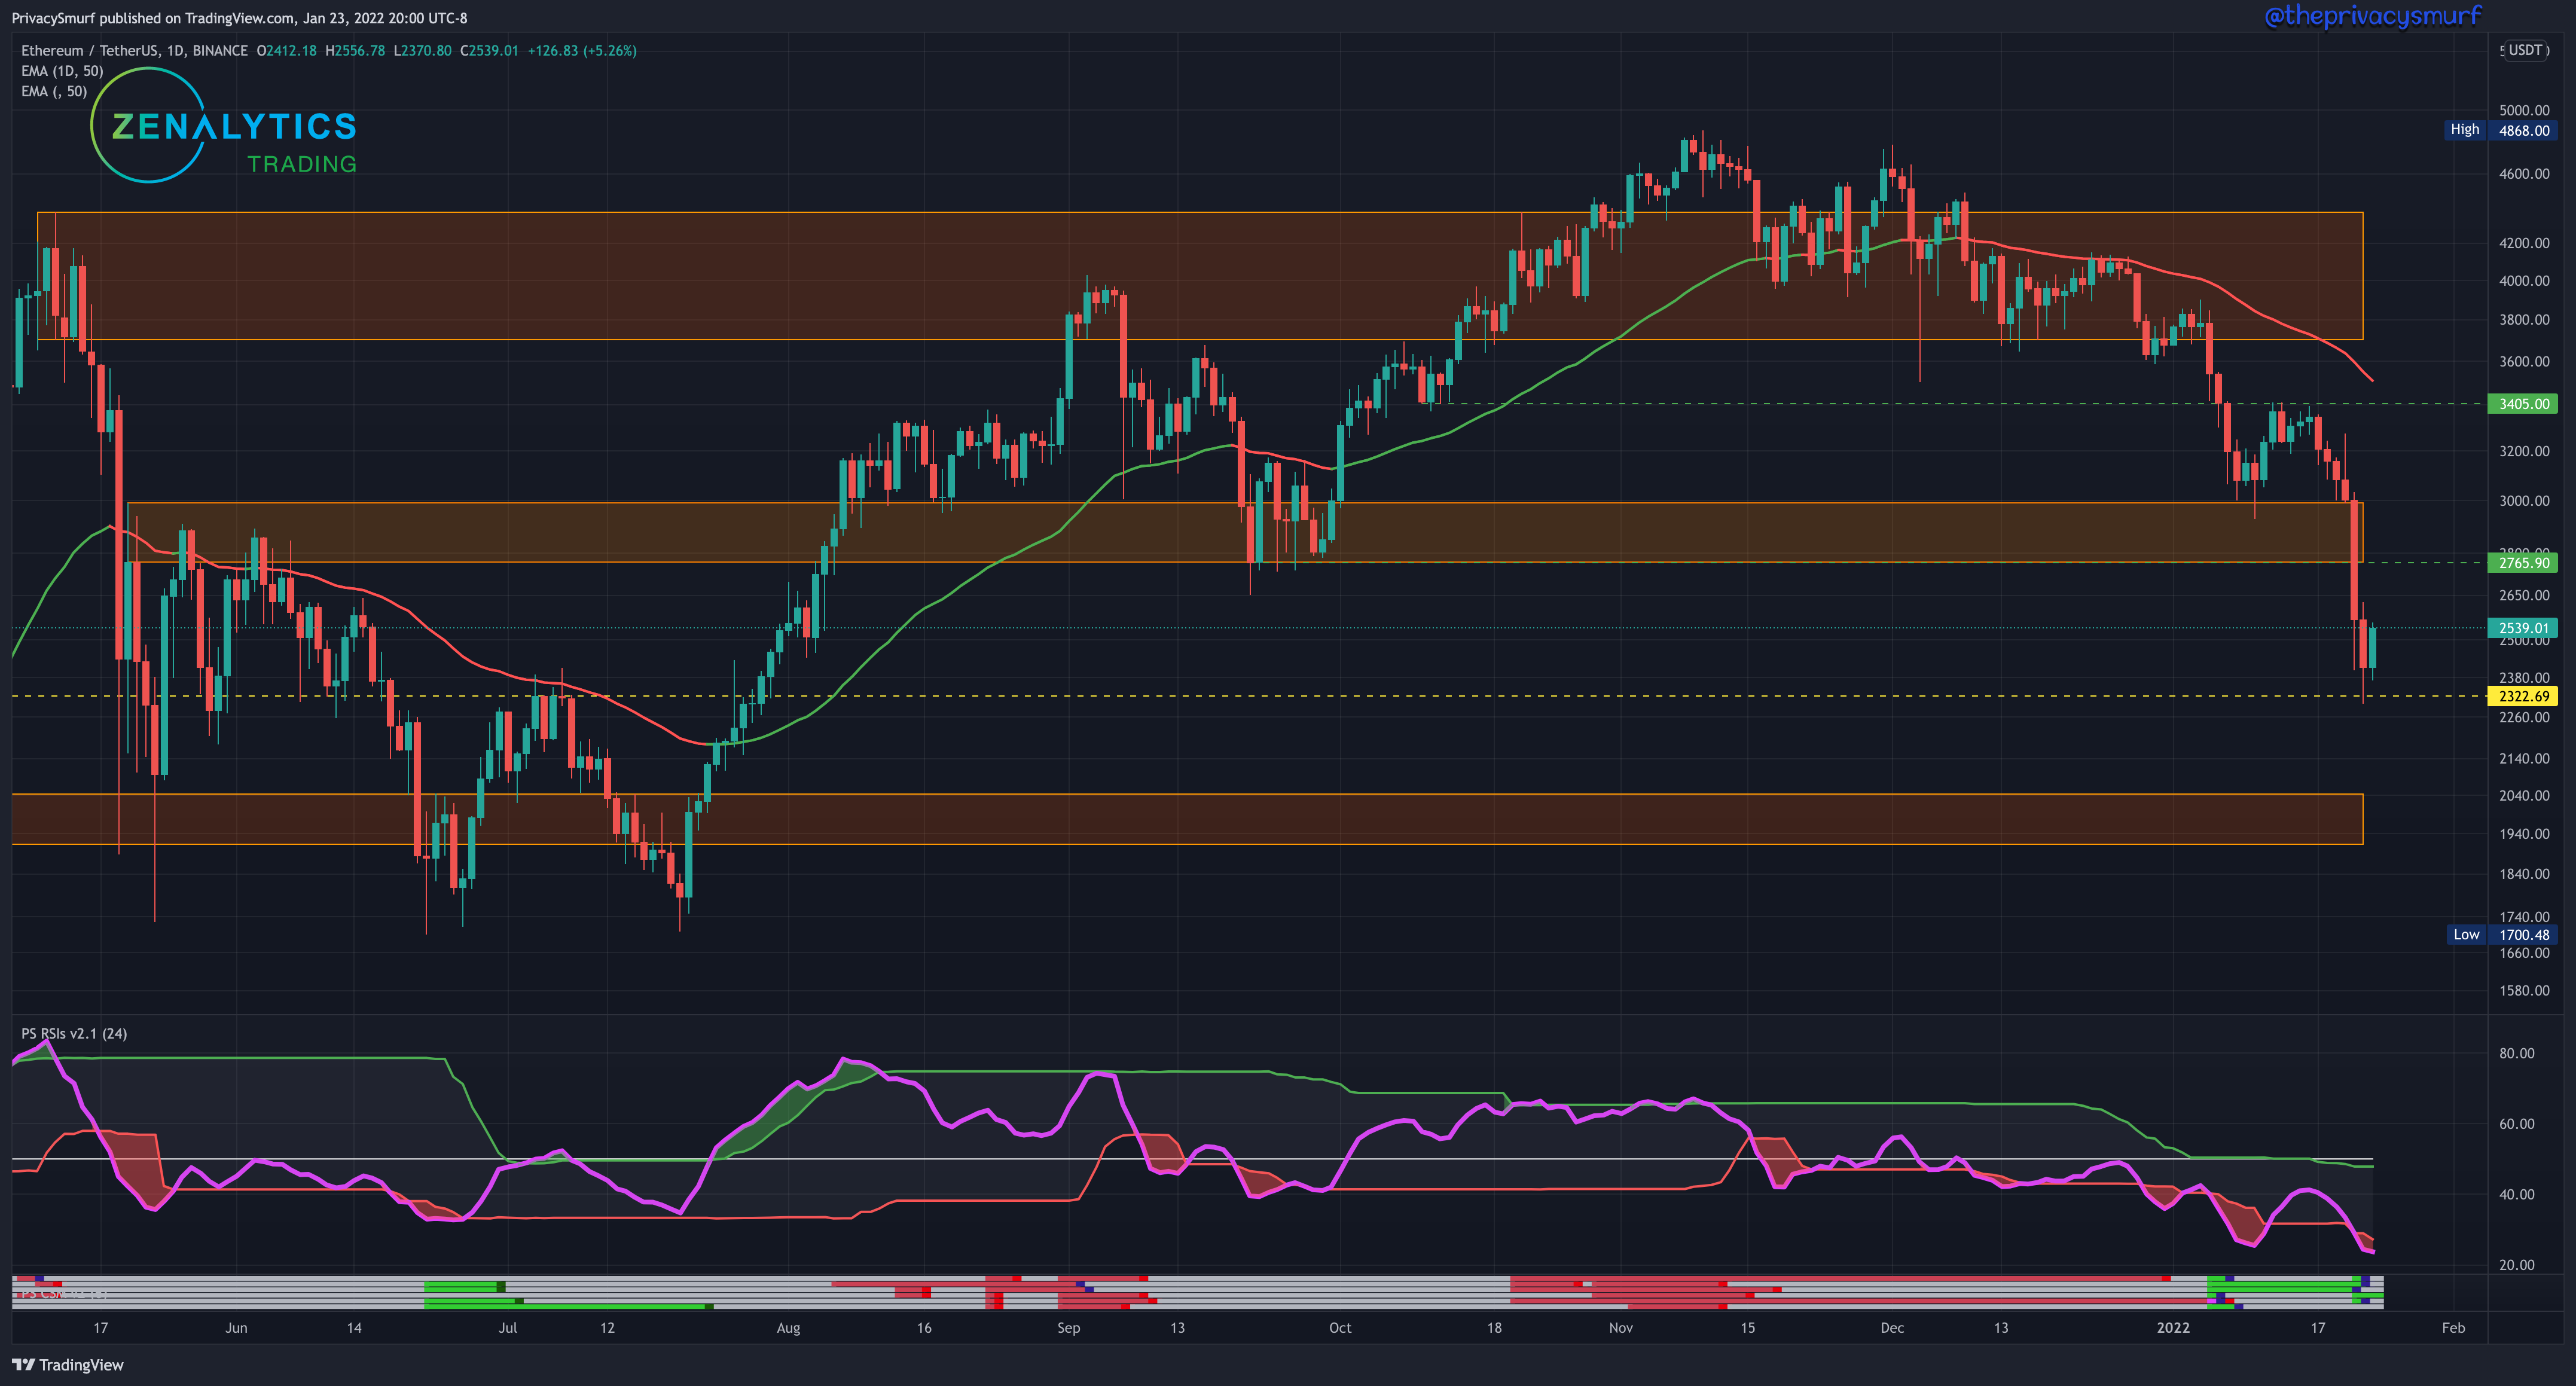
The zoomed-out ETH daily chart shows the older support line that caught the price on the way down.

Zoomed back in we see that all but one bullish divergence on the oscillators (green lines) have been invalidated (blue dots) suggesting bearish price continuation. Also, the bounce here is not a bullish engulfing candle. We do have a bit cleaner of a range to draw here than on BTC. I’m expecting still some bearish price action because the trend is still down but likely a range being established between $2300 and $2700.

All the gifs don’t really mean anything if you don’t tune into the attached song, sorry. Anyway, I know this week will probably be tempting for traders to make some moves if some bullish price action pops up but I urge you to be patient and wait for some confirmations for anything that will carry over a day or more. Short-term and intraday moves will carry a lot of risks so take your profits early. Long-term folks if you haven’t gotten any DCAs for your faves it’s not necessarily a bad time, but the bottoms are still not in according to technicals IMO so it’s also great to just wait. You do you.
@thepricacysmurf
I really look forward to getting your newsletters—like a kid waiting for Christmas morning.
Awesome jam. Reminds me a bit of Madlib collab with yesterday’s new quintet—Angles Without Edges. Track: “Life’s Angles.” And then there’s the gifs! I love the interplay. I would’ve never imagined getting such a technical data analysis newsletter that’s is oh so entertaining!