


The Trend is Your Friend
I wish I was paid a nickel every time I heard that phrase.

Yesterday, I talked about a widespread (and inaccurate) analysis dealing with historical performance that you’ve probably encountered at one point or another.

Today, I improved some of the Python code I use to detect and analyze seasonality. People are talking about seasonality when they compare past weeks/months/years to today. As I expanded on yesterday’s post, you should tune out when they bring percentages into the mix. Noting the trend, however, is the key insight.
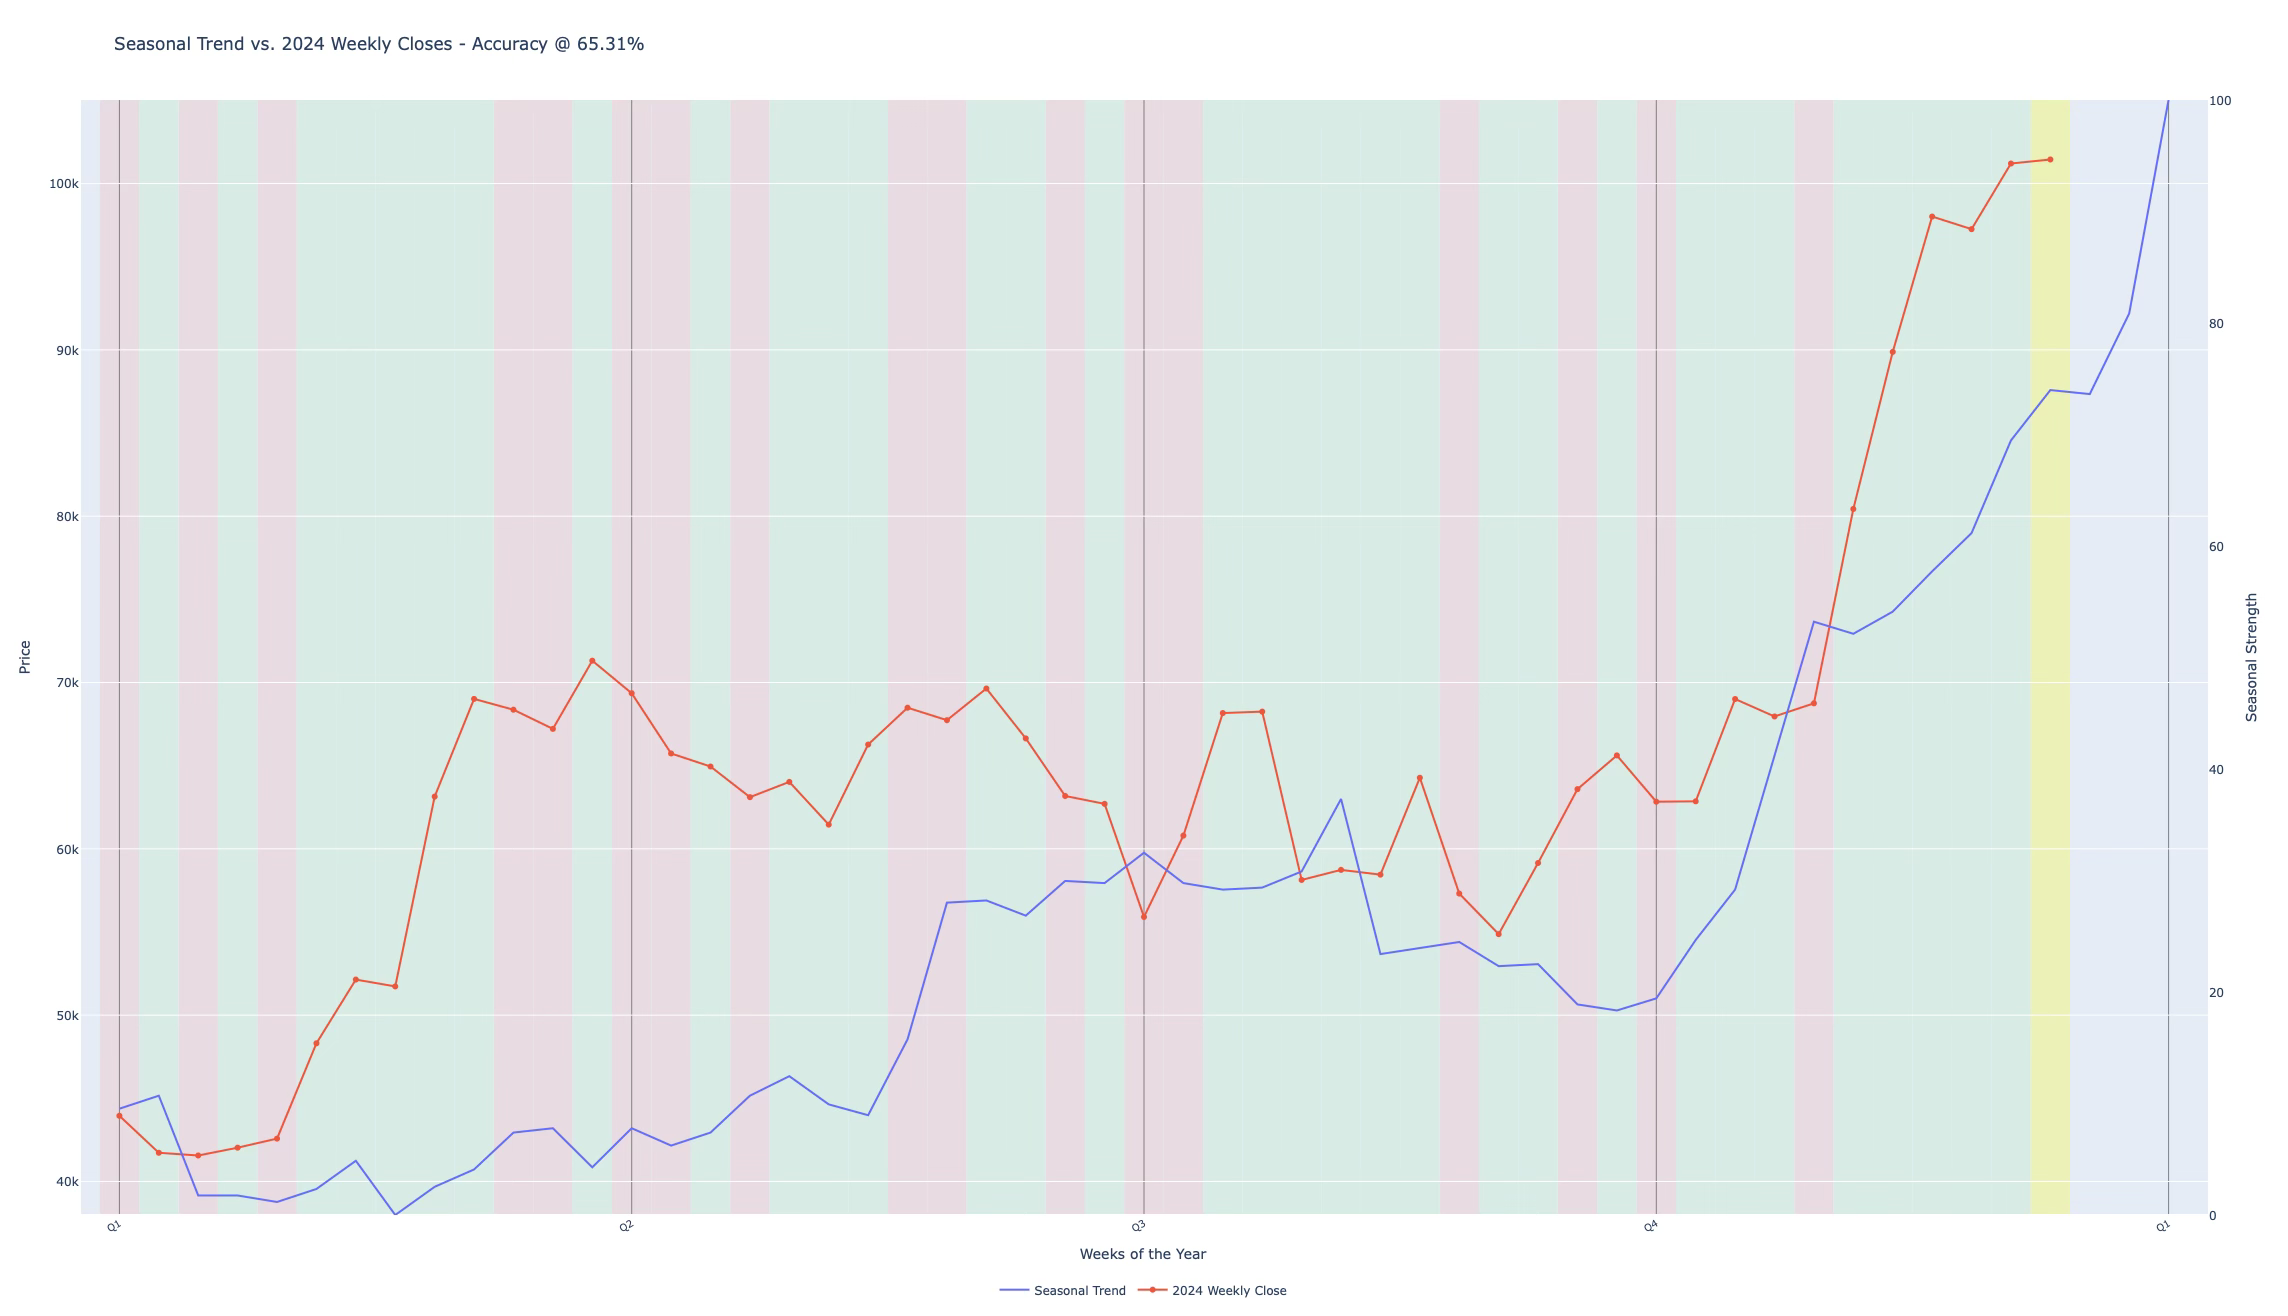
The fruit of my labor is above. BTC's seasonal behavior is shown in blue, and the weekly closing price for 2024 is shown in orange.
The annual trend is bullish from mid-Q1 through Q2, neutral to bearish from Q2 to Q3, and super bullish for Q4. In general, it was perfect, albeit more bullish than usual. From week to week this year, it followed the pattern very well, aligning 65% of the time.
Considering the market's general directionality in this way will be more accurate than any other comparison. The hard part is understanding the nuances of this underlying influence when prices aren’t going up. The influential tide still exists, but it will not appear as evident.
Returning to the image, this week is incomplete, so it’s in yellow, but it is still on target if we keep weekly closes positive. Next week is historically bearish, and hopefully, we will close out the year with the typical bullish spurt.
If you want a refresher on seasonality, you can watch the video in the post linked.
@ThePrivacySmurf

So, the seasonality for next year will adjust with the difference between the BTC previous seasonal behavior and the results of this years closes?
No more speaking to the empty void!