

Topical Thursday #8: PrivacySmurf's RSIs
Topical Thursday #8: PrivacySmurf's RSIs
Do you even lift?


Since I mucked up my last videos for the RSI script I share I’ll take some time to talk about it here. The script is a variation on the RSI or Relative Strength Index. I didn’t design the base code for the script, just modified it to suit my needs. I’ve read books written by the creator, and his work in cycle analysis and digital signal processing is amazing, although at times a bit beyond my mathematical understandings.
The RSI is a momentum oscillator that measures the speed and change of price movement. The RSI is a leading indicator. Identifying divergences between price and the oscillator can signal a potential trend change in price BEFORE it happens. I’m not going to go so far as to post the formula for the RSI so don’t worry.
One main function of the RSI is to signal when prices are becoming overbought ( trading above a fair value, overpriced) and when prices are becoming oversold (trading below a fair value, underpriced).
Another function of the RSI is to show when prices are not moving in sync with the speed of changing prices.
One issue I have with the stock version of the RSI is it backtests pretty poorly for the particular way I trade divergence. It’s pretty great for analysis though.
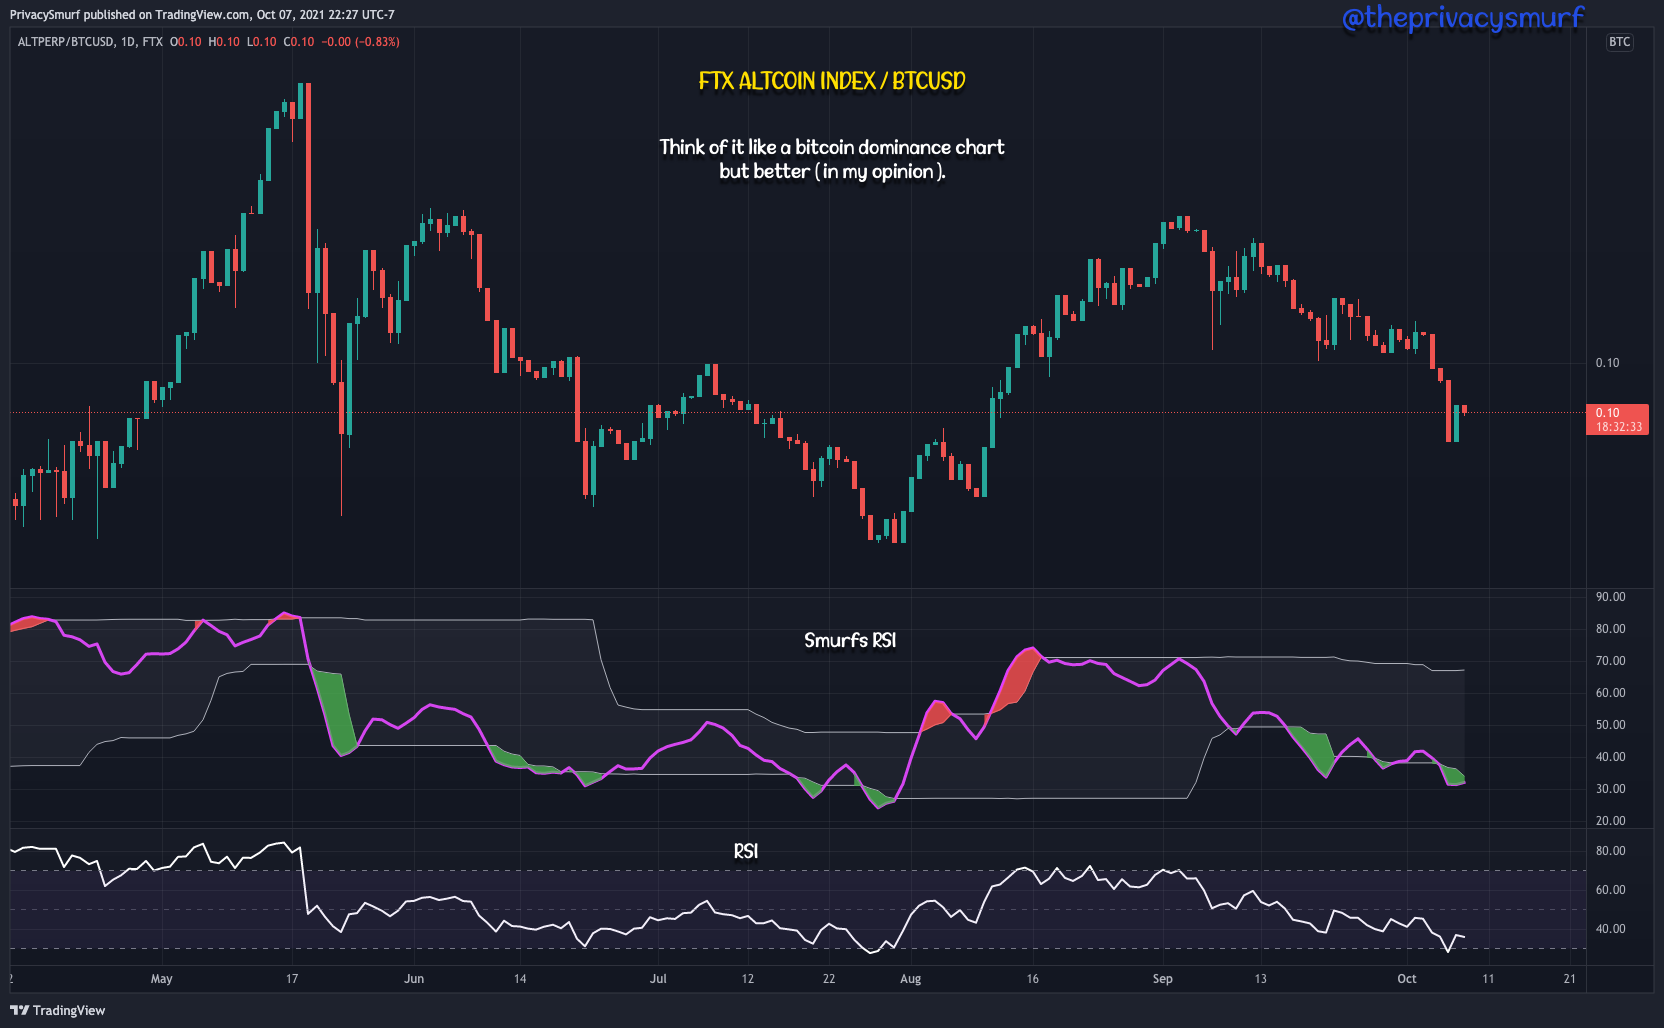
Here is a quick shot of both the stock RSI (on the bottom) and the Smurfs RSI script (middle). I’m gonna refer to variations of the photo. for the rest of the post. One thing you’ll notice when you look at the two RSIs is the smoothness. The Smurfs RSI is modified to be a smoother signal. This cuts out a lot of noise and some fake reversal signals. Another difference is the Overbought/Oversold (OB/OS) band. The stock RSI plots two bands, at 70 and 30. The idea being when the RSI is over 70 it’s overpriced, and when under 30 it’s underpriced. Both those conditions signal a potential for reversal. The Smurfs RSI utilizes adaptive OB/OS bands. They expand and contract with the changes in price. When prices are stagnant they well contract and when prices are moving they will expand. These adaptive bands identify when the price is likely to stall or turn more often than the traditional RSI bands because they change with the current market conditions.
Some things to note about the Smurfs RSI. I have it tuned to ways I utilize it. That is primarily for analysis, not for trading signals. It CAN be used for trading though as you’ll see in the analysis of each function of the script.
Dominant Cycle Length (in settings):
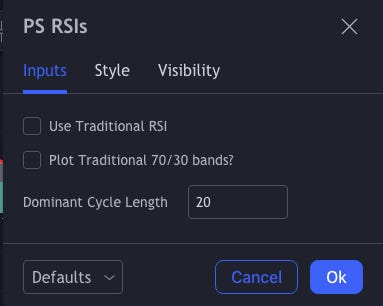
This honestly deserves a post all for itself. I’ve covered cycles before back here. Long story short I have the default setting here as 20. One very frequently present dominant cycle in BTC is the 40-day cycle. The cycle setting length is supposed to be half the current dominant cycle. Fine-tuning oscillators to the dominant cycles makes them more reactive to the specific asset. Since this is a very often occurring setting, it’s a pretty decent default. Most coins are affected by BTC since BTC is a honey badger so being in tune with BTC cycles is a decent base to measure from in my experience. I’m working on making it adjust dynamically, but my coding skills mean it takes me longer than a normal coder. I hope to integrate that feature in a future version. I have gotten questions about the settings before and it kinda makes me glad because most things I read and watched in the space about different oscillators just use the default settings and NEVER change them or suggest why the setting is what it is. It just seems acceptable to use whatever it pops up with. You can either leave it as 20 or you can fiddle with it and see what setting seems to be fitting well with the price action. Cycles are always changing so at times it will work better than others. Changing it doesn’t make a previous setting wrong or the oscillator a bad one, markets change. There’s nothing wrong with adapting to that.
Crossing of Bands:
There are two ways I look at this for analysis. If price is between the bands and crosses above or below the bands often price will respond with a similar directional move. This is noted with the second red arrow and the second vertical green arrow. When this happens the script will fill the gap between the RSI and band with a color. When the RSI is above the band the asset is becoming oversold and it plots in red. When the RSI is below the band the asset is becoming overbought and it plots in green.

This is where some confusion comes in if one is TRADING based on this crossing. When I see the RSI plotting red it’s a signal to me that the price is starting to run away from a fair value, like a tachometer on a car’s dash, the price is getting overheated and it can’t stay that way forever. That is why there is a red plot. Price is getting too fast and is likely gonna slow down and/or reverse. However if one is trading a cross of the top band the red would seem counterintuitive, because often a cross of the top band has a bullish reaction in price. Trade 1 (green label) shows a cross of the top band followed by a bullish engulfing candle above resistance. Entering a long trade at the close of that candle (green arrow) and exiting the trade at resistance or when the RSI crosses back below the top band (fuchsia arrow) can often net a pretty good return. In this chart’s case, ALTPERP/BTCUSD isn’t a tradable asset, but for analysis’ sake, it’s saying that altcoins are going to increase in value compared to BTC. During the period of April to May BTC was completely flat while alts ran like crazy.
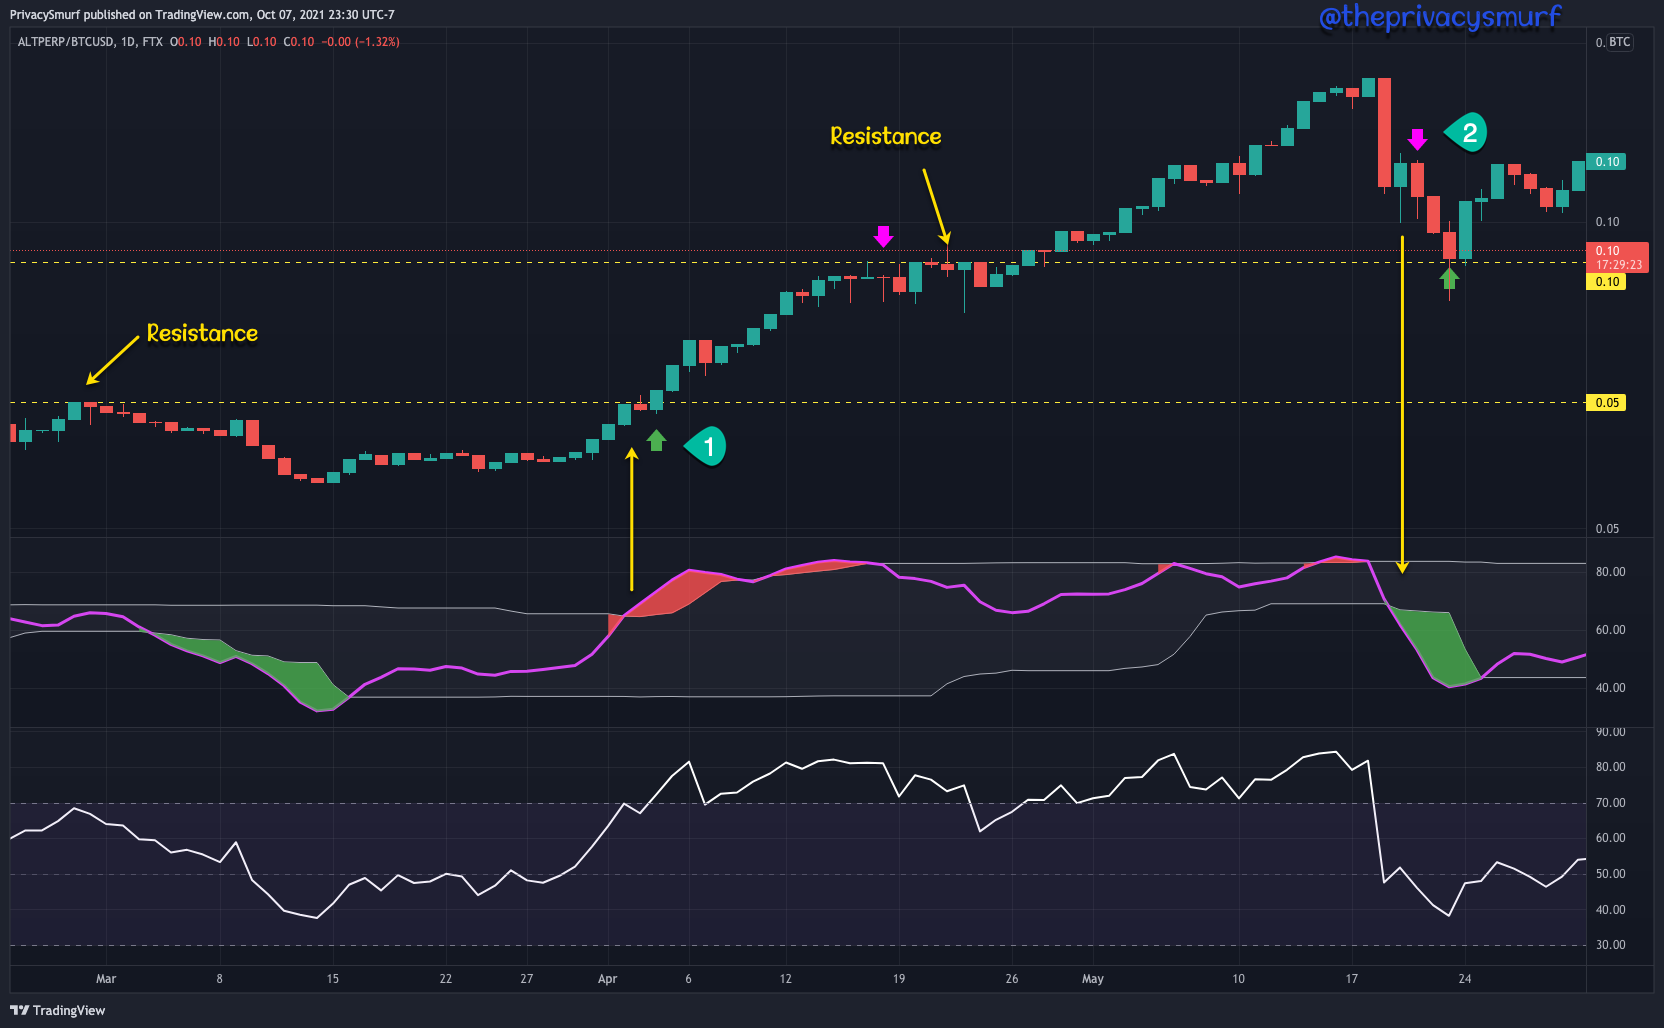
The green plot when the RSI crosses below the bottom band for analysis tells me that selloffs are too irrational or forced and the timer is already started for the bleeding to stop. However if one is trading a cross of the bottom band the green would seem counterintuitive, because often a cross of the bottom band has a bearish reaction in price. Trade 2 (green label) shows a cross of the bottom band followed by a bearish engulfing candle. This is confirmation that the prior day’s bounce is not going to last and the bearish trend is going to continue. Selling out of altcoin positions (fuchsia arrow) that were down and buying back in at the previous resistance, now support (green arrow), would have offset a lot of losses.
The colors are all changeable so do what you need to so it all makes sense for your particular uses.
Divergence:
Divergence is a showing when price is going in one direction and oscillators are going in a different direction. Below we see altcoin prices increasing into September and at it’s peak the RSI set a lower peak than a previous peak. This is bearish divergence. The yellow line marks a trigger I use to signal that the prices will continue to fall It was signaled on the bar with the red arrow. At this point I’d sell alt positions back into BTC because the chart is telling me that they will decline in value relative to BTC. BTC continued to lose around 13% in value while most alts lost +20%.
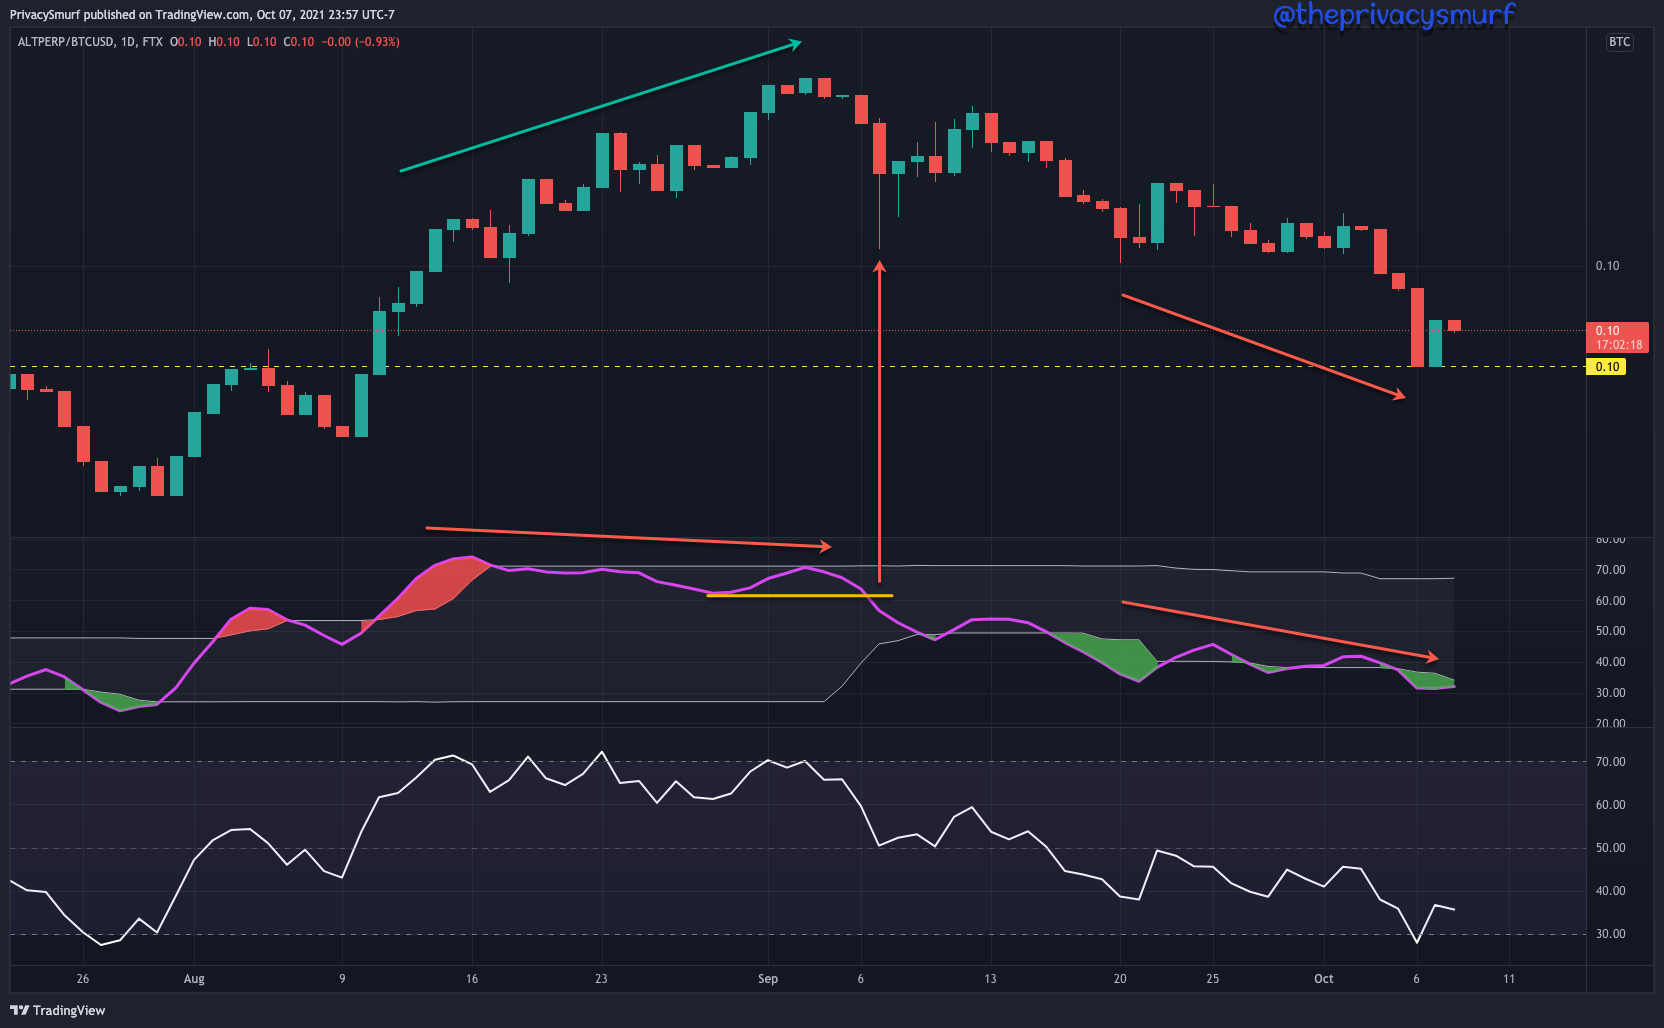
The right part of the chart is a possible look into the future. Altcoins are showing no divergences. The RSI is plotting new lows while the price is also setting new lows, so there’s no reason for me to expect a big trend change although the hard downfall may be easing up when the RSI crosses back above the bottom band. It’s very possible that BTC will still be the big gainer over the next few days. Especially so if this support fails to hold. Alts will lose a lot of value relative to BTC. That can mean a few things. The whole market can fall. BTC can gain BIG and suck all the money away from alts (alts bleed). BTC gains and alts gain but BTC gains more. As long as it’s not the first scenario I’m ok with either.
I hope that answers a lot of questions. If you have more, or have requests feel free to ask. Hope the script has been or will be helpful for you. See you all Sunday for the next Synopsis which will be available for everyone.
Thanks!
@theprivacysmurf
Don't know why I'm just reading this but it's awesome info as usual. Thanks