

Wednesday Write-Up #12- From the Water
Wednesday Write-Up #12- From the Water
I love to see the sun In spite of all it's done.

Soooo, I’m not dead or ghosting anyone. Took a last-minute unplanned camping trip with some biking and kayaking and waterfalls (because why would I say no to that??). Sorry for the radio silence and thanks for the concern but judging by the number and candor of messages I’ve gotten over the last couple of days, I need to emphasize a couple of key points about the newsletter. While I understand I can’t control an individual’s use or take away from my posts I need to be clear I'm not writing the newsletter to be a lifeline or as a call to action for any trading/investment decisions or implementation as the sole source of information or to be an on-the-minute update to some market activity although if I’m around and I think it’s notable I do try to comment.
This all came to be to provide some form of objective education/insight in the space and primarily to show how rigorous and consistent application of the same core concepts in the market over and over again can produce accurate analysis while also tossing in some (what I think are) unique data points along with my quirky flair.
Each week I go over the same aspects of BTC and ETH:
The closest horizontal support/resistance (or expected trading range)
dynamic support/resistances (EMA)
3 to 4 candle patterns
My public RSI variation (but could be any momentum-based oscillator).
Entries cued both from my (not publicly listed but available by request) indicator and/or price action
Exit considerations both from my (not publicly listed but available by request) indicator and/or first expected resistances.
Since last June I’ve not really changed much about the analysis week in and week out. The only part of the entire process that is mostly non-replicable by the individual reader is the quarterly forecasting and cycle work. It’s not inaccessible, but it’s also not the thing that is making my analysis as good as it is. It’s just one tiny part of the whole process and I was successful before I learned the nature of cycles. Many people are profitable not knowing that particular information because they fully comprehend the (IMO) RIGHT technical elements of the market, some form of the things I listed above. I have consistently tried to impress upon folks the notion that a simple process and an understanding of these concepts can make a world of difference.
While I think it’s easy to point to my past language and say this is being written to guide decisions I’d argue that it’s more to provide my internal monologue when I’m looking at my charts. And btw, these ARE my own charts. I use these every day/week for my own trading/investing purposes. In my opinion, I’d consider my weekly posts as a sort of benchmark for your own analysis. I have shown that I can post week after week and be mostly correct on the outcomes. I’d urge you to do your own analysis first and then come to read mine with your own thoughts and plans to compare to mine. Where did we come to the same conclusion? How did you get to a different one? If we had different thoughts evaluating the correct one after time has allowed the analysis to play out. Use this new data to adjust your thought process or ignore me in that regard (also tell me about it so I can adjust my own process).
I apologize for the irregularity at times. It may not be an adequate justification, but I’m a one-man show and I’ve got a life to enjoy along with other ventures, aspirations, and interests. That means sometimes I’m not sitting around making a post when I said I would. If that is unacceptable in your eyes I’m 100% not against handing out refunds and won’t judge you for that at all. I don’t necessarily feel great when I don’t get a post out but also it’s not really the end of the world for me. I’m not writing for the money. That part is just to capture back something for the time I spend to produce these.
Also, this is why I think it’s important to not look to me as a guiding light and why I stress the process of learning this for yourself. No newsletter or instructor or guru or influencer will ever be as readily available to you and your needs as your own analysis and intuition. I’ve shown the process works. Study it, ask questions and apply it to your own charts and compare your work to the mine.
One last part and I’ll get on to the analysis. In reading a book during the downtime I came across an interesting quote. ‘If trading and investing is your hobby, you are probably going to make hobby money, and hobbies don’t pay much.’
It’s harsh but kinda true. If you find yourself in a position (for whatever reason) to not meaningfully devote time to your trading education/career I’d suggest finding a different resource than mine, or at least more resources. My newsletter will likely never be something that prevents you from having to do some work yourself. While I will likely be on top of the market activity I’m also not going to be the guy to keep my finger to the pulse minute by minute 24/7. I just don’t have the desire to do that. Not even for myself. I enjoy my freedom/flexibility too much. See photo below. :-p

Hope I didn’t lose anyone. On to the analysis.
Well.. song first.
I’ve seen the Toadies a couple of times. Always a great show. Always in some small ass dive bar. Yeah.. exactly like that one you just thought of. Also, I really like this album. It’s one of my tops.
Just a quick reminder. All these charts have an associated chart link below the bold titles. That link is my shared public layout that you can either bookmark in your browser and check on at any point in time to have my up-to-date charts OR save a copy to your own tradingview account to edit the charts as you see fit. Keep in mind if you save a layout copy for yourself it WILL NOT continue to update as I make modifications to my charts in the future.
BTC/USDT Weekly Structure
https://www.tradingview.com/chart/4v8qizyI/
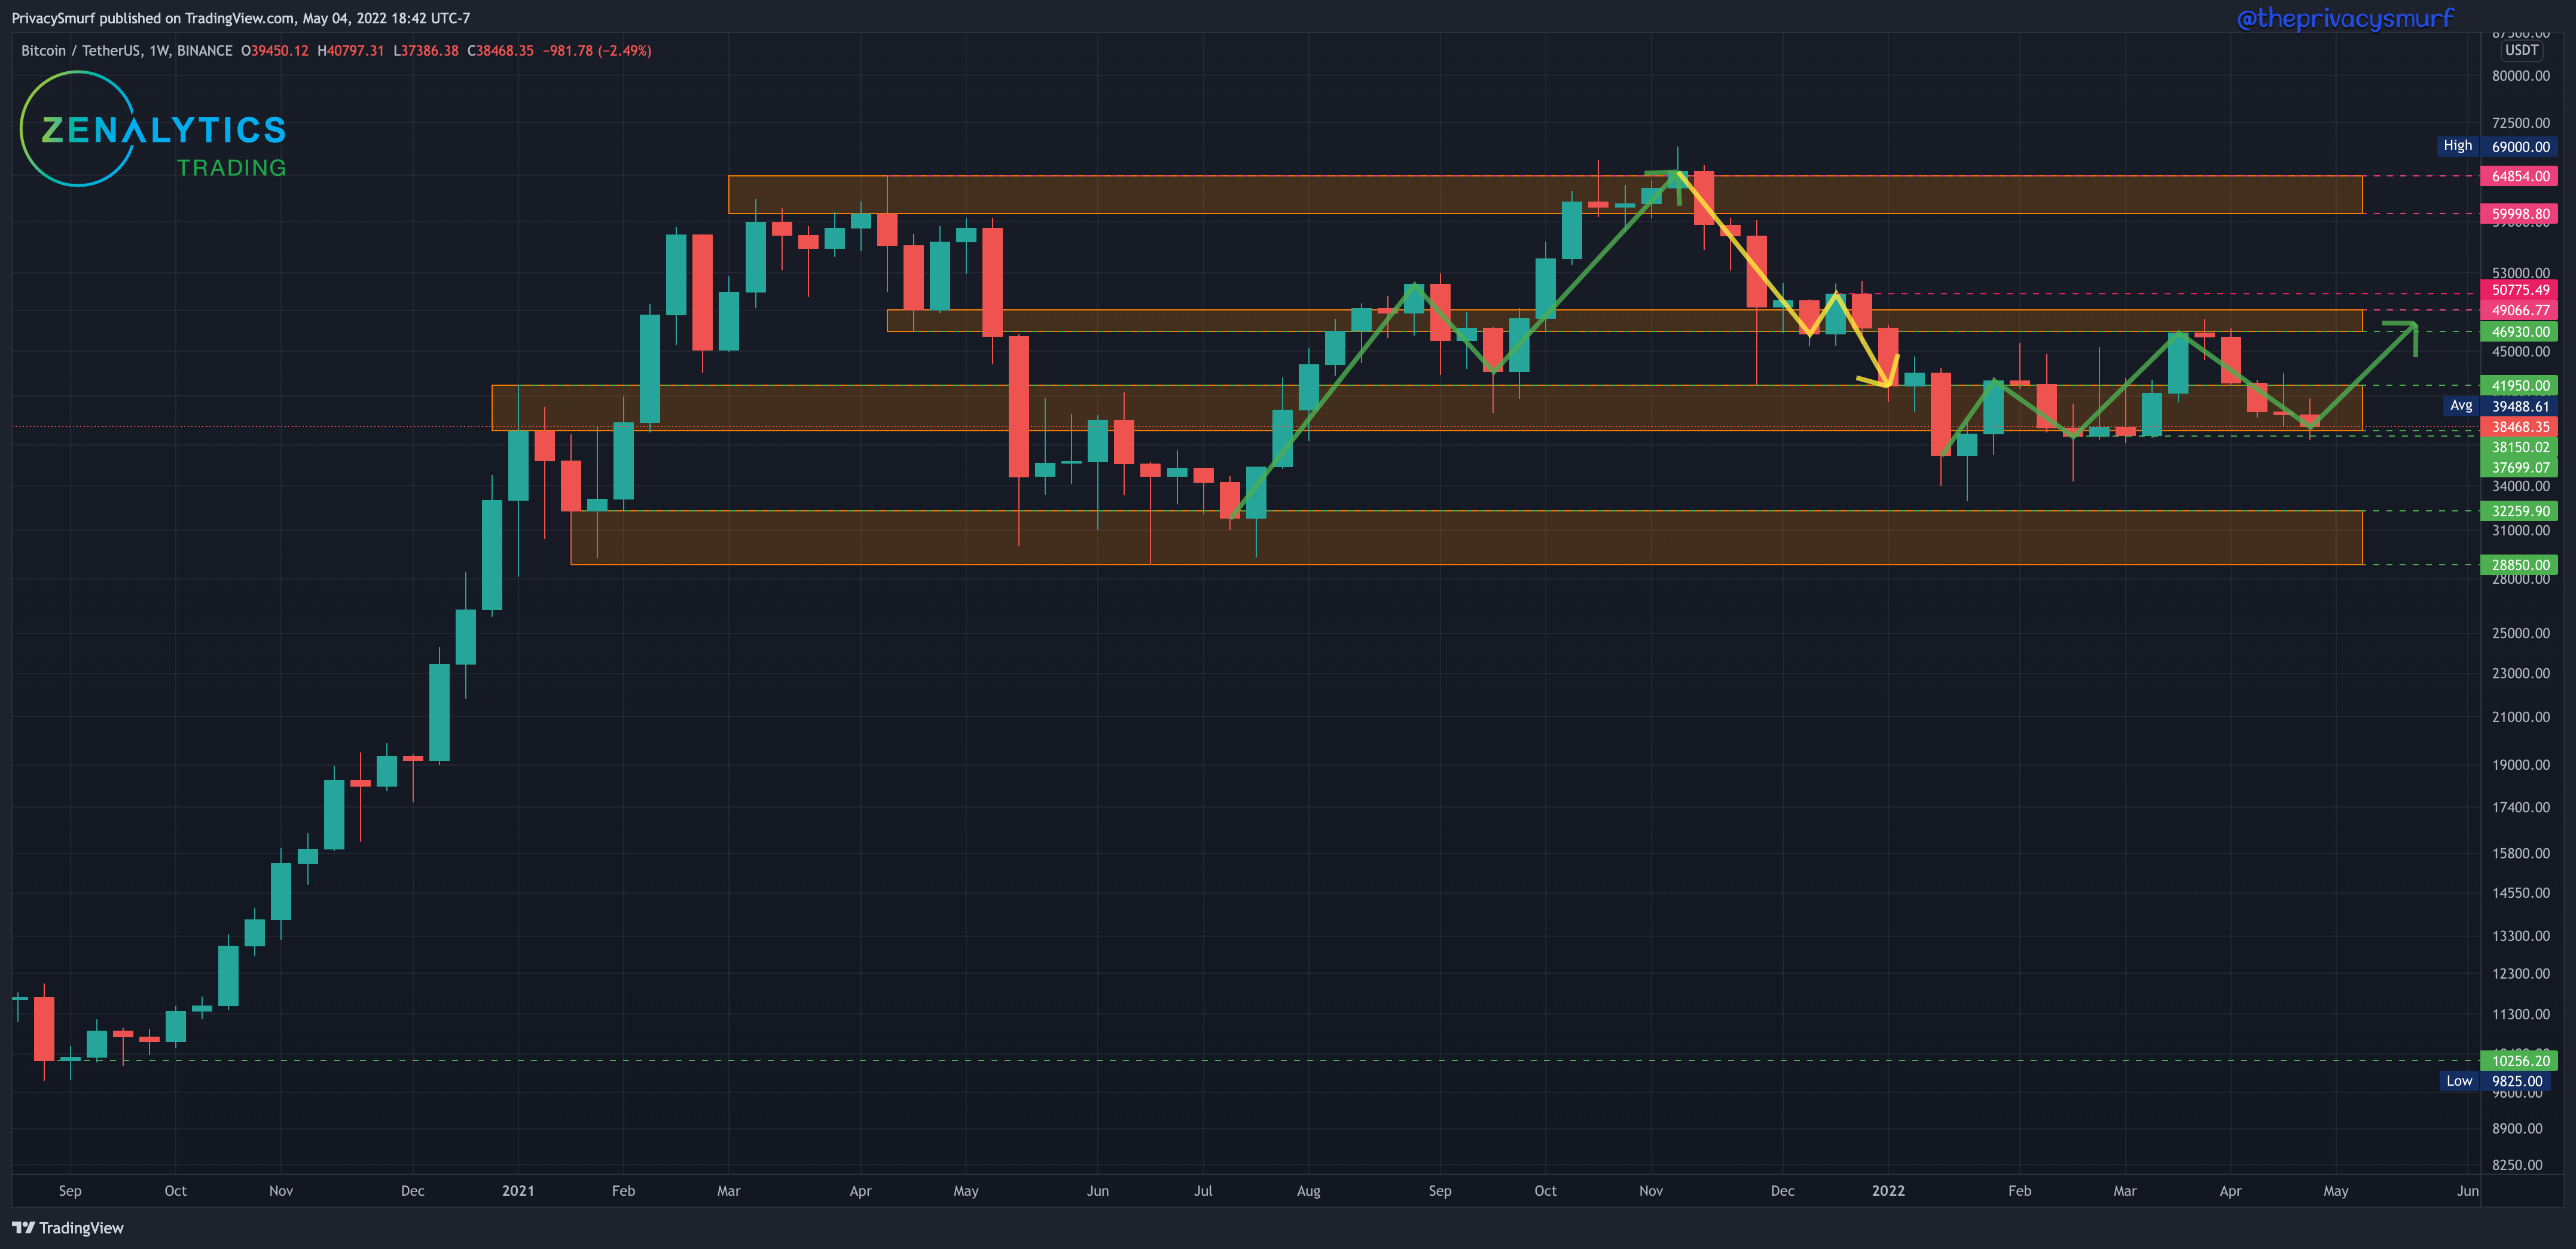
This week honestly is a repeat of last week AND the last week.
Another bearish week as we close lower in the weekly support zone. The weekly trend still remains bullish in terms of market structure. A weekly close below $38180 would put the trend back into consolidation. I am expecting support to come in at that $38k level but wicking action below is very possible. In my opinion long term positions could be added to on daily prices trading as low as 36k before I take a pause. Once the price is trading below those levels the potential for a meaningful deeper retracement increases.
Closing this week presented with about equal wicks to the downside and the upside which would suggest a possible continue of bearish pressure but a potential shift in the following week as support has held for the moment and may gain momentum to the upside. The daily chart will help determine the likelihood of that. (this is slightly cheating as we already know how the week is shaping up, but again, this is just an inner monologue from looking at the chart.)
BTC/USDT Daily Chart
https://www.tradingview.com/chart/jjSdFW4b/
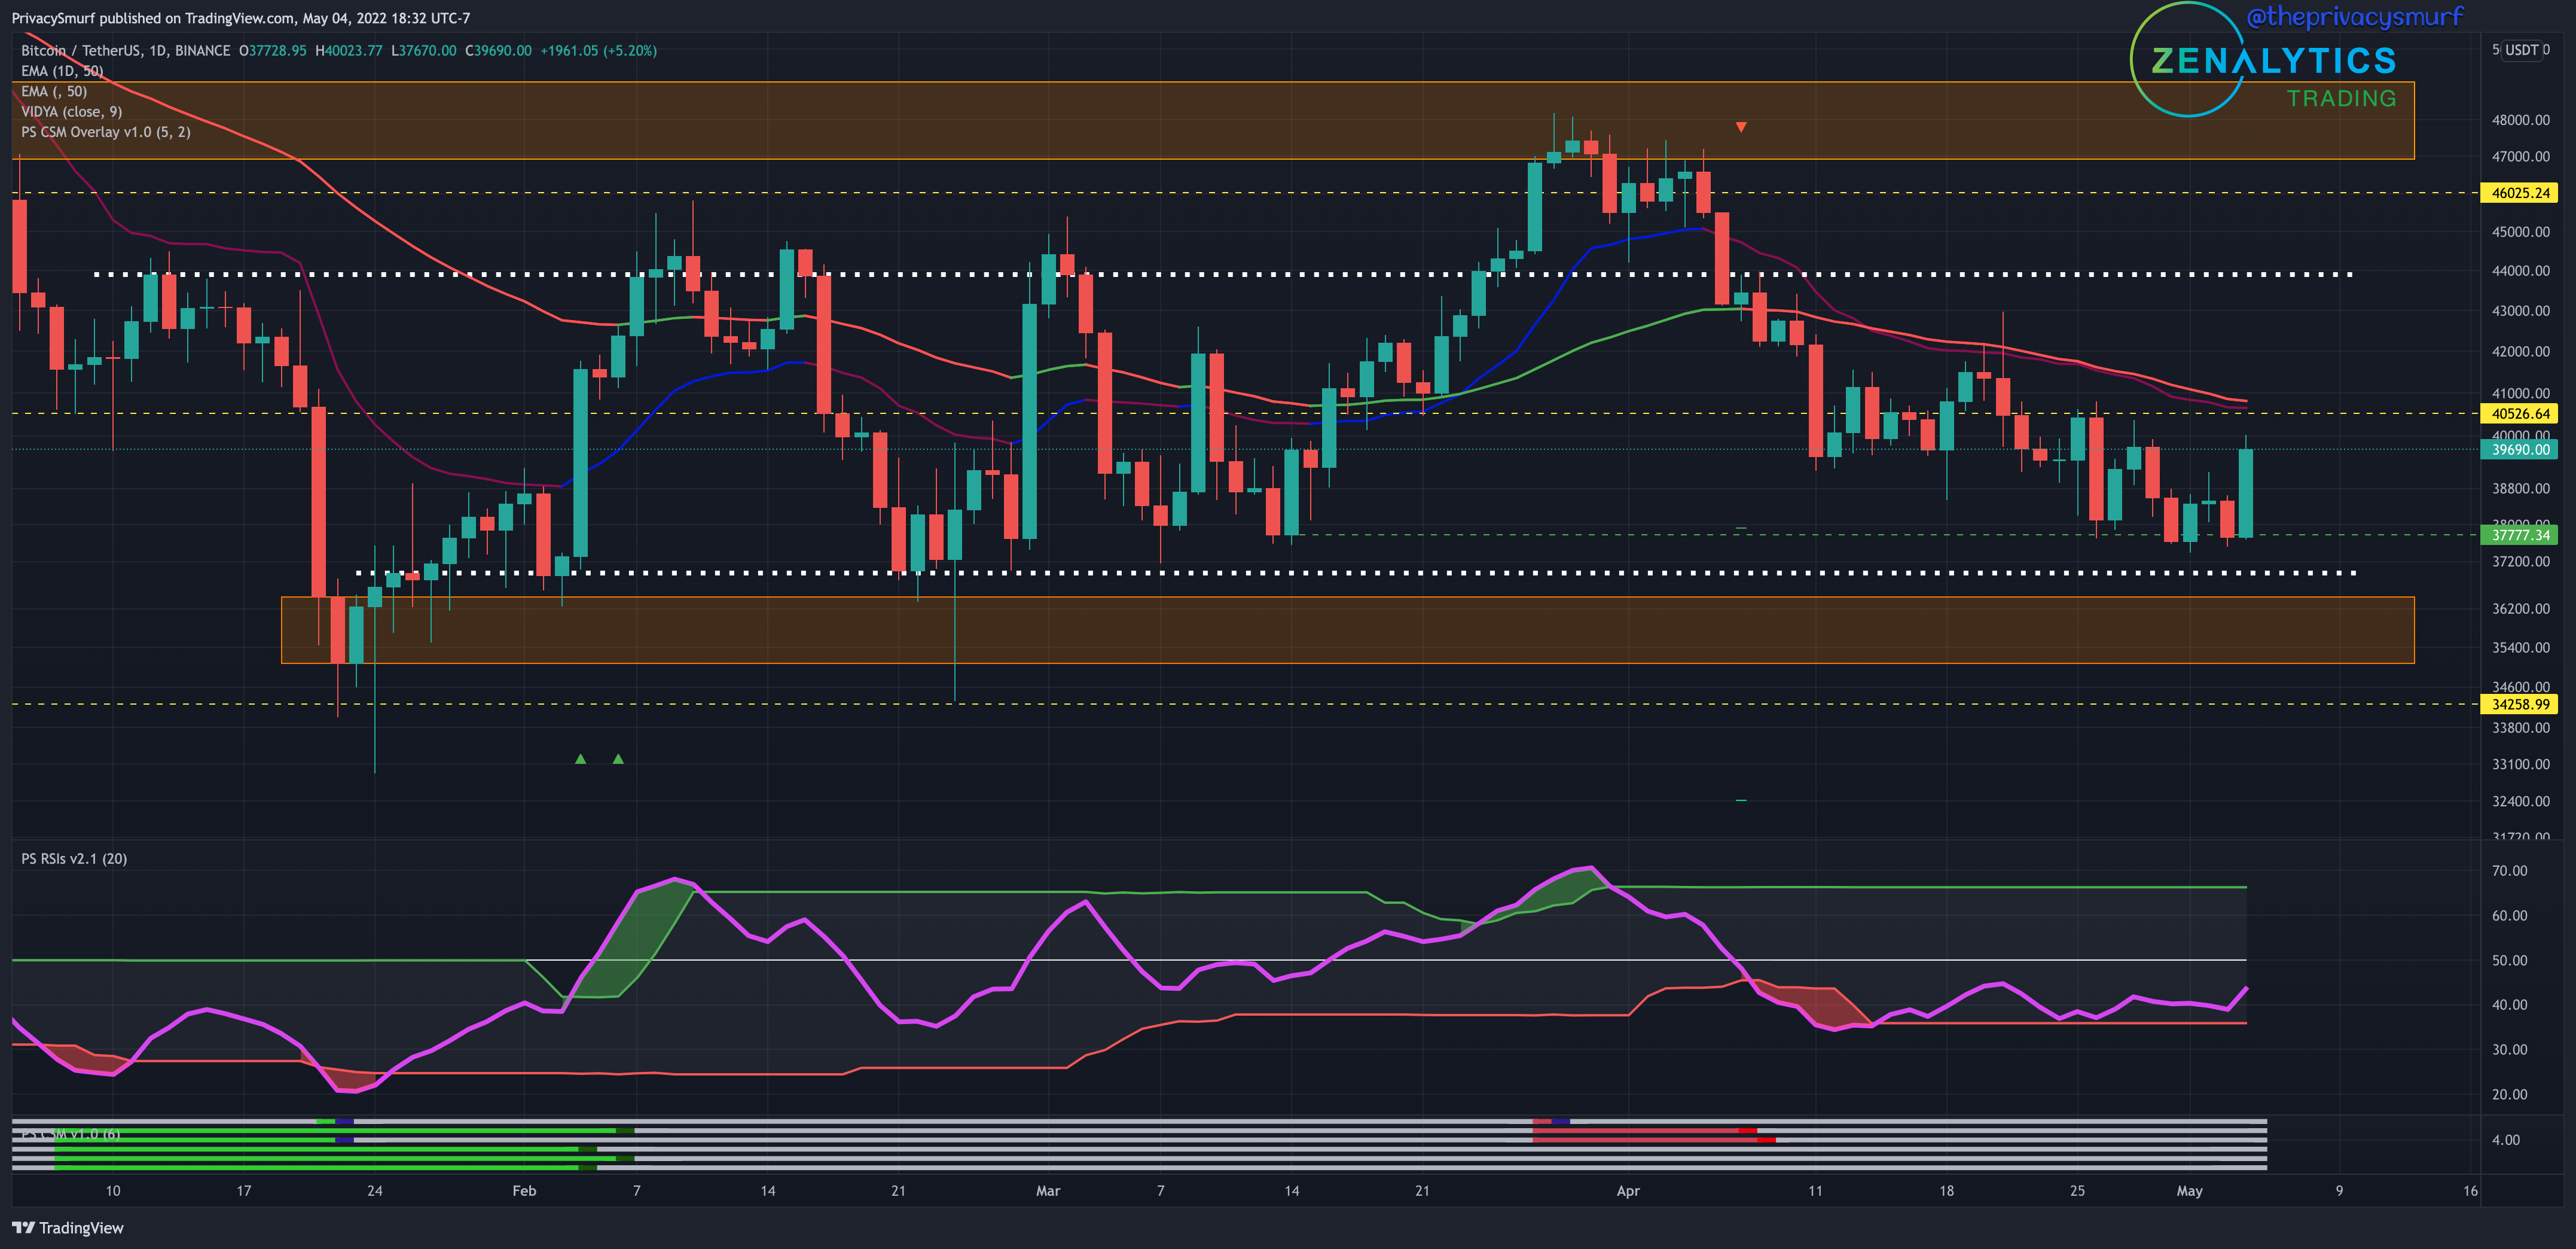
Here’s last week’s info.
With the RSI trending back towards a downside break of the bottom band (yellow arrow) I’d expect a retracement early in the week. My custom indicator, shown on the bottom of the chart, the Correction Strength Meter (which is private but available upon request and payment) has signaled since April 7th the potential for a bearish retracement with initial targets for a short trade around the $38k price level. At the moment this target is not outside of expectations. The bullish structure was lost at the failure at $41k. I’d put an expected range this week around $37k to $42k.
The bearish targets signaled before at $38k were hit this past week and support from the mid $37000s showed up. Getting very technical price closed under the last lowest close support at $37.7k. This is slightly worrisome as it shows BTC is still making lower lows closes, a textbook feature of a bearish trend. The trading range from posts prior at $37k to $42k is still a valid and expected range. However, the possibility of the lower support zone being touched with some wicks on the daily chart is increasing in my opinion. To consider this rally a valid return to bullish consolidation a daily close must appear at least above the 50-Day EMA (currently trading just under $41k) but more importantly above the higher close on April 20th at $41.5k.
ETH/BTC Weekly Structure
https://www.tradingview.com/chart/sacHlXOv/
This week honestly is a repeat of last week.
We have another bearish close in the ETH/BTC relationship. With the weekly chart of BTC presenting bearish this relationship will likely follow. There aren’t any moves to be made with this chart on a longer-term scale. The daily chart will give an idea of the potential for another bearish week. A weekly close under 0.066 would transition to consolidation. I’m not expecting this by any means this week.
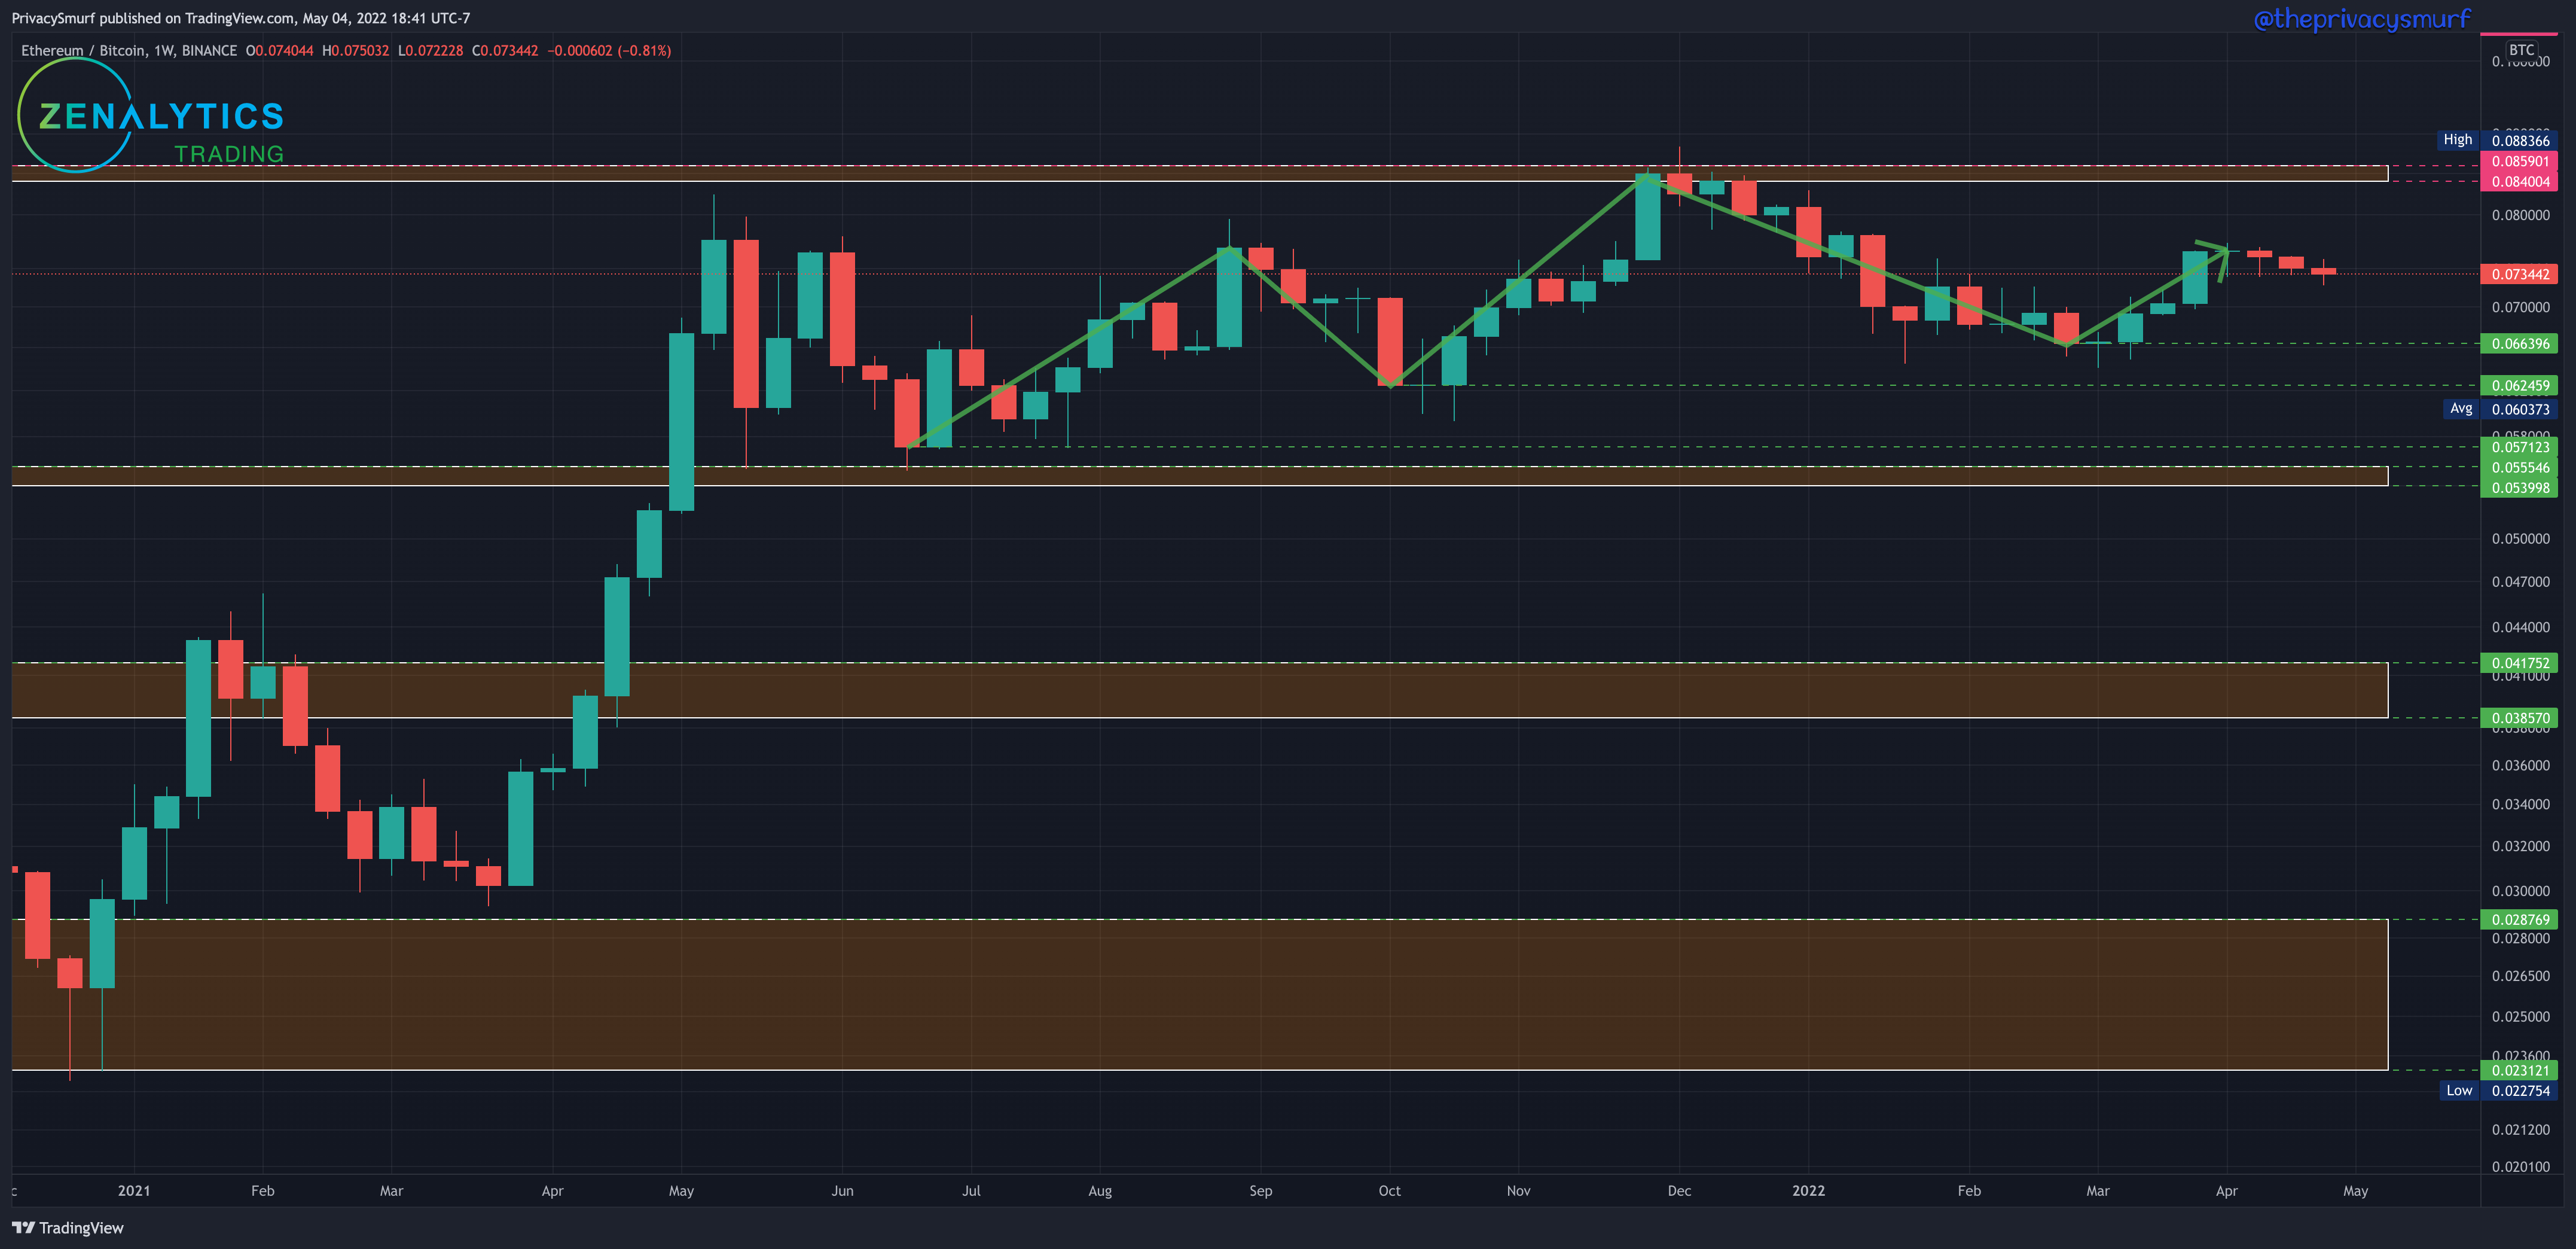
ETH/BTC Daily Chart
https://www.tradingview.com/chart/gTkSjkj6/

Here’s last week’s info.
Price action has been trending down this past week. The RSI bottom band has also moved up to meet the price. A downside break of the bottom band would likely be accompanied by prices trading down into the support zone. I’d expect some support to come in at the 50-Day EMA which is currently at 0.073 but I’d be prepared for prices to move down towards the bottom of the zone at 0.071.
The last few days have shown all the elements of the last posting minus the venture down to the 0.071 mark. With the RSI back inside the adaptive bands while teasing a bullish break over the midline paired with the few bullish hammer candles above the 50-Day EMA I would be looking for ETH to start gaining in value relative to BTC in the near term. Resistance would be likely to show back up again at the 0.076 level. Due to the slow pace of the market recently I wouldn’t be expecting that level to come in quickly but it’s not unreasonable. I’d be planning for consolidation between 0.072 and 0.076.
ETH/USDT Weekly Structure
https://www.tradingview.com/chart/JPTp0aXw/
This week honestly is a repeat of last week AND the last week.
Another bearish week on ETH/USDT. We are still currently trending down to make (hopefully) a higher low. The bullish structure is still maintained unless a weekly close occurs below $2515.
Closing this week presented with about equal wicks to the downside and the upside which would suggest a possible continue of bearish pressure but a potential shift in the following week as support has held for the moment and may gain momentum to the upside. The daily chart will help determine the likelihood of that. (this is slightly cheating as we already know how the week is shaping up, but again, this is just an inner monologue from looking at the chart.)
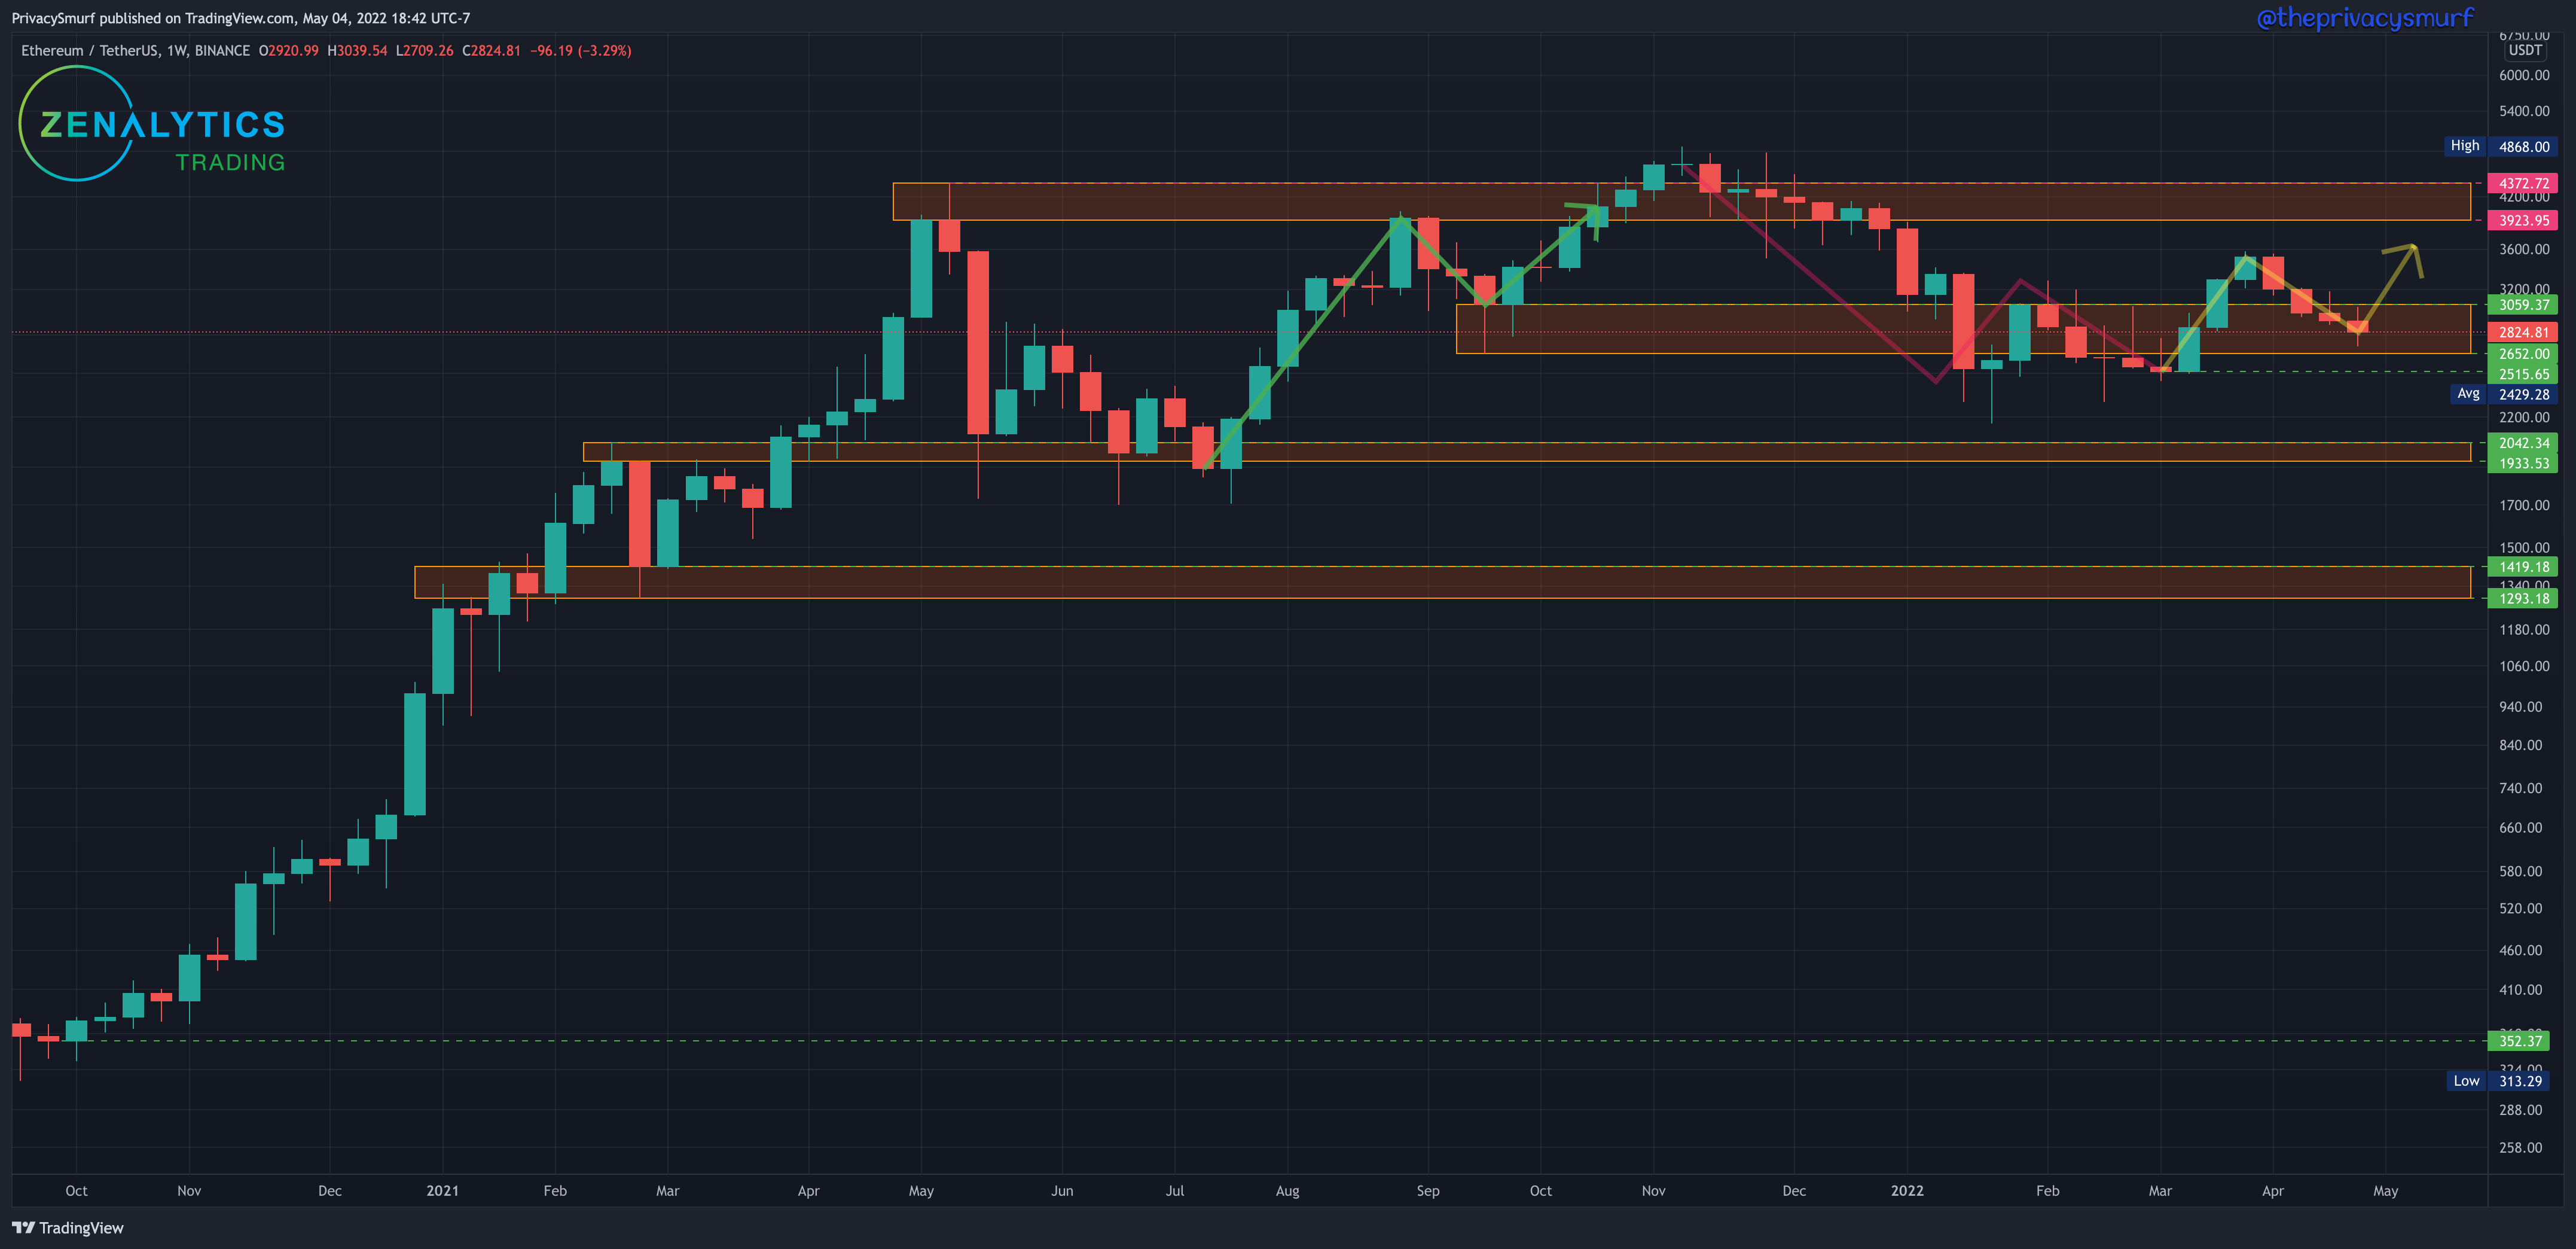
ETH/USDT Daily Chart
https://www.tradingview.com/chart/xbB6lkZu/
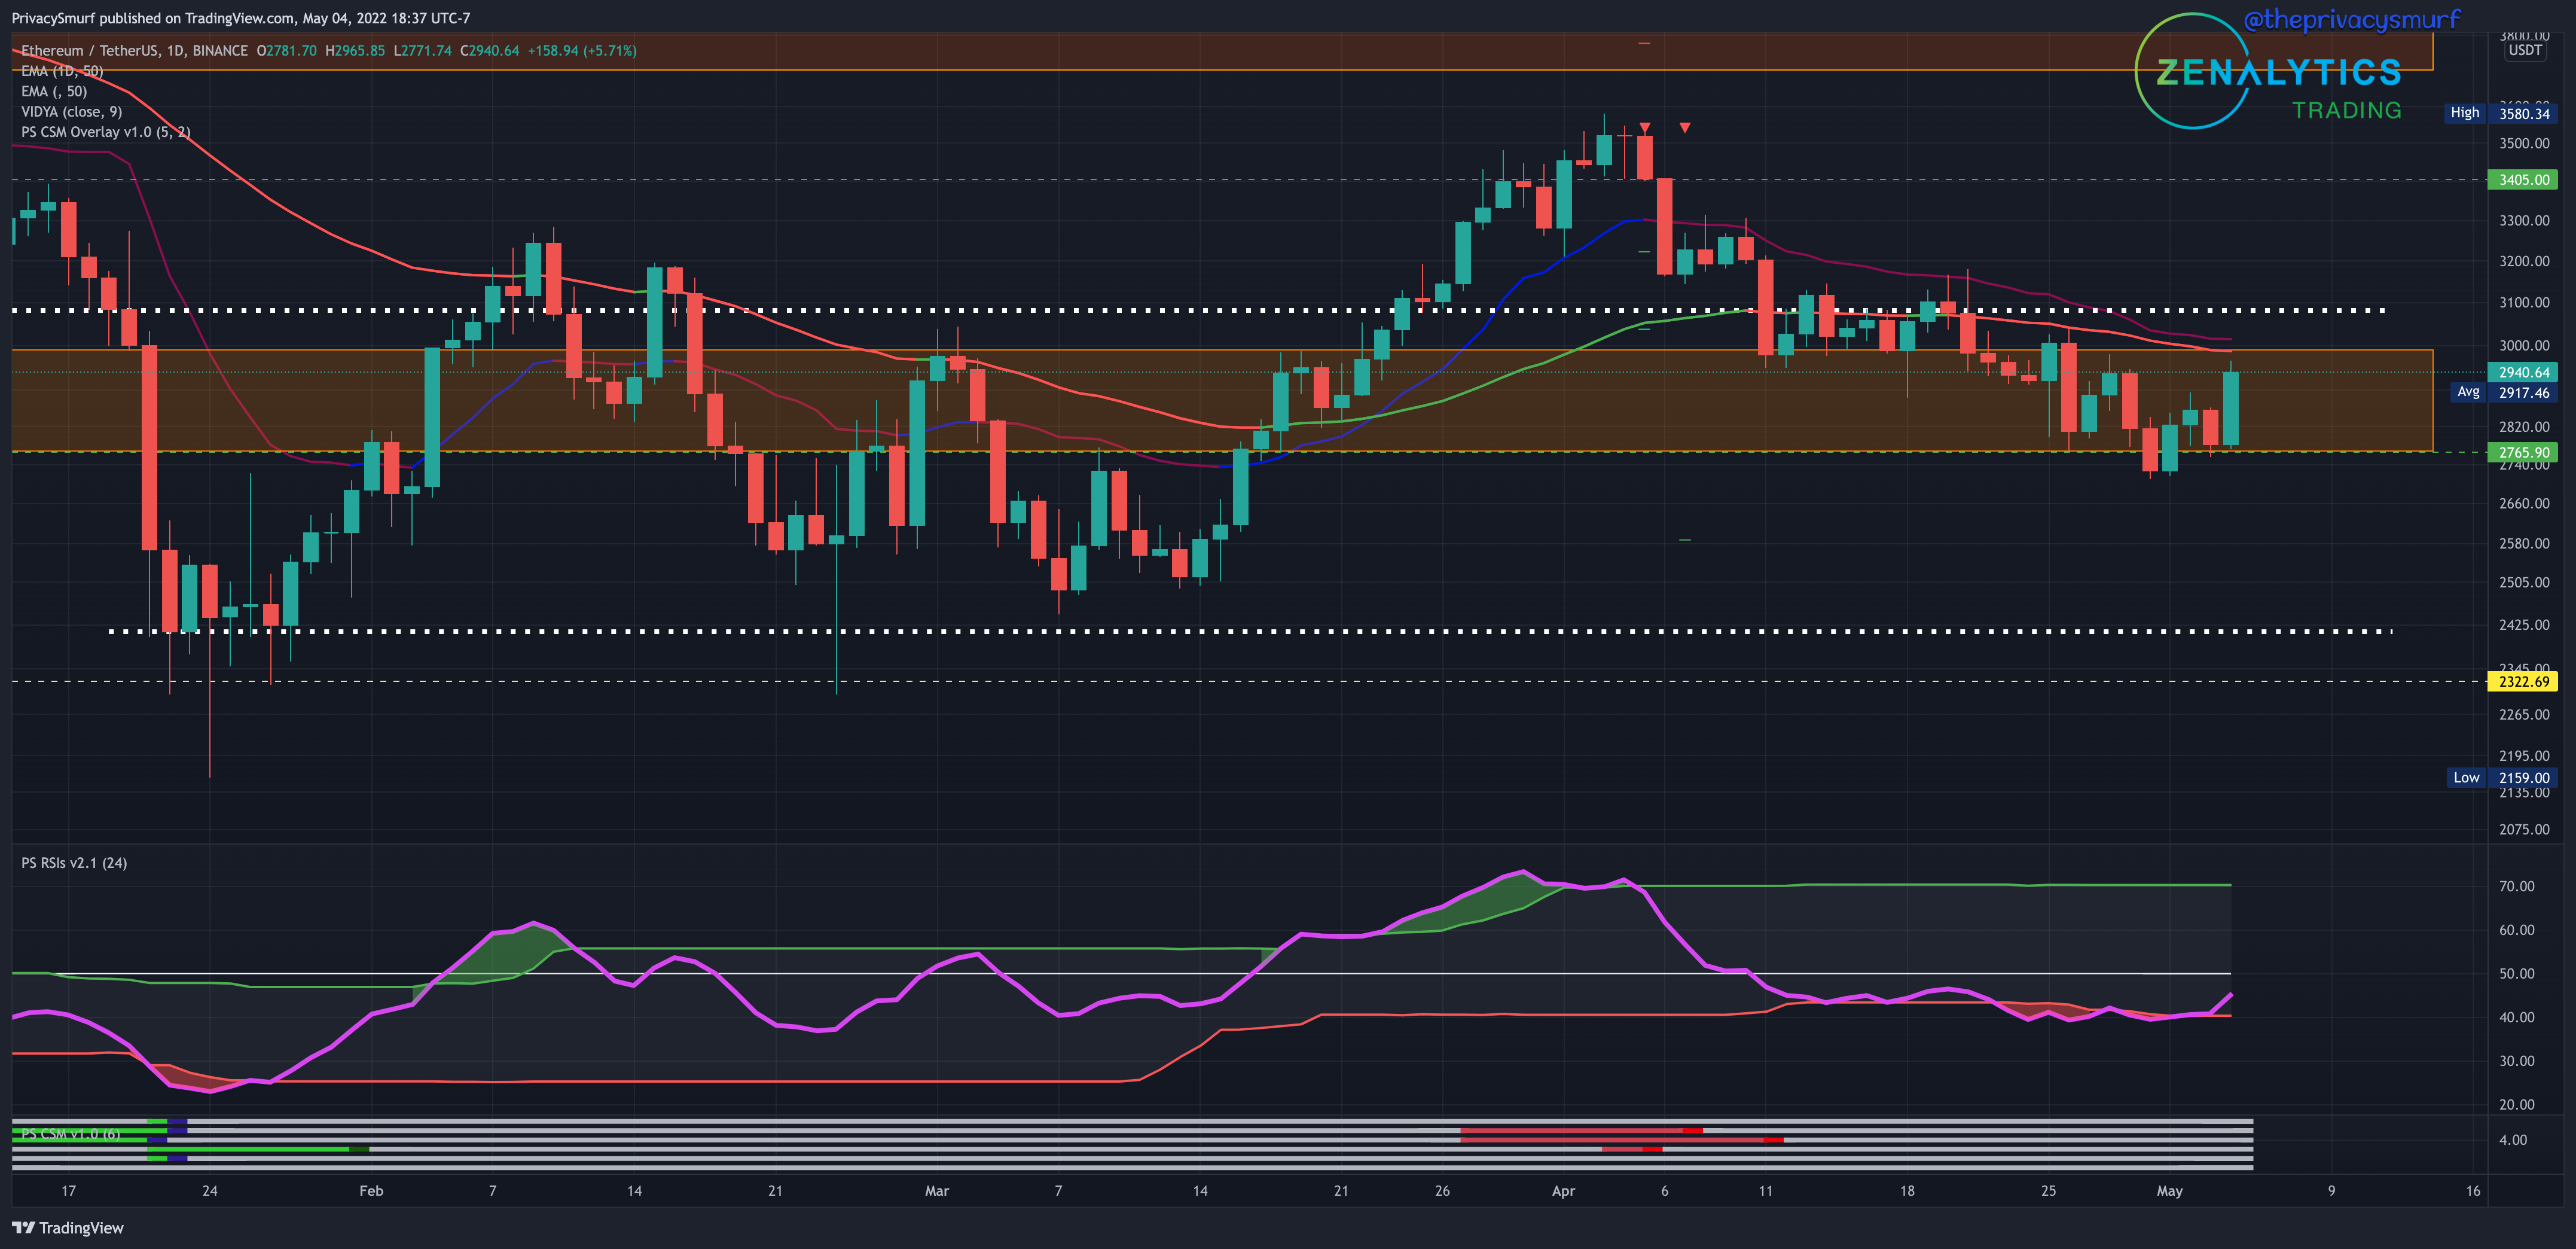
Here’s last week’s info.
The daily trend will still be bullish until the daily closes plot below the last lowest low close at $2890. With the RSI now trading under the bottom band (yellow arrow) I’d be expecting a bearish price continuation early this week. I’m anticipating a floor around $2700 and a ceiling around $3200 same as last week.
We can get technical here on ETH like with the BTC daily chart and call the trend bearish as the price closed under the last lowest close support at $2890. However, the trading range from posts prior at $2700 to $42k is still a valid and expected range. The possibility of wicking under the recent lows on the daily chart is increasing in my opinion. To consider the recent rally a valid return to bullish consolidation a daily close must appear at least above the 50-Day EMA (currently trading just under $3000) but closing above a recent pivot at $3006 on April 25th could be a place to start an argument for shifting momentum favoring the bulls.
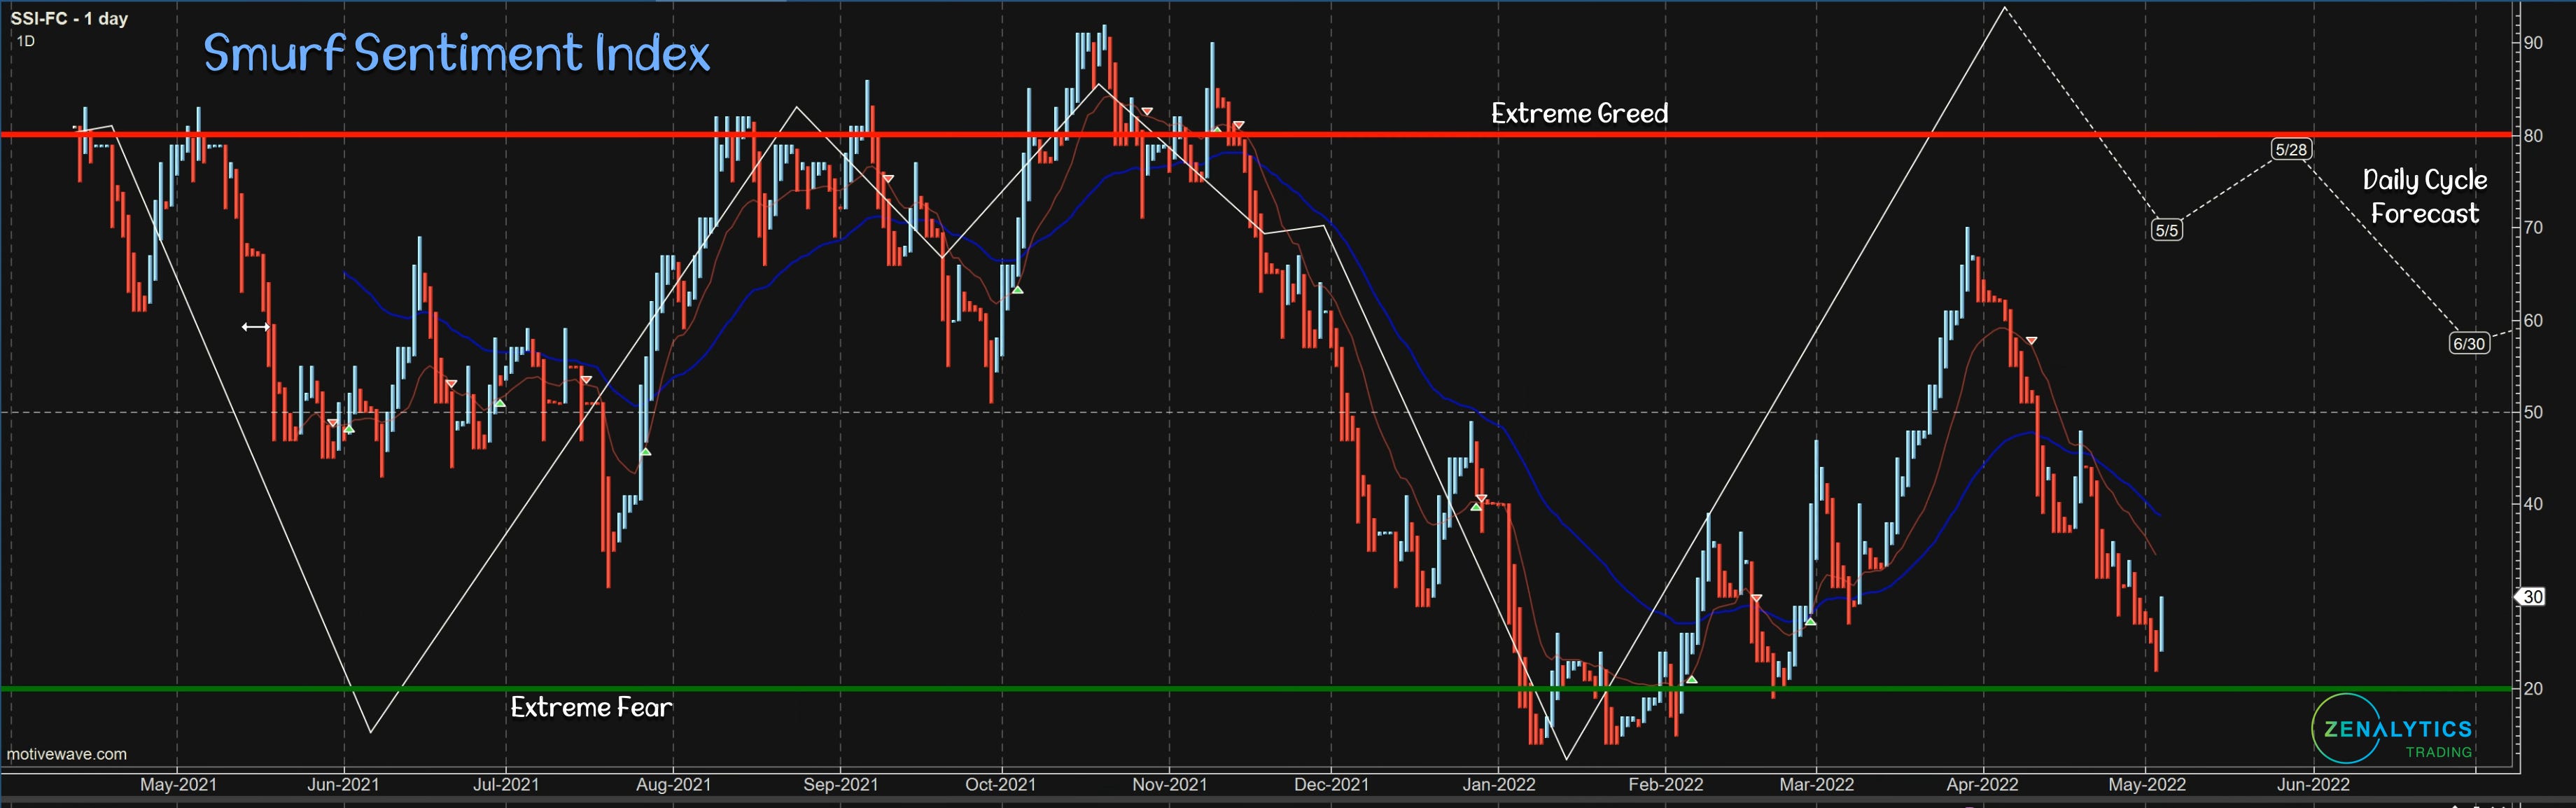
Interesting update. I’ve been mulling over potential flaws in the calculating of cycles when omitting days that have no trading activity (the market is closed). The idea is that the underlying forces that direct the market don’t stop just because trading is frozen. Long-term cycles derived from weekly/monthly/quarterly/yearly charts don’t have non-trading sessions so why assume that just because the weekday trading markets freeze doesn’t mean that the cycles do. What I did was copy the values from the last traded day over until the market was trading again. Doing so presented an interesting update to the custom fear and greed sentiment cycle that I post on Fridays. The prior models we becoming invalidated showing an increase in late April where this one isn’t and is entering its bottoming phase now.
See you soon.
@theprivacysmurf
Thank you Terry and much appreciated for the analysis and sharing you do week in and week out. I miss you and understand that you gots a life too! :) cheers mate!
Thank you for all you do and good on you for enjoying life. I've learned so much and will continue to tap into your knowledge to assist in my own respective crypto journey. You're doing your part to teach folks how to fish, but it sounds like many are just expecting you to feed them day to day. Happy to hear you're enjoying yourself rather than injured or something.