
LTH Supply Dynamics
Who is to blame for the current downturn??

The Narrative vs. The Data
There’s a popular narrative right now: "Long-term holders and whales are selling. That's why Bitcoin is falling."
It sounds logical. Experienced holders taking profits would put downward pressure on the price.
There's just one problem: the data shows the exact opposite is happening.
I’ve discovered a way to illustrate this: LSD. No, not that LSD, it’s what I’m calling the Long-term Holder (LTH) Supply Dynamics.
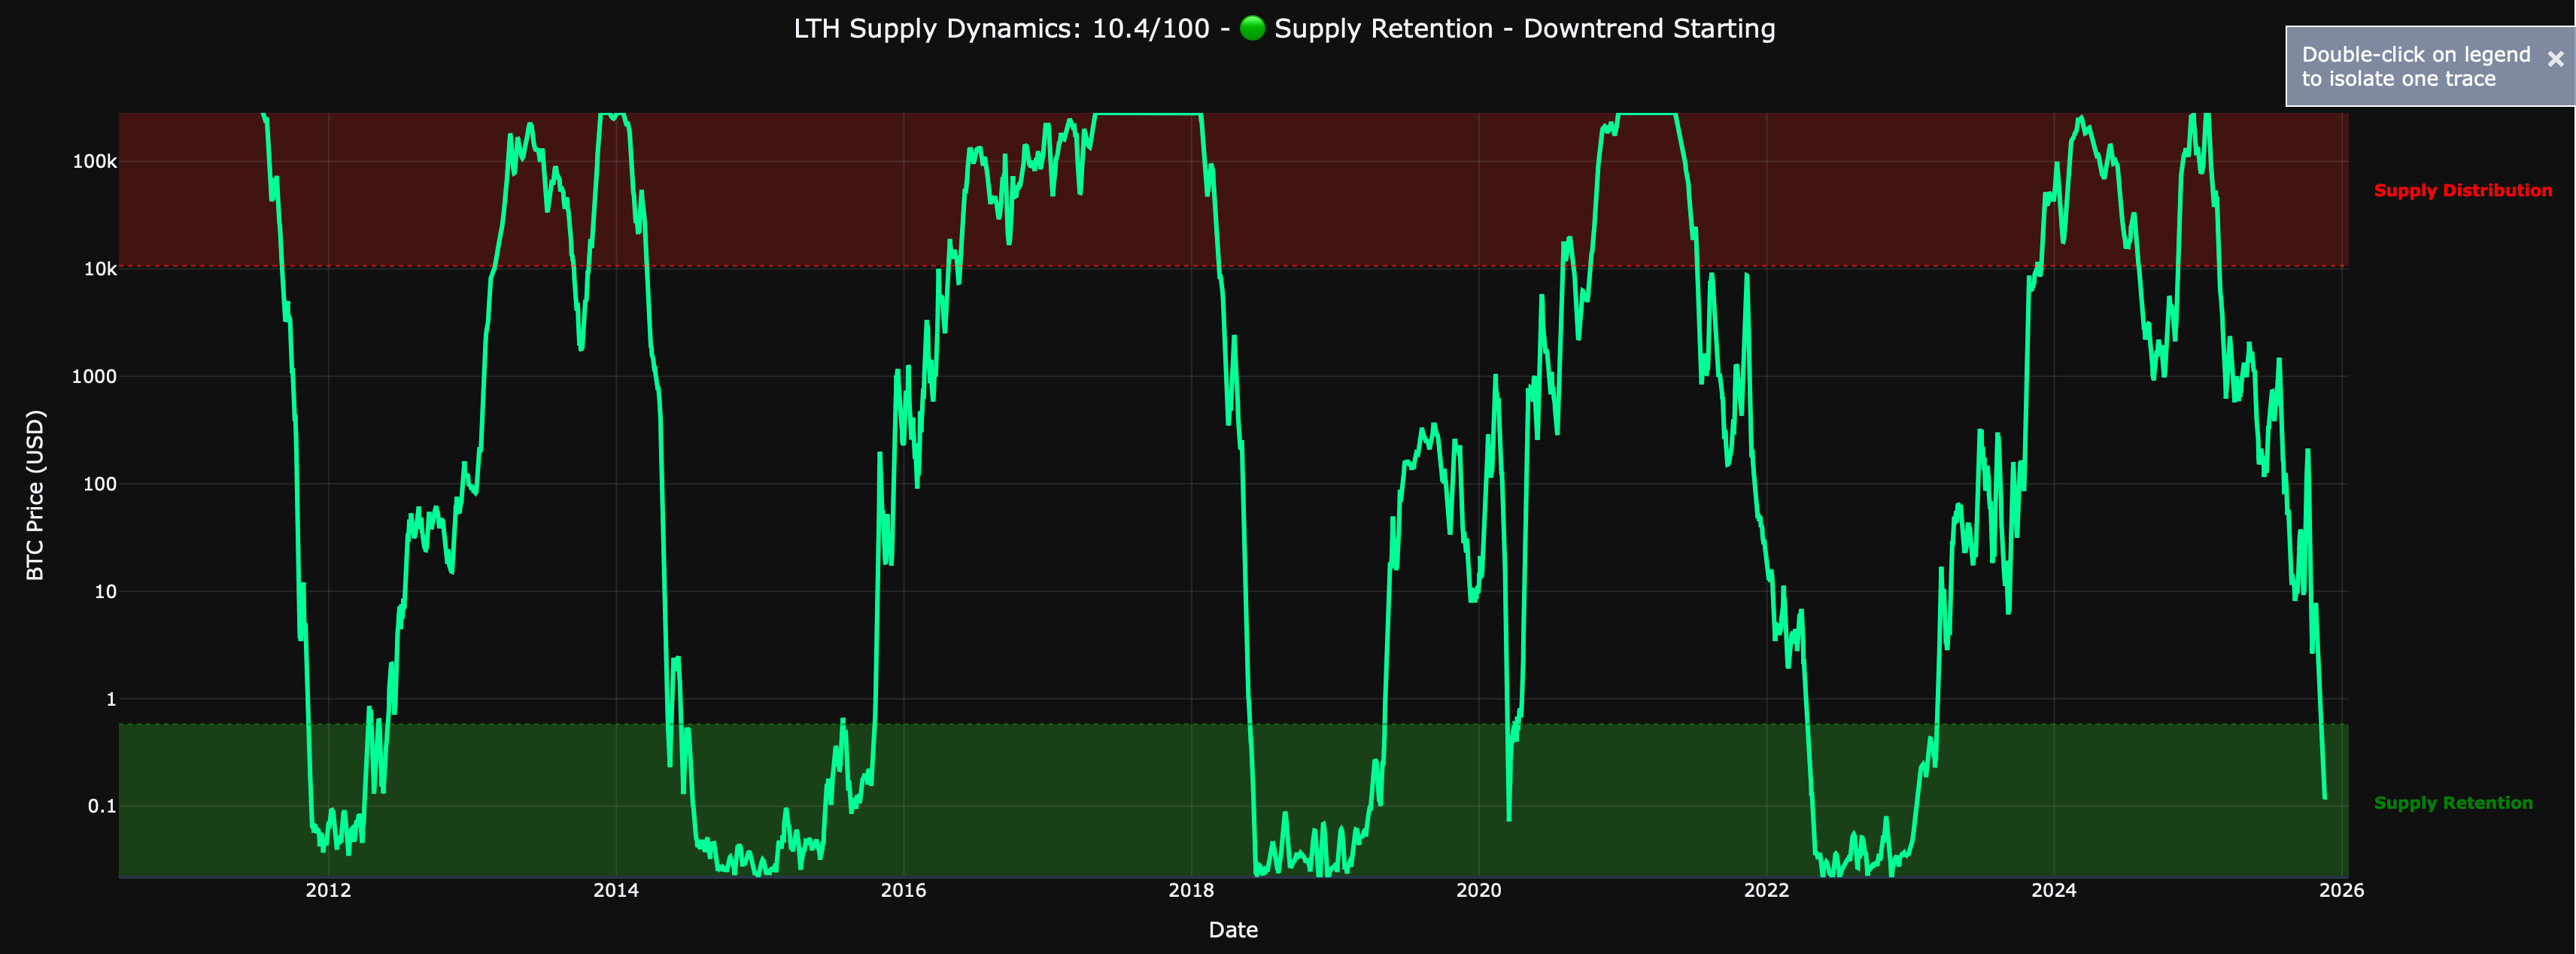
As of November 10, 2025, the LTH Supply Dynamics score crossed down into the Supply Retention zone for the first time since mid-April 2022. This marks a fundamental behavioral shift: Long-Term Holders have stopped distributing and entered retention mode.
LTHs aren't driving this decline. They have been dramatically decreasing sales since February. The pressure is coming from somewhere else entirely.
Click here to skip ahead for the TL:DR.
What This Score Measures
The LTH Supply Dynamics score combines two key on-chain Long-Term Holder behavioral metrics:
1. LTH SOPR (Spent Output Profit Ratio)
Measures the actual profit/loss ratio when LTHs execute sales of coins 6 months or older
The higher the measurement, the more profitable the transactions
The lower the measurement, the less profitable the transaction (could be either low or negative profit)
It’s rare for this to show LTH losses (values below 1) because they are in so much profit.
2. LTH MVRV (Market Value to Realized Value)
Ratio of current market price to LTH cost basis
Shows the unrealized profit available to LTHs
MVRV > 3.0 = Large unrealized profits
MVRV < 1.5 = Near breakeven
The incentive to hold/buy or sell is essentially correlated with this metric.
These metrics alone are useful. But here's where the framework becomes powerful.
The Percentile Construction: Built-In Proof of Reduced Selling
I’ve converted each component to a percentile rank over a 2-year rolling window and then created a weighted index of the two.
What the 10.4 score above actually means:
"If you compared sales on each day, LTH's selling behavior is currently in the bottom 10.4% of the past 2 years."
This isn't an interpretation. It's a mathematical fact.
If LTHs were increasing sales (as headlines would have you believe), the SOPR would rise as more coins moved at a profit. The phase score would climb to 30, 40, 50+. But it's declined since February, proving LTH selling is near the lowest levels in the last 2 years.
Why a 2-year window? Bitcoin cycles show diminishing returns. A 4-year lookback would systematically underweight current-cycle signals by comparing them to the more extreme volatility of previous cycles. The 2-year window adapts to each cycle's characteristics, measuring where we are in THIS cycle's range rather than anchoring to outdated extremes.
The Real Story: Who's Actually Selling?
The disconnect between LTH behavior and recent market price action reveals the source of the selling pressure.
The Evidence:
LTH Supply Dynamics: 10.4 and declining → LTHs have stopped distributing
Regular SOPR: < 1.0 and declining → Someone IS selling at increasing losses
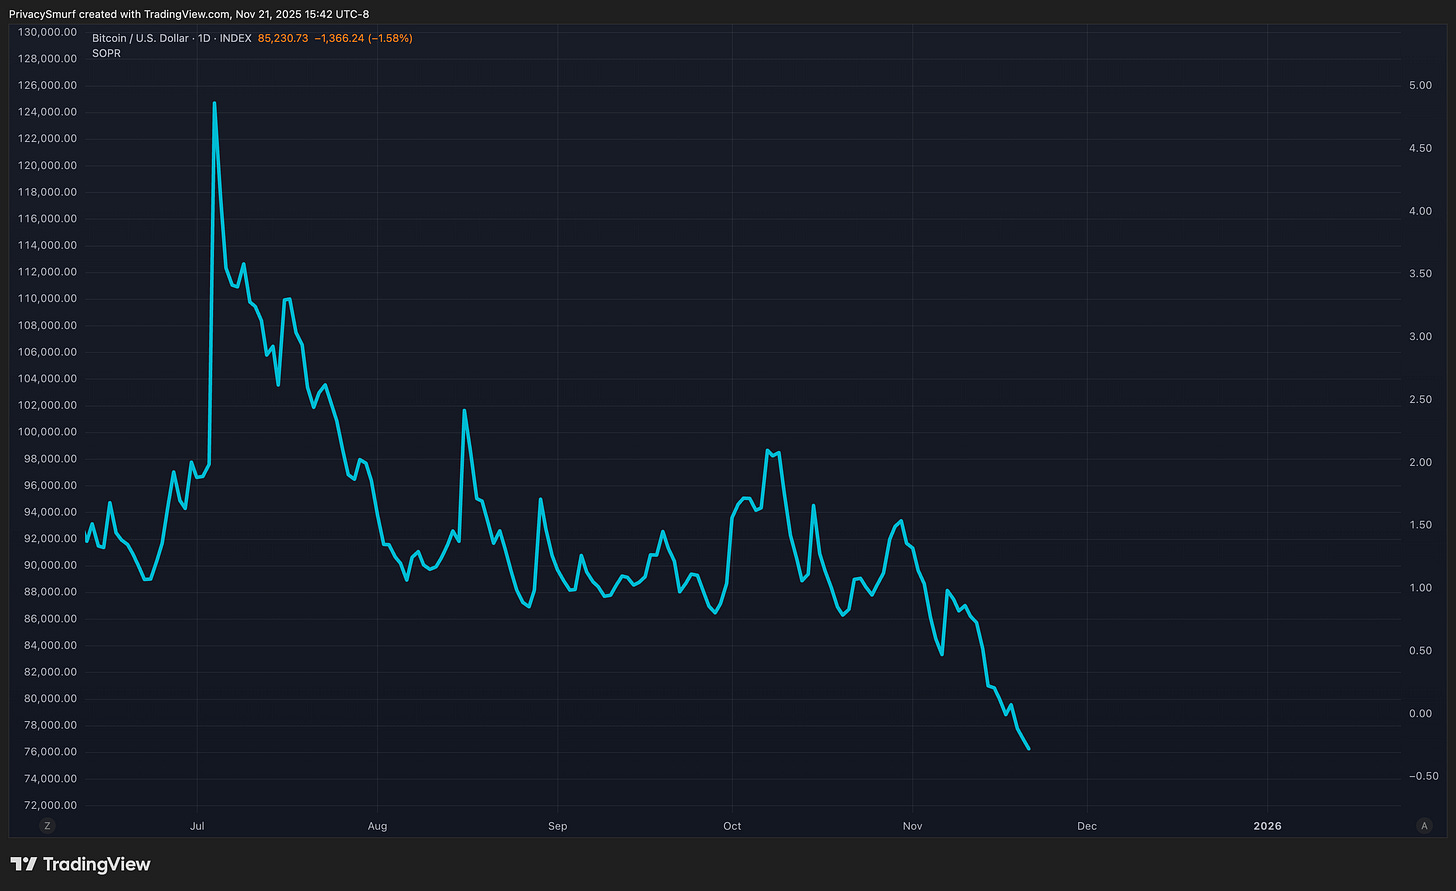
This creates a clear picture: LTHs have unrealized profits (MVRV shows they're well above cost basis). Yet they're not selling (LSD at 10.4 proves it). Meanwhile, someone is panic-selling at increasing losses (SOPR crashing below 1.0).
💡 The sellers aren't old holders taking profits. They're recent buyers who got trapped at higher prices and are now capitulating. LTHs have gone silent. They're watching, waiting to either buy lower or sell higher, not getting rid of their supply right now.
The Behavioral Shift: 2023 - 2025 Bull Market
Whales and LTHs sell during market strength, not weakness. This ensures the market doesn’t drop quickly when they make large transactions.
Exit From Distribution = Beginning of the End
Here's the sequence that marks cycle tops:
First, LTHs start selling (score climbs to 80-100). Price keeps rising because new buyers absorb the supply, thinking the market will go up forever.
Then, LTHs finish their distribution (score falls below 80). Suddenly, there's no one left willing to sell to the late buyers.
Buying pressure evaporates. The correction begins.
Watch how the LSD reveals a progressive increase and withdrawal of LTH selling pressure over the current bull market:
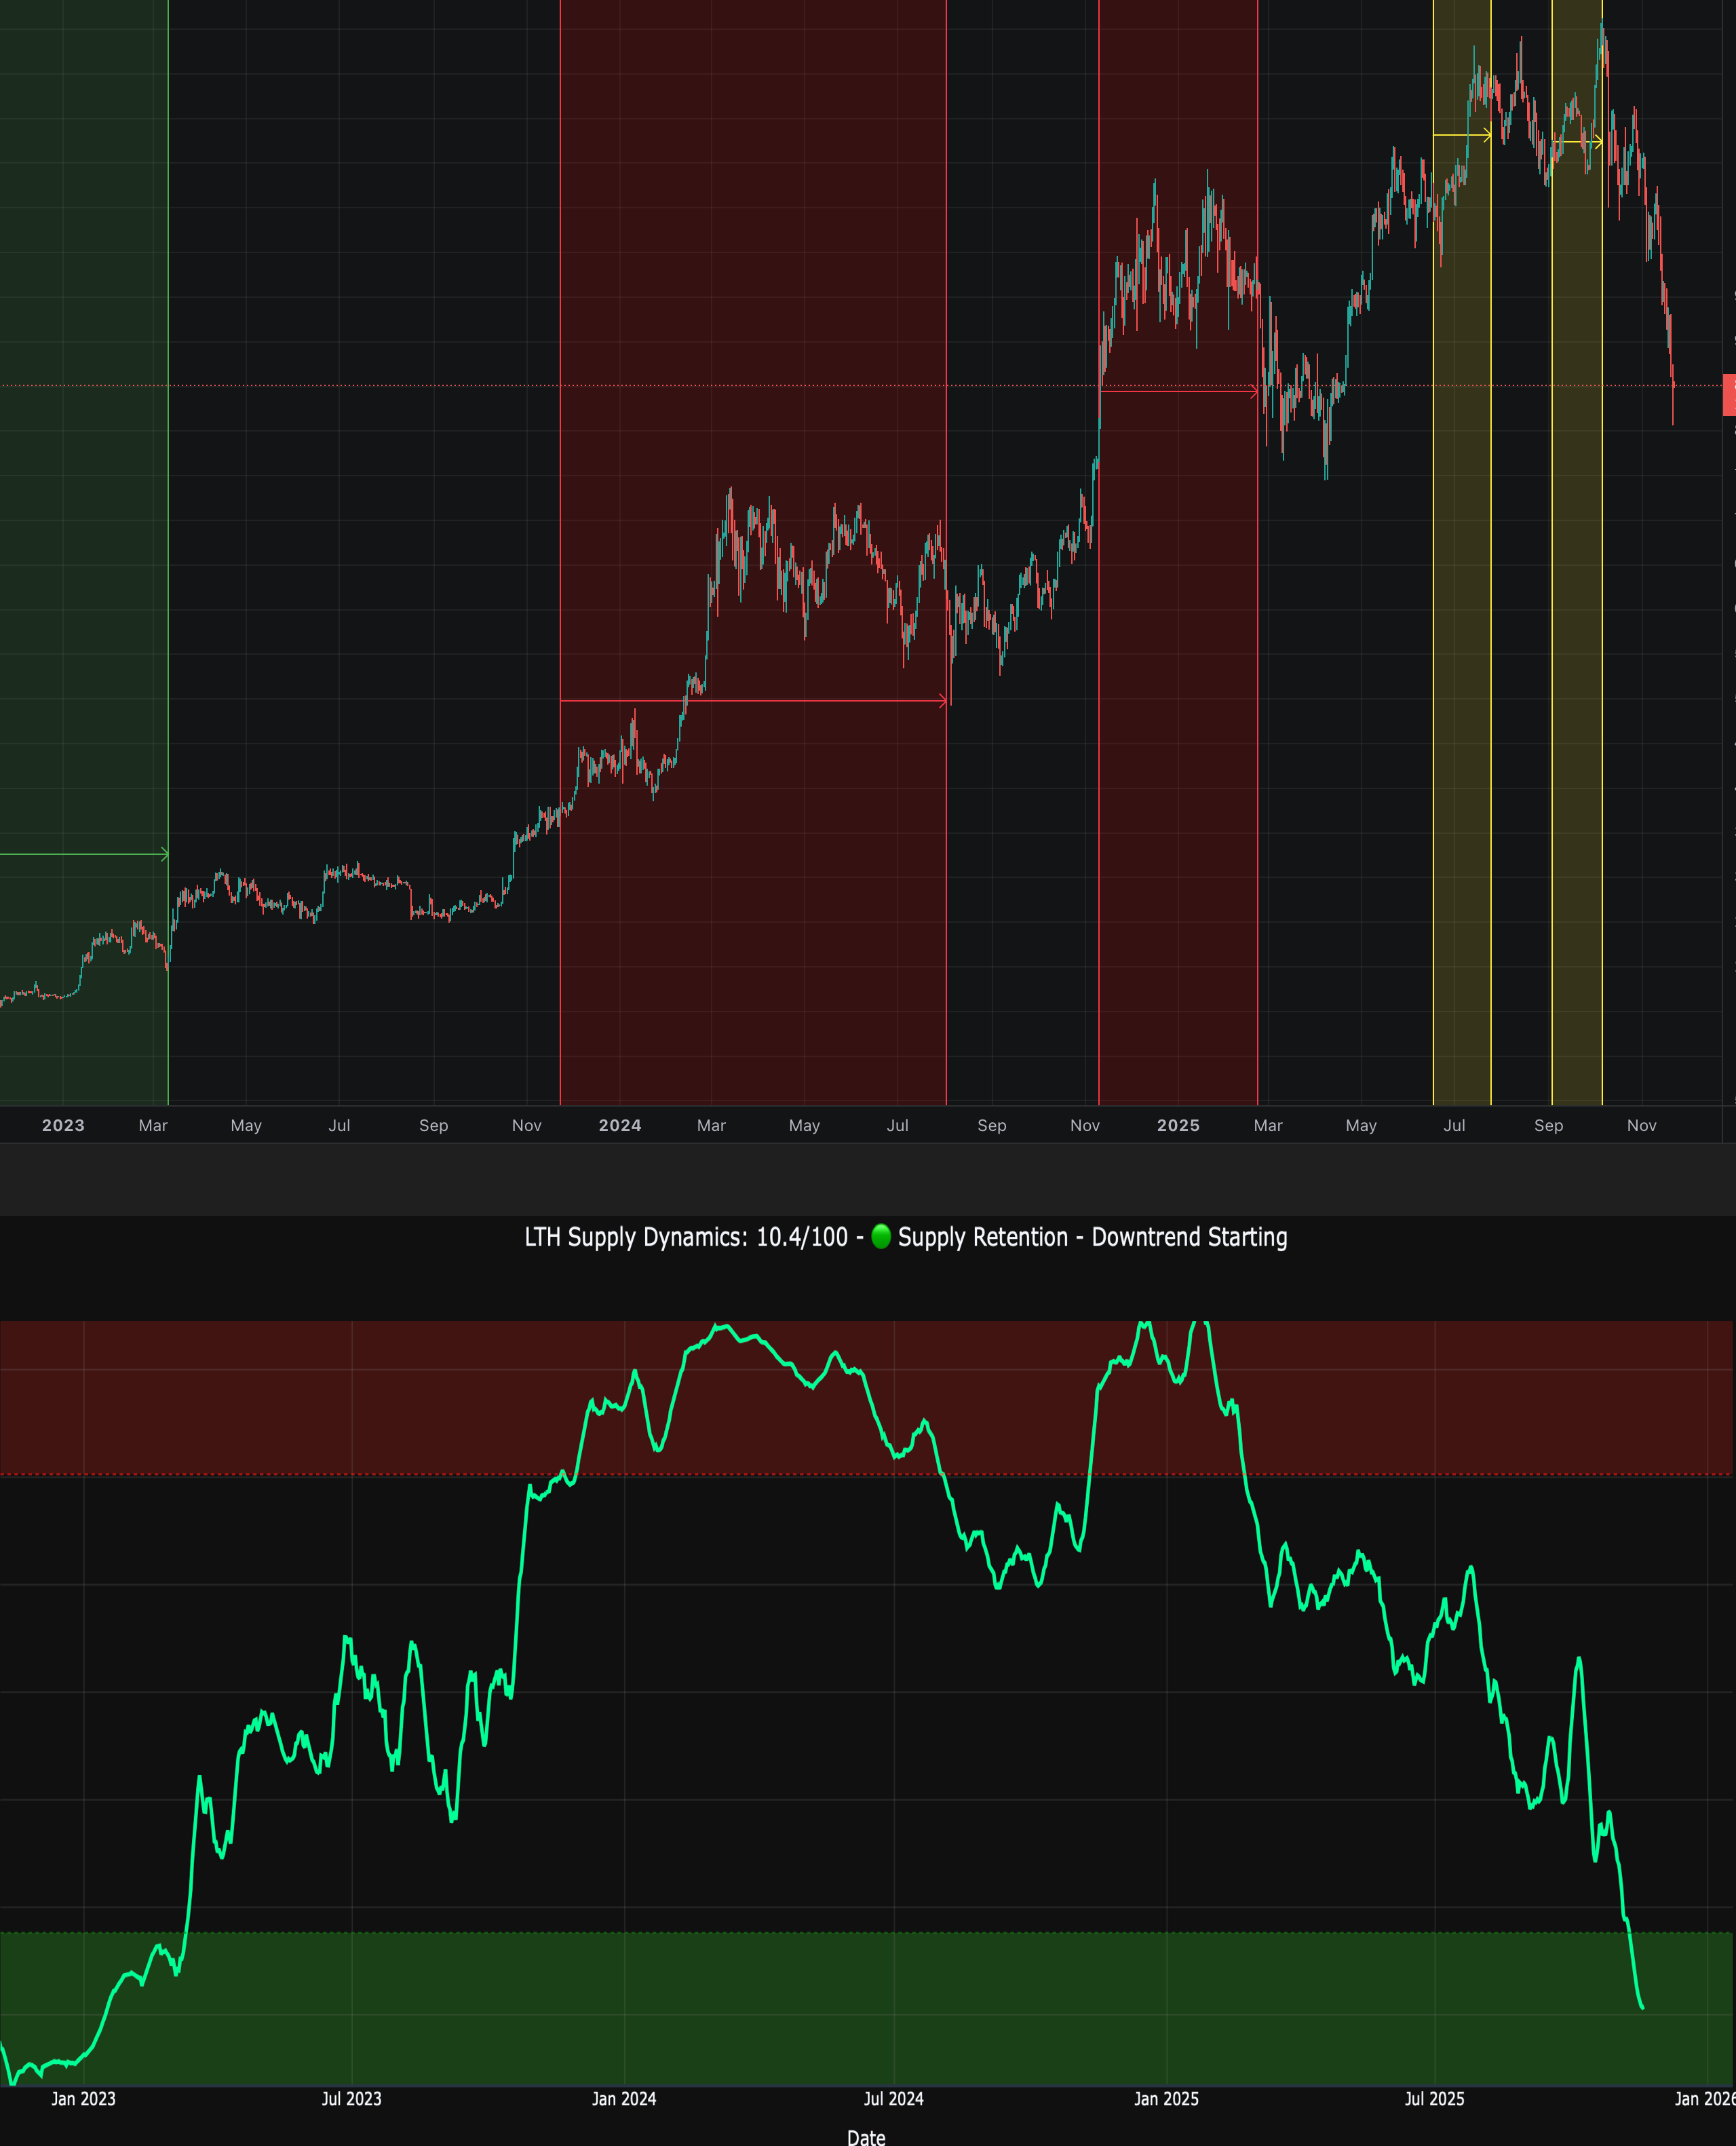
At the beginning, around the 2022/2023 turn, LTHs were waiting patiently for the moment to act.
From Dec 2023 to Jul 2024, LTH dynamics rose into the distribution zone. Price action in this window corresponded with BTC moving above the final broken support of the prior bull market and extended through the first new ATH.
Selling pressure declined after the new ATH, eventually falling out of the distribution zone by Aug 2024.
LTHs began distributing again in Nov 2024 as BTC broke above $85K and reached peak distribution, with the price setting a new ATH ~$104K in late Jan 2025.
Despite prices later rallying into the $120K region, LTH profit-taking largely declined, with only minor increases in selling in July and September 2025.
Since October and the final BTC ATH, LTHs have drastically reduced selling pressure. By early November, despite prices still being above the $100K mark, they had withdrawn from distribution.
The key insight: LTHs exited distribution mode BEFORE the recent selloff intensified. They're not the sellers. They're the sidelined capital waiting for the next move.
Historical Pattern: Supply Retention = Bottoms
The pattern of LTHs withdrawing from selling is essential to recognize when a top may be in, and the inverse is key to finding when we may be bottoming.
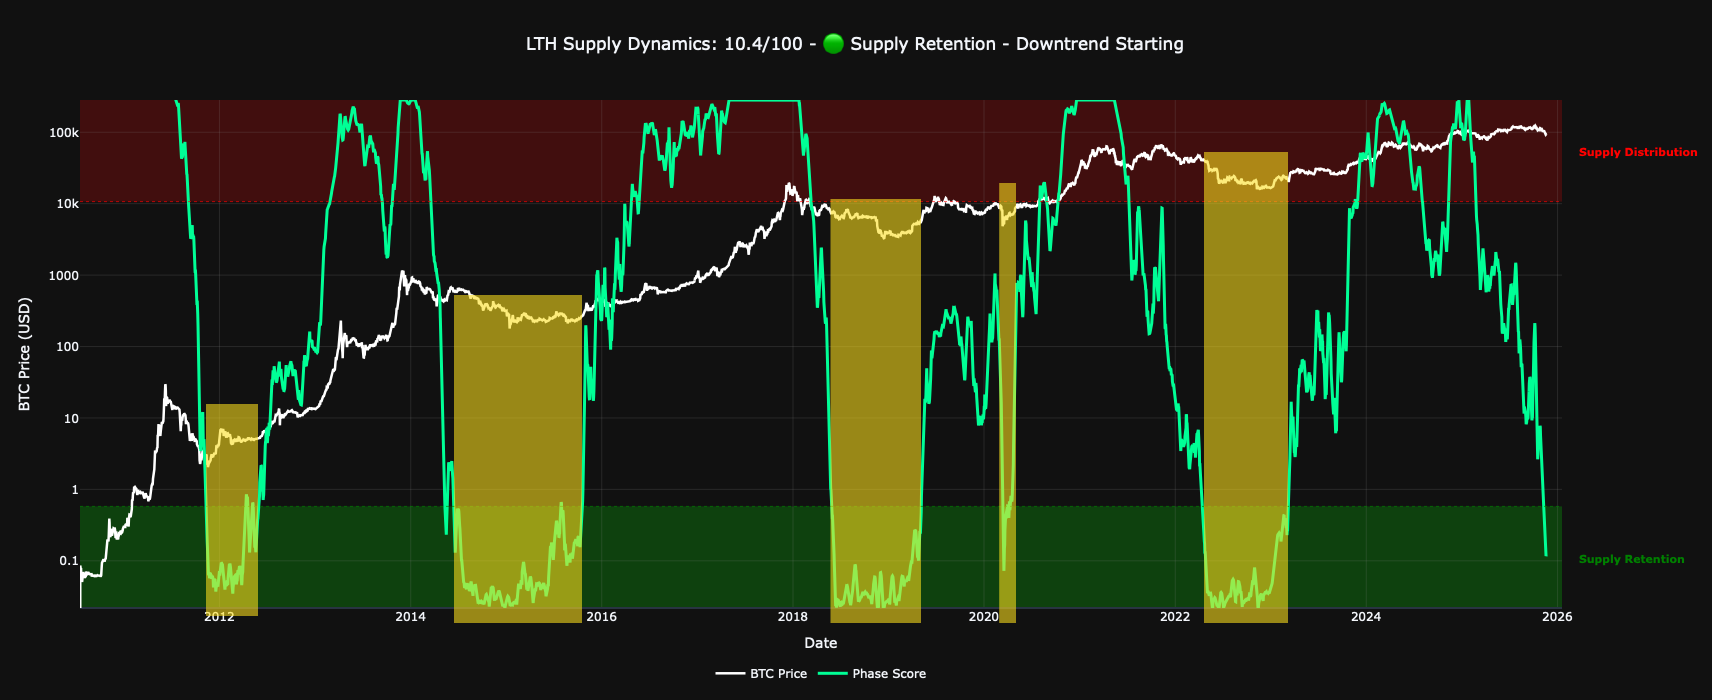
Bottom Threshold Entries
Above, I’ve added the BTC closing prices and highlighted each time the score enters the Supply Retention zone. It has confirmed every major Bitcoin cycle bottom since 2011.
When the score crosses below 20 and enters the green Supply Retention zone, it signals LTHs have stopped selling and/or are accumulating. It’s one and/or the other because it can’t be determined from this metric specifically. I’d have to add other metrics to determine which action is taking place definitively. It’s not really necessary, though, to know. Why is irrelevant.
The Reversal Pattern
Historical bottoms show a consistent sequence:
Score enters Supply Retention zone (< 20)
Score reaches an extreme low (typically 3-10 range)
Score begins to rise, indicating increasing LTH profitability.
Departure from the bottom zone typically occurs after a price decline, with a price breakout from a period of ranging prices.
We're currently between steps 2 and 3. The score continues to decline, hitting 7.3 as of Nov 20, 2025.
Current Market Context
Supply Retention Score:
Deep in the Supply Retention zone
LTHs have withdrawn from selling
Lowest reading since early bull market on Jan 12, 2023 ($18.9K closing BTC price)
SOPR: < 1.0 and declining
Transactions are increasingly executed at a loss
Capitulation from ATH buyers, not LTH profit-taking
Even if there was LTH profit-taking, it does not outweigh STH’s losses
This is a classic bottoming structure that has preceded every major Bitcoin bull run:
✓ LTHs withdraw from distribution (Score under 20)
✓ Weak hands capitulate (SOPR < 1.0)
What to Watch:
1. Supply Retention Score Reversal
Watch for: A sustained rise in the score would confirm that LTHs are shifting from the sidelines. Based on history, if there isn’t a rise out of the zone in 3-4 weeks, we should be prepared for an extended crypto winter that can linger for the better part of a year.
2. SOPR Stabilization
Watch for: SOPR finding a floor and beginning to recover. When capitulation selling exhausts, SOPR typically stabilizes and begins rising back toward 1.0. This would confirm that weak hands have finished selling.
These two need to occur in tandem to be a reliable indication.
TL:DR
The claim that "long-term holder selling is driving Bitcoin lower" doesn't match the data.
The LTH Supply Dynamics score provides proof that LTH's sales rank in the bottom 10.4% over the past 2 years. They have shifted from Supply Distribution and entered Supply Retention mode.
Meanwhile, the SOPR below 1.0 shows the real source of selling pressure: capitulation from recent buyers exiting at increasing losses.
This behavioral split (LTHs holding while new holders capitulate) has marked every major Bitcoin cycle bottom since 2011. If this follows historical precedent, we're witnessing the formation of another significant cycle bottom. Observing these metrics over the next few weeks will shed light on how long bottoming may take.
Don’t leave without clicking here to read what you need to know and watch for.
@ThePrivacySmurf