


#133: Crypto is still hanging on...
BTC... Why you wanna do me like that?

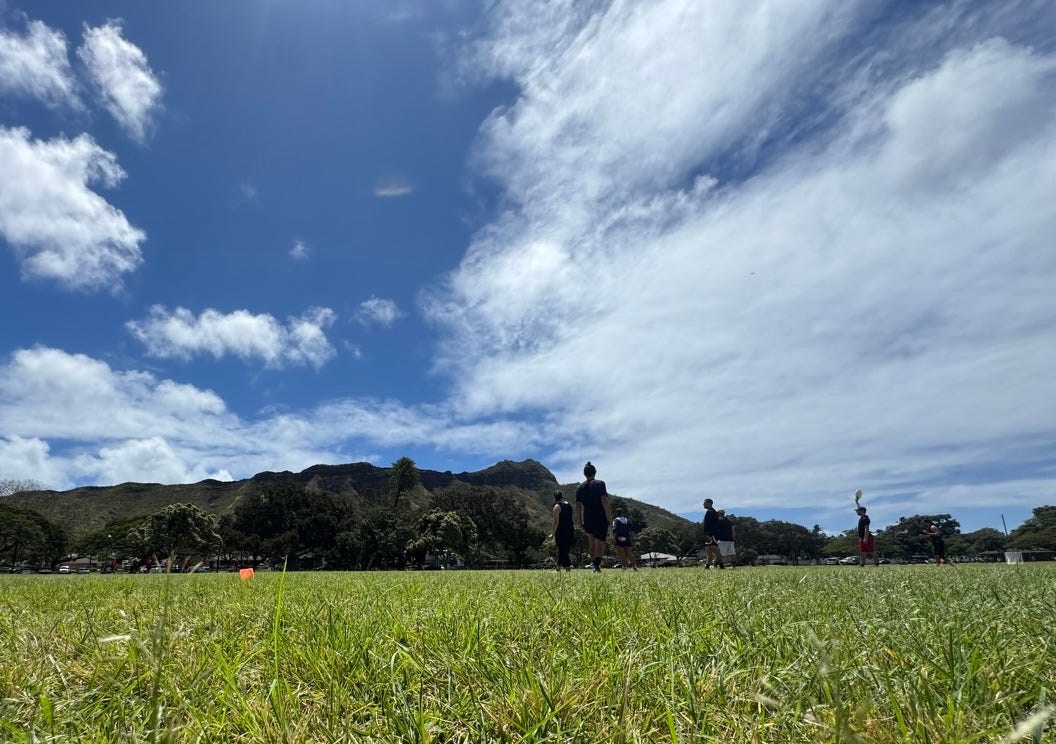
BTC hit me at my leverage invalidation point, so I’m out of that, but I still have a spot trade open. In the meantime, I’m on Oahu visiting my partner’s long-time buddy. I got to play some ultimate frisbee with an AMAZING backdrop.
ANALYSIS TL;DR
The market has a bearish daily structure. Market participants are increasing their exposure to BTC, while ETH and ALTs have taken a hit. I have a BTC spot entry from $78K. I’m also entertaining ALT positions on breakouts.
Bullish trades are a moderate risk from my perspective since we have a bearish price structure, but being closer to supports than resistances creates a better risk-to-reward ratio, and technicals are all in favor of bullish trades now.
Any bullish trade execution I entertain is with the expectation that the bull market will continue until the end of the quarter and maybe one month beyond, when I will start looking for signs to exit. If I had to put entering the market now in stoplight terms for longs:

BTC: Green Light
I’m already in a medium-term bullish position with BTC at around $78K. The invalidation point for spot is closing below prior highs at $72K. I’m not anticipating a new ATH, but I will happily take that.
ETH & ALTs: Green Light
I’m still not looking for dip-buying opportunities on ETH and ALTs despite “low” prices, with BTC dominance still indicating the potential for a harsher downside on ALTs in the event of a pullback. However, I’m actively hunting breakout trades with a price structure where I can rationally place a tight stop. This would be ideally a spot position, but entering a small-levered long isn’t out of the question. I have a couple of open positions now and plenty of room for more.
Where are we now?
The bull market is still going, and the local bottom has been technically confirmed. I’m not certain we’ll see much more than a bear market rally, but that’s impossible to ascertain. The market’s appetite for exposure is building for all assets while prices are “low.” The retail sentiment is bearish but stabilized above extreme fear. We are still in the timing window critical moment for a pivot, and daily chart technicals support the notion of a turnaround, but the longer it takes to move up, the lower that rally may be before we turn down again.
What is the plan?
SHORT-TERM BTC
Blending the precision of mathematical models with the artful subjectivity of technical analysis, statistical projections suggest BTC’s Sunday closing price will likely range between $79.1K and $86.6K.
The closing price for the week landed outside the Max Expected Closing Range on Sunday (less than 1.4%), bringing the total to twelve out of twenty-four (50% accuracy). I described how these ranges are created in the ANALYZE section.
Focusing on the technicals, the RSI is above the midline, suggesting continued bullish influence. It is also above the top adaptive band, which suggests we see bullish, impulsive price action. Also, two weeks ago, we got a second bullish divergence trade signal confirmation with the initial target at around $94K.
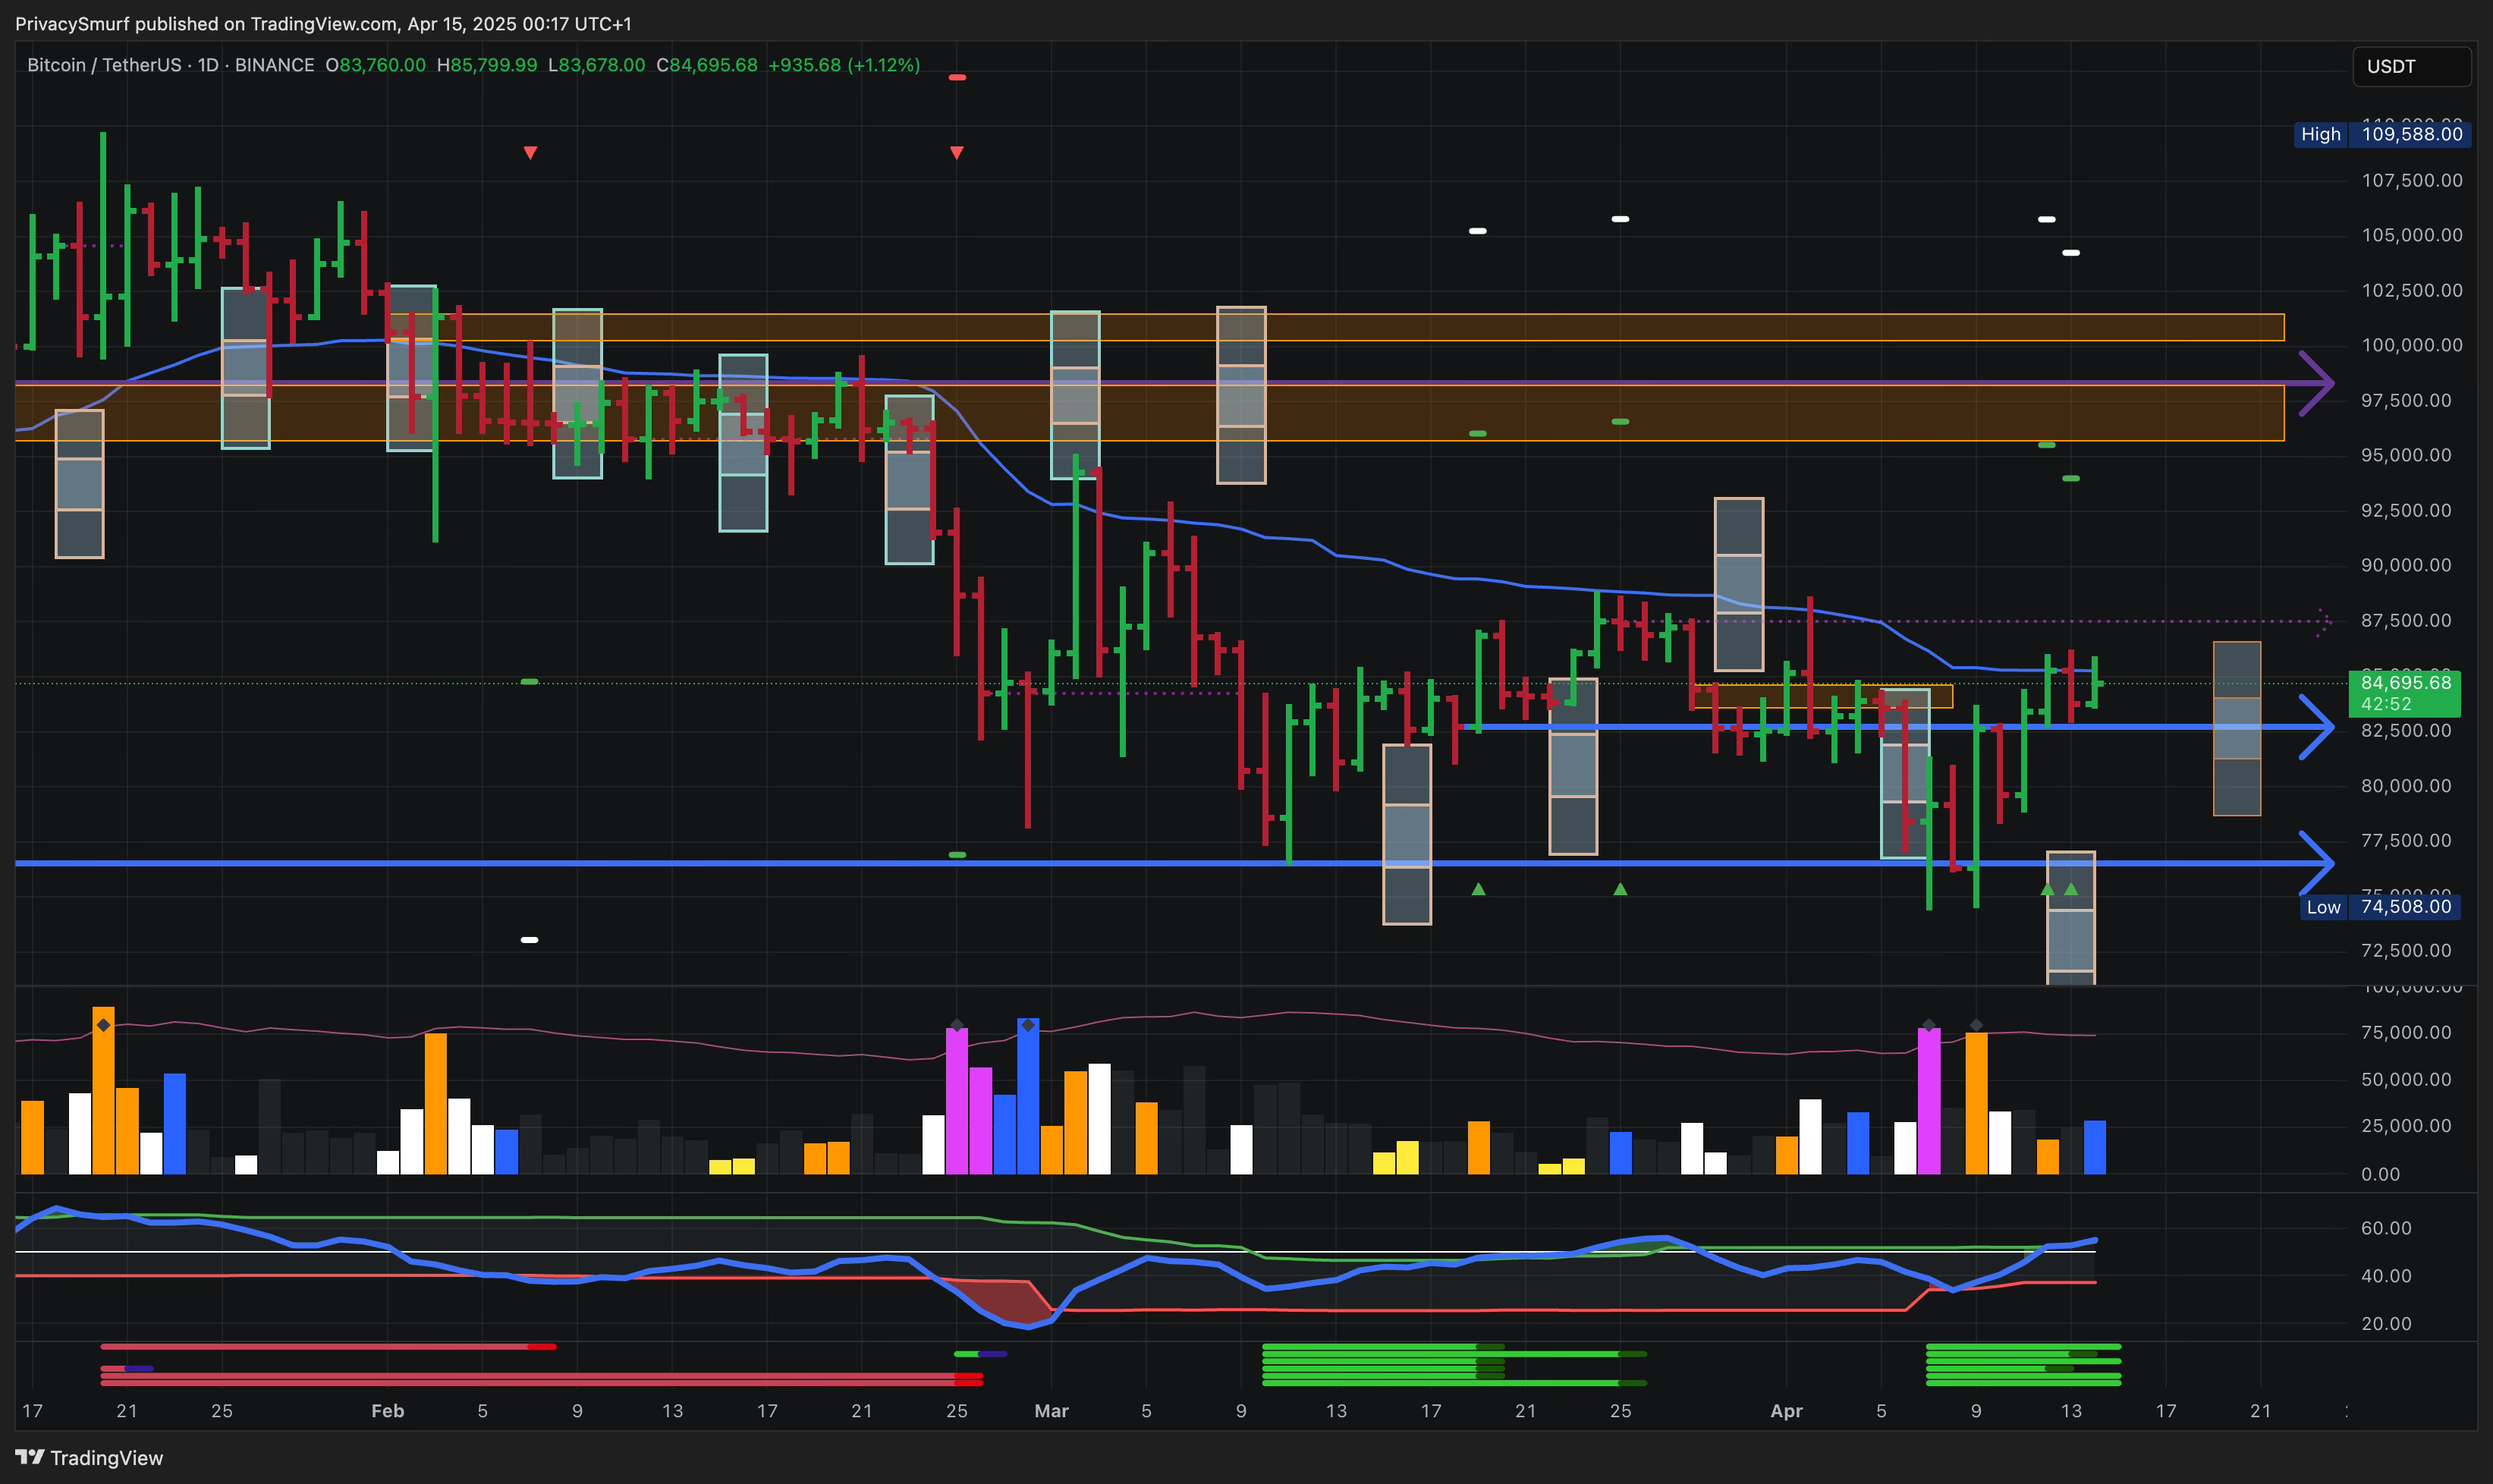
My existing BTC spot position, established at $78,000, remains open, while I closed my leveraged long position for a slight loss at the close under 76K. I haven’t opened a new levered position yet but will evaluate one soon. These positions are/will be targeting profit levels derived from the divergence trade signal. However, I will assess technicals in the $90K—$92K range to determine if I need to skim some profits early. I remain less confident that we'll see a new all-time high (ATH) before the end of the quarter or that we may see one on the next rally.
SHORT-TERM ETH & ALTs
Stats suggest ETH’s Sunday close will range between $1435 and $1770.
On Sunday, the closing price for the week was outside the Max Expected Closing Range, bringing the total to eleven out of twenty-three (47.8% accuracy). Research continues to establish reliable assumptions for technical metrics related to ETH.
Focusing on the technicals, the RSI is below the midline, suggesting continued bearish influence. The bullish divergence trade signal remains with the initial target at around $2450. The near future may bring a second consectuive signal with a lower target.
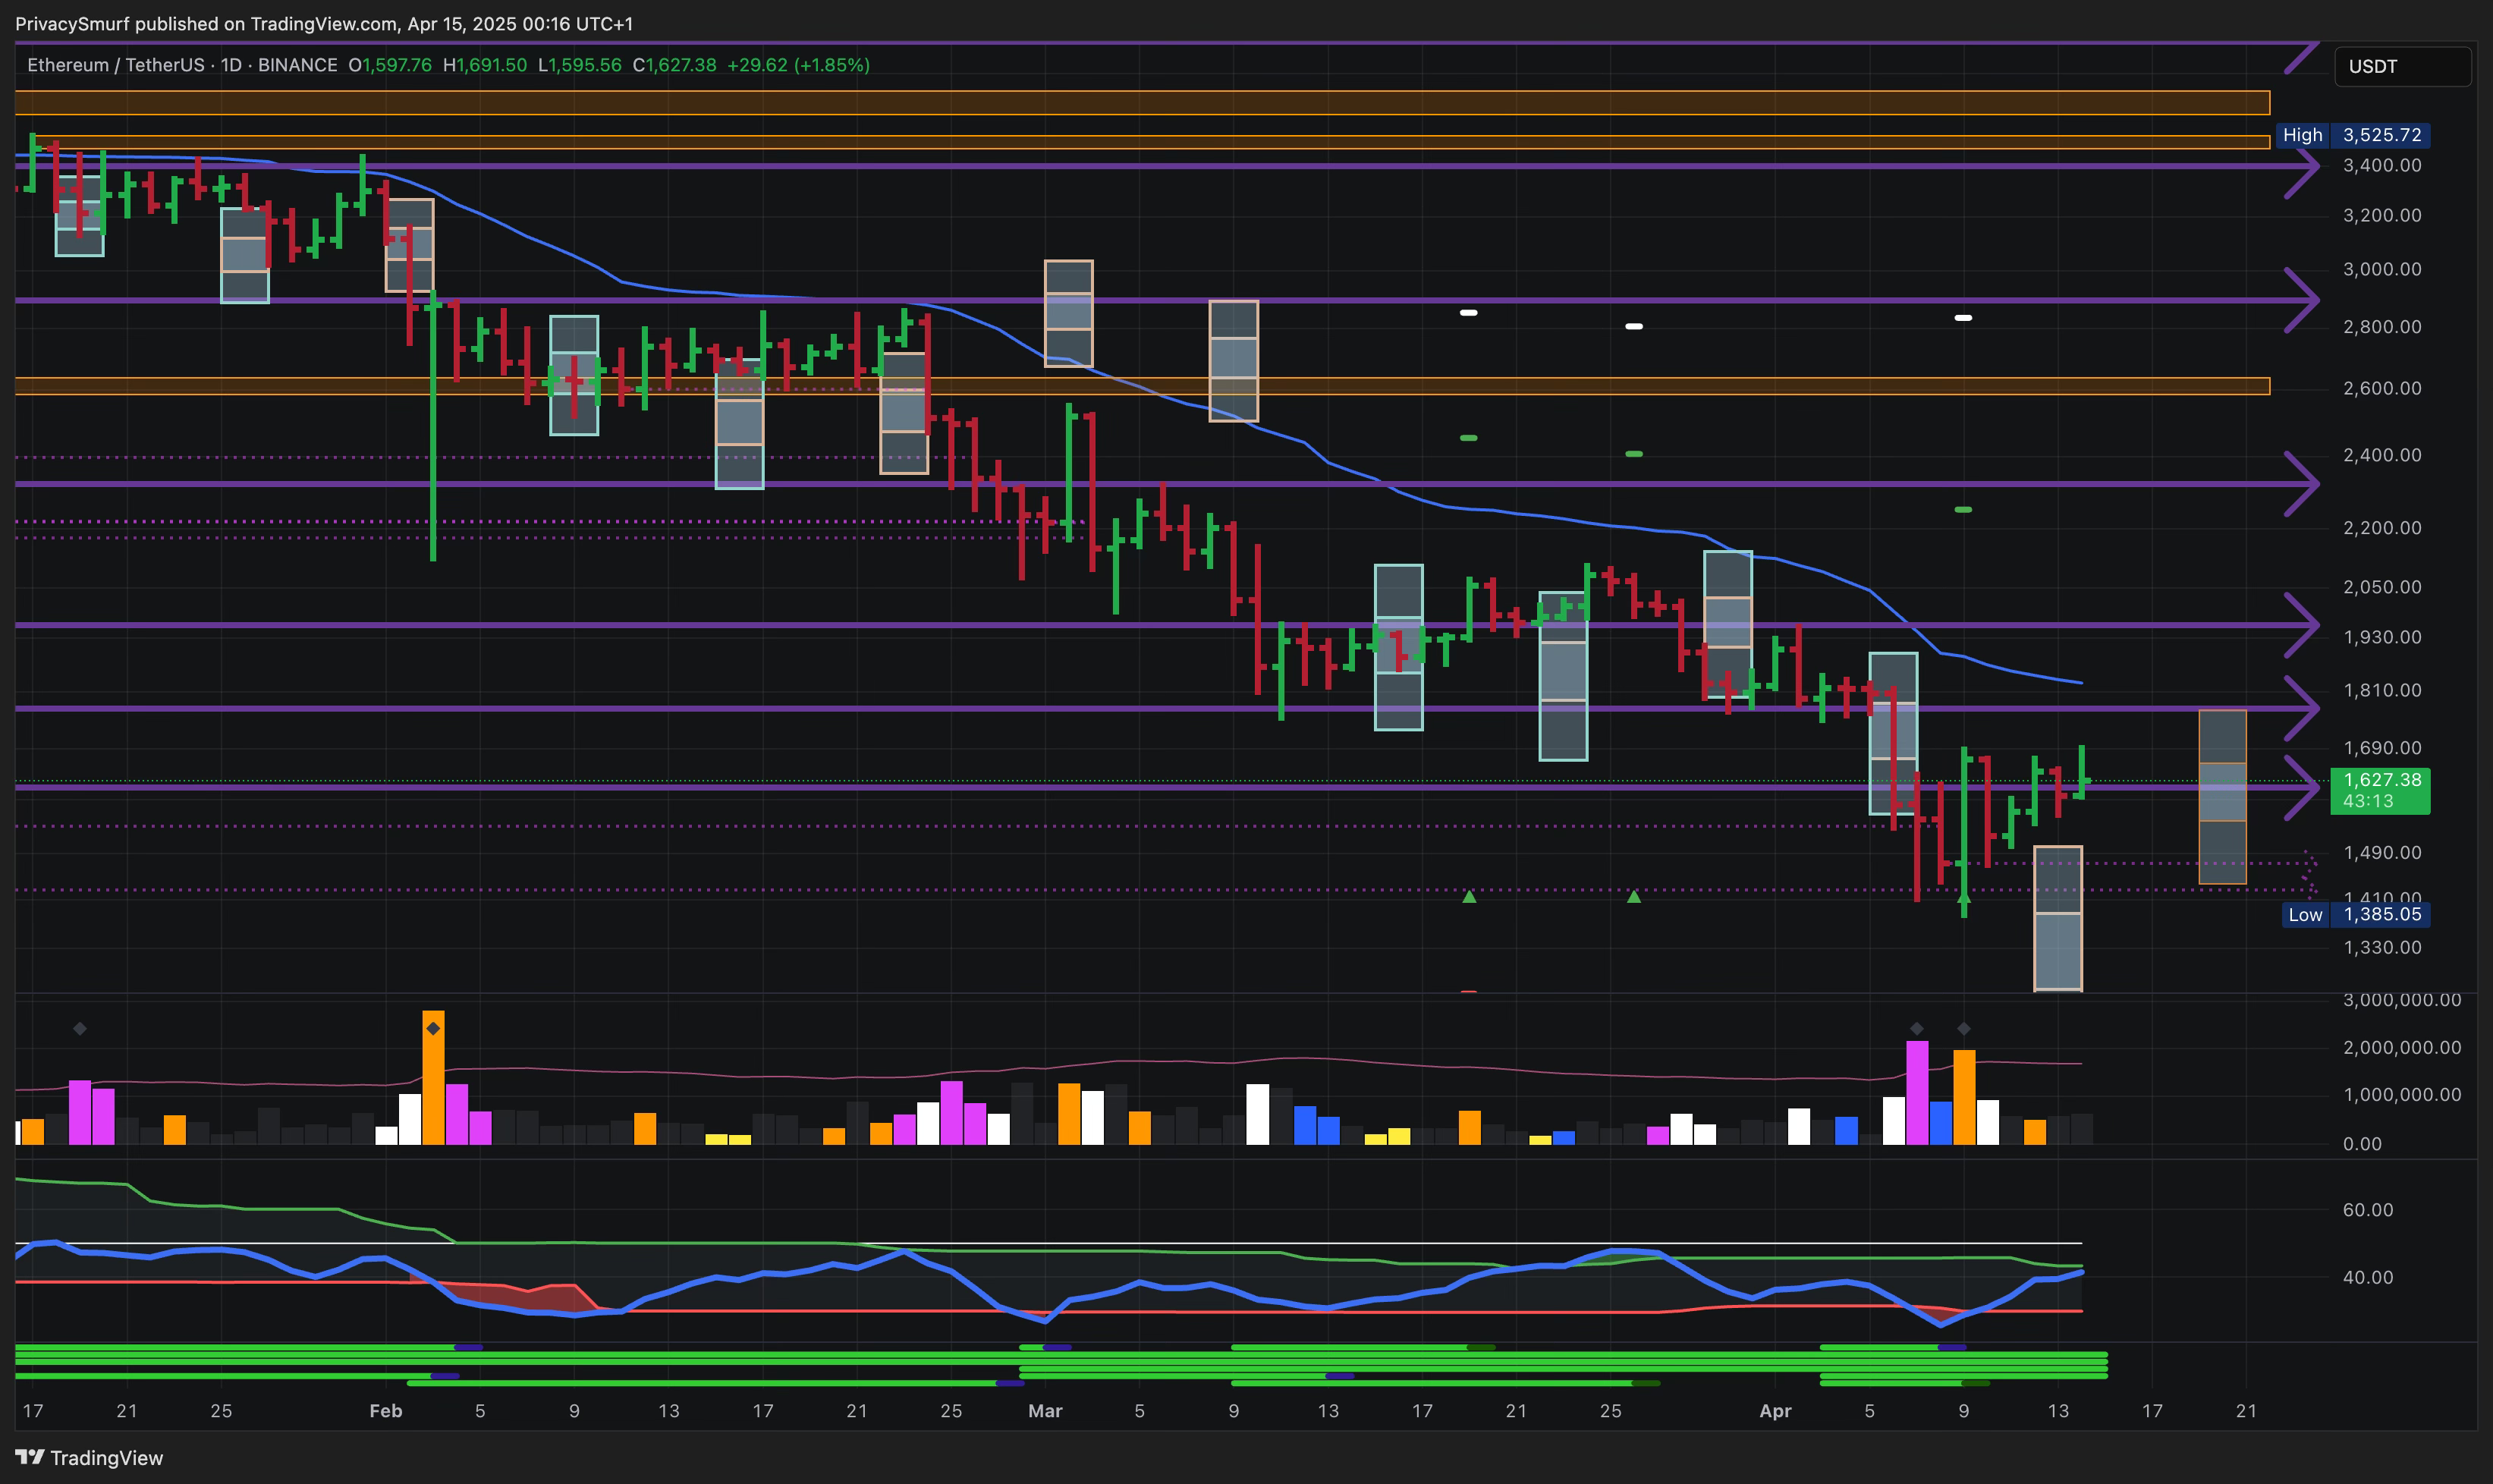
My custom ALT index is still under development. Based on modified versions of older indices, observations indicate that both ETH and ALTs are priming for a possible reversal, with ETH showing less weakness. Given the high BTC dominance, I recommend taking breakout trades with tight stops on ALT charts that are at resistance rather than making support buys at this time. Maintaining tight stops upon entry is essential, as there's no indication of a rotation to ALTs yet. If BTC dominance remains high, a pullback could significantly impact other assets. Nonetheless, I believe the reward slightly outweighs the risk regarding exposure to ETH and ALTs.
(MY) LONG TERM CRYPTO
I say “(MY)” Long Term because I think it’s vital for you to recognize that the analysis is from my perspective regarding my time horizons and trading plans. I’ve been long this bull market since late 2022. For me…

As time progresses without setting new price highs, we continue to shape the market similarly to the last bull market.

In a perfect mirroring scenario, we would have already hit the lowest low and initiated a rally, only to establish a macro lower high over the next six weeks before transitioning into a bear market.
We set a lower low last 2 weeks ago, but we still maintained bullish trade signals on the daily timeframe; there’s no technical reason not to be long. It is important to note that if we are tracking on the same path as last market, I’m okay with being long, but I’m still not swinging for the fences.
Looking below, the last time we retraced from (what, in hindsight, was) the market cycle high, there was a bullish divergence trade signal (circled in blue) around the same timing as our current trade signal. Last cycle, it failed to hit the initial target before eventually turning over and continuing the decline towards our ultimate market cycle lows.
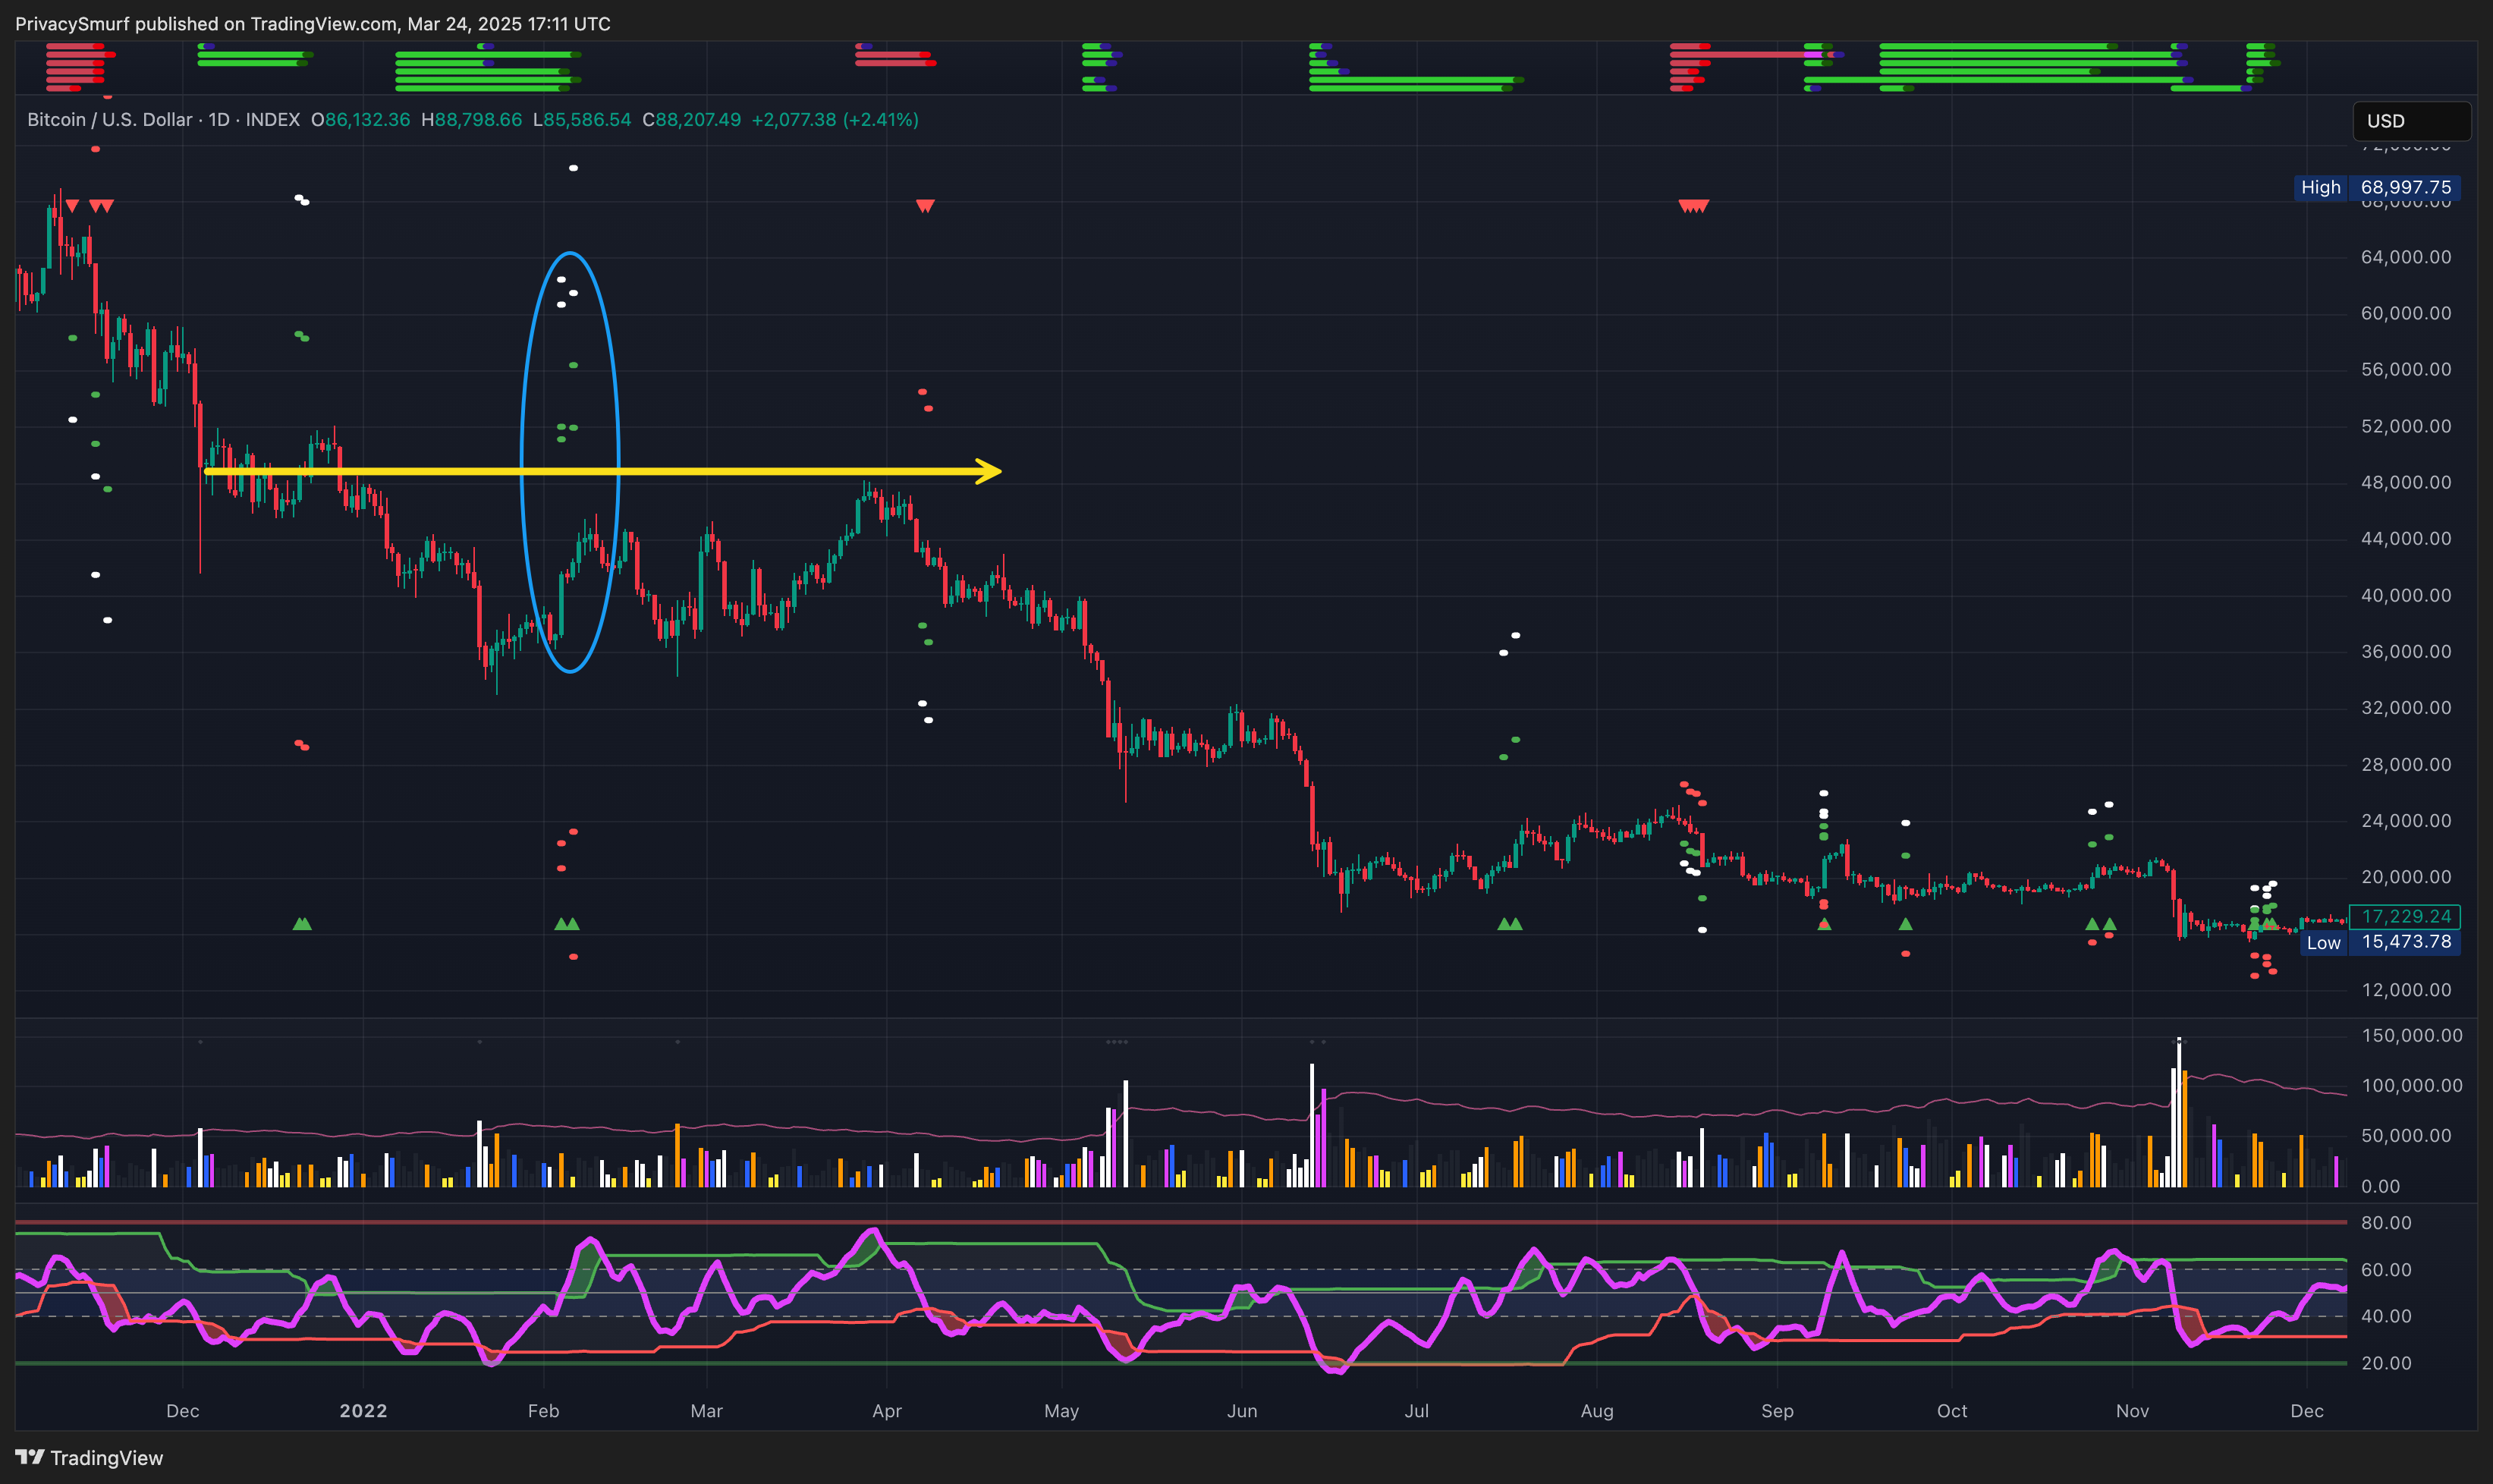
This is why I’m paying attention to the price action as we approach the zone underneath the trade targets. It’s the floor we broke down from and is our current resistance. In the last cycle, bulls could not recover over that level, and I don’t want to be left hoping for prices that are too high for what turns out to be a bear market rally, in hindsight.

We also have some more insight into the potential bear market lows. In the last cycle, looking at the 2-week timeframe, there were two bearish divergence trade signals. Both hit initial targets, as shown by the two blue arrows on the left.

If this pattern continues, as shown by the right blue arrow, we should expect prices to decline to at least $53K when the market rolls over again. I anticipate a bullish move toward the daily target at $94K-ish before this bearish 2-week target.
You’ll understand why when you get the Q2 report tomorrow.
If you like my content, please share it. See you in next week’s market update!
@ThePrivacySmurf
The Substack has been reorganized, so you may not be receiving all the content I’m creating. Please read the post below to learn what happened, what to expect, and how to streamline your preferences.
Below are the TradingView chart links for the images above, which I use daily for my BTC, ETH, and ALT trading.

Awesome, thanks PrivacySmurf! Looking forward to Q2 Report! Cheers