


#135: Does BTC make you feel good?
Yep.

So, South Korea is pretty nice. I would recommend a visit to anyone. We came across this temple on a 4+ mile hike up to a peak in Bukhansan National Park. It’s probably been the best start to any trip we’ve been on. There’s always been some challenge on the first day or two, but Seoul has been so easy to hit the ground running, and has been a great experience.

Does it make me feel good? Yep.
📌 TL;DR / Smurf’s Summary
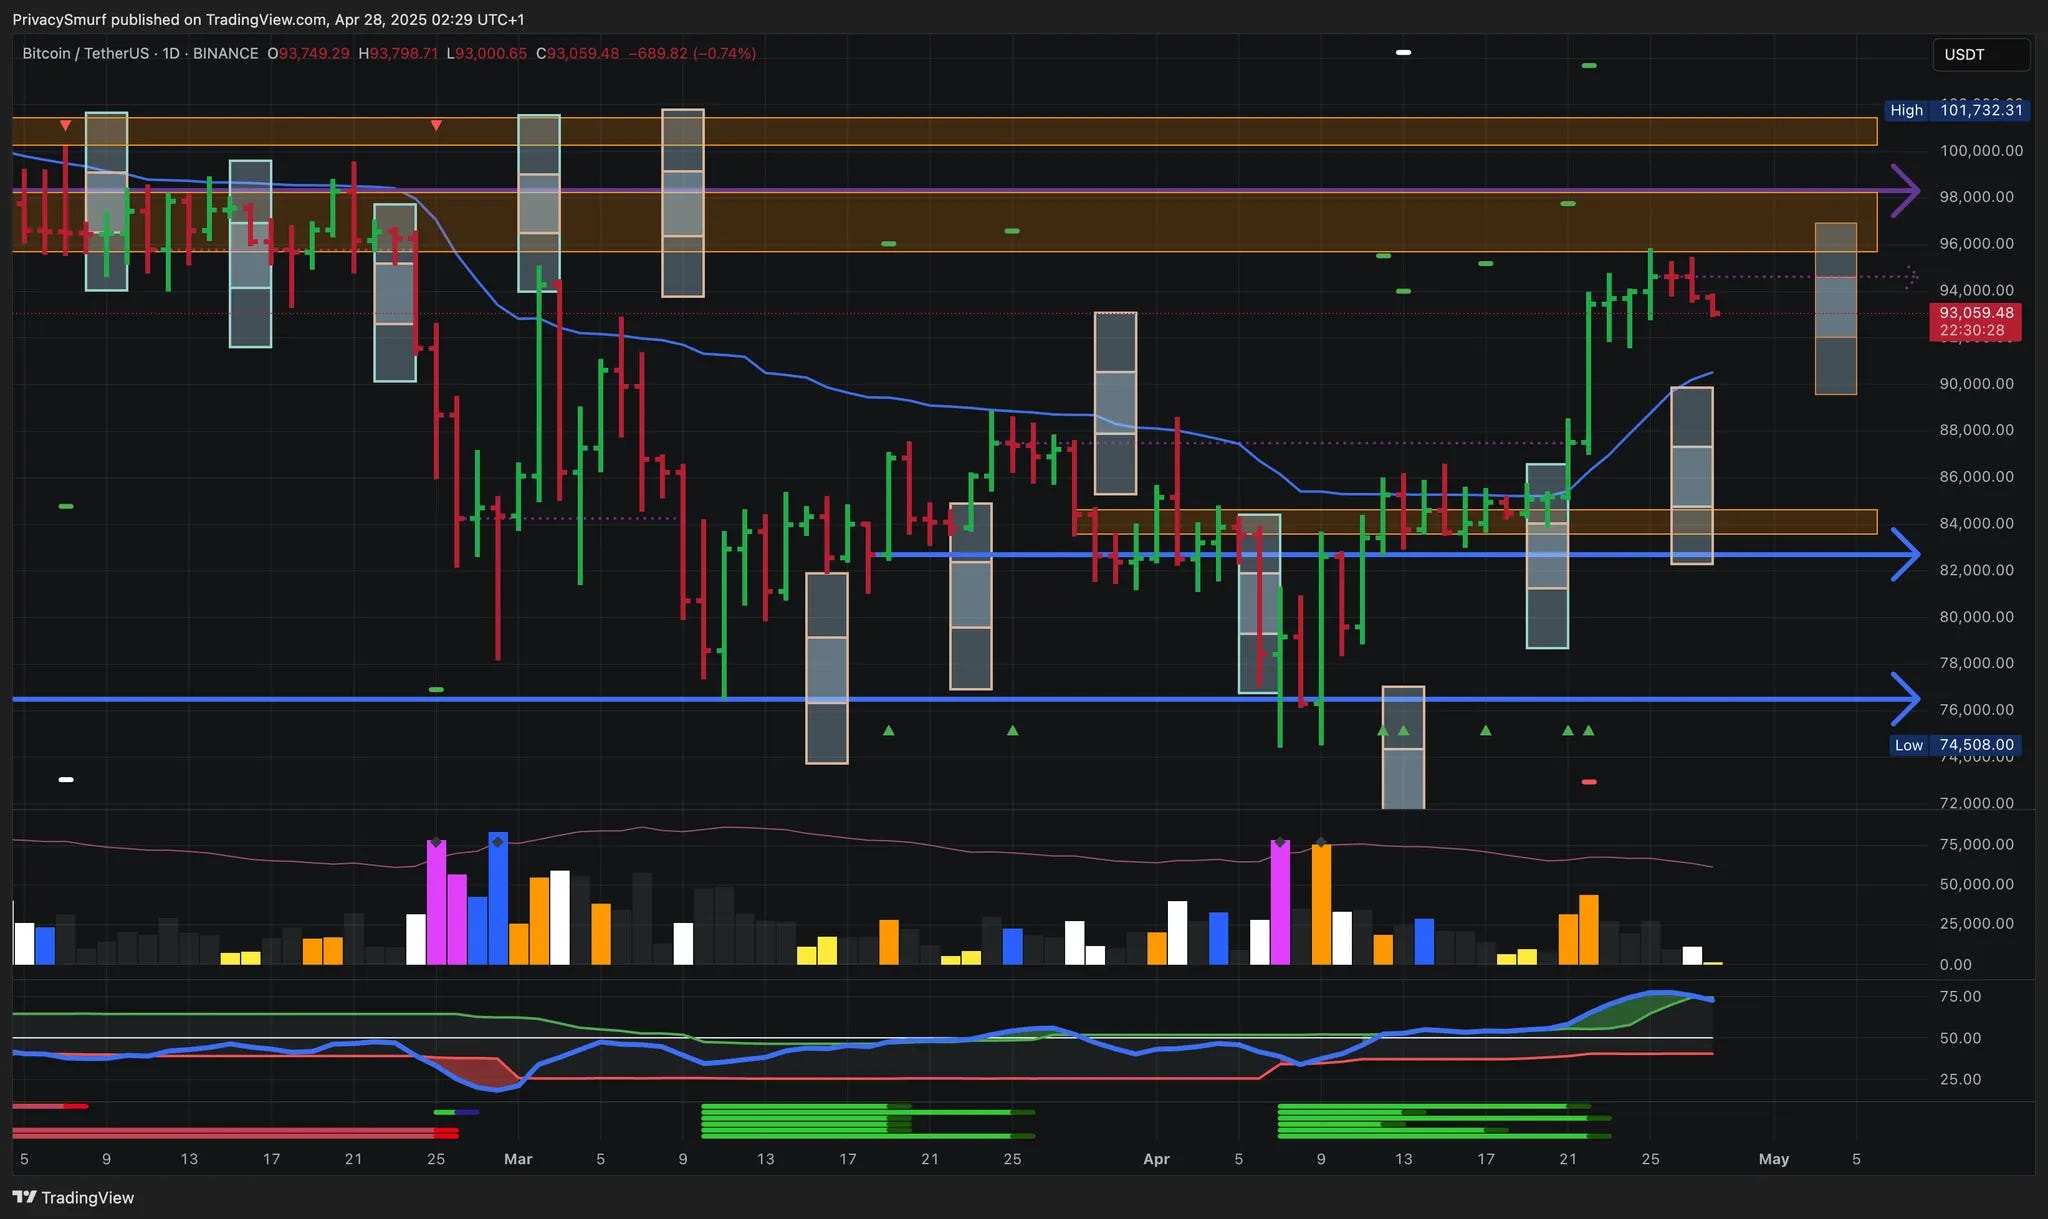
Bitcoin requires monitoring after a breakout rally, prompting caution as we near resistance (~$94K-$98K); key support is $82K-$85K for a potential swing entry. Ethereum and Altcoins are lagging, offering selective breakout chances but require tight stops due to higher risk from BTC dominance in the event of a retrace.
🚦 Trader Traffic Light

BTC Trades: 🟠
Amber Light since the swing from $78K and breakout from $85K have played out. Technicals support the notion of a ceiling for bullish momentum. Evaluate continuation breakout over $95K-ish.
ETH & ALTs Trades: 🟡
Yellow Light. I’m still not looking for dip buys. I’m focusing on breakouts with tight stops. There’s still a sense of caution since the market caps of ALTs are still dwarfed by BTC’s and ETH’s market cap growth. A pullback on BTC could have a bearish influence on the rest of the market, but a traditional rotation into ALTs as BTC stalls is on the table.
🔍 Where Are We Now?
Market Structure: Bullish daily structure, yet short-term momentum suggests topping.
Retail Sentiment: Bullish
Current Positioning:
BTC spot long at $78K (will evaluate second profit taking soon).
Actively evaluating ALT breakout trades with tight stops.
What are the Technicals?
Definitions:
Weekly Closing Range: Created with Bayesian statistics and linear regression. More on that here.
RSI (Relative Strength Index): Momentum indicator showing speed and power of price action.
Divergence: When price action is going one way but momentum is going the other, suggesting the current price trend might be losing power.
📈 Technical Deep Dive (BTC)
Price Action:
Support zone at $82K-$85K; Resistance zone at $96K-$98K; invalidation of bullish bias if daily prices close below $74K.
Weekly Closing Range is forecasted at $89.6K - $96.9K by Sunday. 13 out of 26 (50% efficiency)
Indicators & Oscillators:
RSI: Suggesting ceiling and/or consolidation range formation because measurements are:
Currently above midline - momentum is generally bullish, it’s easier to go up than down.
Pending closure below adaptive top band - bullish impulsive action has ceased with a new momentum breakout ceiling at $94.6K
Divergence Signals: Confirmed bullish divergence targets at $94K have been hit. Secondary targets remain around $104K. I’m not optimistic about the secondary target at the moment.
📉 Technical Deep Dive (ETH & ALTs)

Price Action (ETH):
Support zone at $1400-$1500; Resistance at $1775 and $1960; invalidation of bullish bias if daily prices close below $1400.
Weekly Closing Range is forecasted at $1605 - $1900 by Sunday. 12 out of 25 (48% efficiency)
Indicators & Oscillators (ETH):
RSI: Suggesting continued impulsive bullish price action because measurements are:
Currently above midline - momentum is generally bullish, it’s easier to go up than down.
Currently above adaptive top band - price action is on a momentum breakout to define a new ceiling.
It is important to monitor the RSI this week. It is trending towards a path that will lead to the RSI closing back below the top adaptive band, just like BTC, which would suggest the ceiling is in and for the next momentum breakout to be from $1820.
Divergence Signals: Confirmed bullish divergence targets are placed around $2250 and $2800. I’m not optimistic about the secondary target. If the RSI retreats below the band it’s possible the first target is not hit until later in the month.
ALTs: Slightly lagging behind ETH but in a similar technical state and on the verge of bullish impulsiveness. Focus on ALTs that have been up trending and are at critical resistance levels. Wait for breakouts that allow for tight stop losses.

XMR is a example of a good to ideal setup. Generally up trending long term price action. Clear consolidation range between $190 support and $240 resistance. A sequence of higher lows leading up to a breakout. Each higher low could have been a stop loss placement on the breakout entry depending on your risk appetites. The highest higher low pivot point is what I would refer to as a tight stop. Targets would have been hit same day.

🧭 What’s the Plan?
**🧭 Trading Scenarios & Plan**

*   **Bullish - BTC Breakout Continuation:**
    *   Condition: Close > $95K
    *   Action: Eval. new leveraged longs
*   **Caution - BTC Consolidation:**
    *   Condition: Closes < $94K & RSI back inside bands
    *   Action: Consider additional profit taking on short-term longs
*   **Bearish - BTC Bullish Invalidation:**
    *   Condition: Close < $74K
    *   Action: Close short-term spot BTC position
*   **ALT Rotation Confirmed:**
    *   Condition: BTC < $94K, & BTC.D stable or dropping, & OTHERS.D increasing
    *   Action: Eval. ALT breakouts

---

**📌 Risk Management**

*   **Stop-Losses:**
    *   BTC: Daily close < $74K
    *   ALTs: Placement under clear pivot point ideally < 12% below entry
*   **Position Sizing:**
    *   BTC: Moderate entries
    *   ALTs: Small entries
🔮 My Long-Term Market Reflection

Macro Cycle Status:
Bull market still intact but in a phase that in the past lead to bear market confirmation.
Historical Comparison:
Similar patterns to the prior bull market suggest caution; historically, failure to breach all-time highs before turning back down signaled bear market onset.

Personal Expectations:
As time progresses without setting new price highs, we continue to shape the market similarly to the last bull market.
In a perfect mirroring scenario, we would have already hit the lowest low and initiated a rally, only to establish a macro lower high over the next 4 weeks before transitioning into a bear market. This timeline matches very well with the current peaking window for the daily chart, according to the quarterly forecast. Read that here if you haven’t yet.
We have met the initial targets for the bullish divergence trade signaled back in March. There are no promises on any higher targets and a rollover to new lows from here would not be unprecedented.
We have left the first price peak timing window for BTC. If the pattern is to hold, the next bottoming turning point for a bottom is between May 10 - May 15, and the expectation is a daily close below $93457 and ideally above $76276.

As we are around the topping window if the RSI confirms a momentum peak I’ll be taking some additional profits. Ideally, I’ll have an opportunity in (or before) the early May bottoming window to purchase at a lower price.
🎯 Key Takeaways
BTC: At key resistance level($94K-$98K) with potential topping signals (RSI). Monitor $82K-$85K support for possible swing entry. Below $74K signals caution/potential trend shift. Consider taking profits now.
ETH/ALTs: Weaker than BTC but in place for typical rotation, focus on selective breakout trades on ALTs breaking resistance. Use tight stops. Moderate risk if BTC pulls back.
Market Context: Caution advised. Current structure resembles historical cycle tops. Prioritize risk management and stick to your trading plan; avoid hype.
@ThePrivacySmurf