


#142 Supplemental Data
BTC: "All I ever do is delay..."

This post contains the key technical data and metrics used to create the weekly update released each Monday morning.
1. Total Market Weekly Structure
No New Changes - Most Recent Update April 27, 2025:
(Chart: Link)
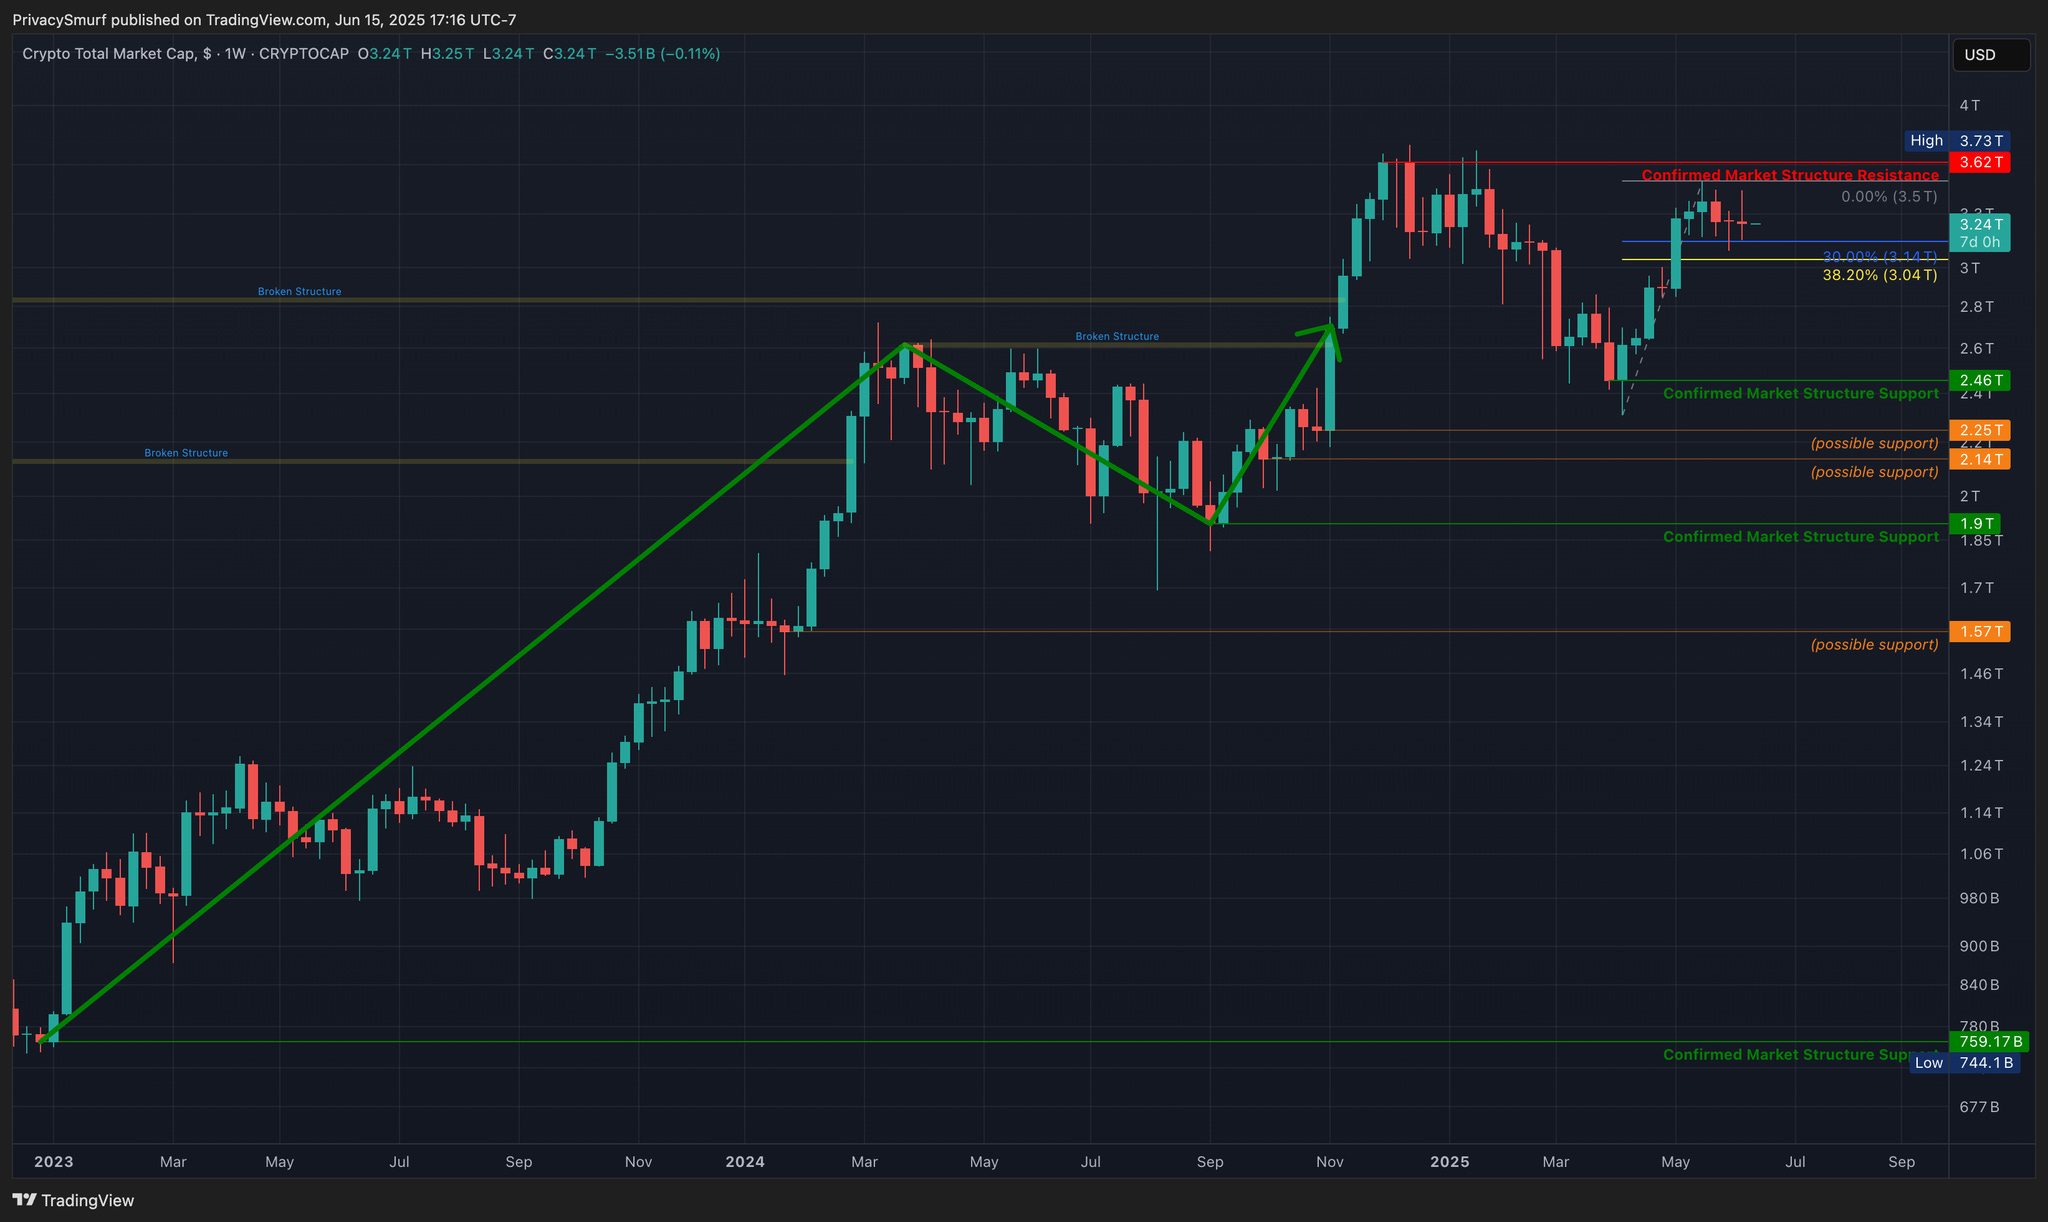
Trend: Remains structurally bullish.
Key Levels: Closest resistance at $3.62T. Closest support at $2.46T.
Confirmation Watch: Awaiting a weekly close below $3.04T (at the time of writing) to confirm a resistance.
Potential Scenarios:
Bearish: Market Cap hasn’t set a new all time high close. If valuation continues down from here and breaks below $2.46T, it would be a macro lower high, confirming a shift towards a bearish trend and bear market.
Bullish: Market Cap sets a new all time high close. This would be a traditional bullish trend continuation pattern (SEP low, NOV high, APR higher low, ? higher high), delaying a shift towards a bearish trend and bear market.
2. Total Market Daily Structure
No New Changes - Most Recent Update April 22, 2025:
(Chart: Link)

Trend: Bullish. Two prior resistances were broken, qualifying as a trend shift by my rules.
Key Levels: Next closest resistance at $3.64T. Closest confirmed support at $2.6T, potential support at $3.13T.
Confirmation Watch: Awaiting a close below $3.04T (at the time of writing) to confirm a resistance.
Potential Scenarios:
Bullish: A pull back confirming a resistance would be a step towards making a traditional transition to a bullish trend (low, high, higher low, higher high). Anchoring from the low at $2.6T we would be confirming the high and awaiting the follow on higher low confirmation.
Why no Bearish?: The conditions needed to create a bearish transition require too many hypothetical turns to play out. A deeper retracement from here is possible it’s just not able to be determined from this process.
3. Crypto Money Flow
No New Changes - Most Recent Update May 29, 2025:
(Chart: Link)
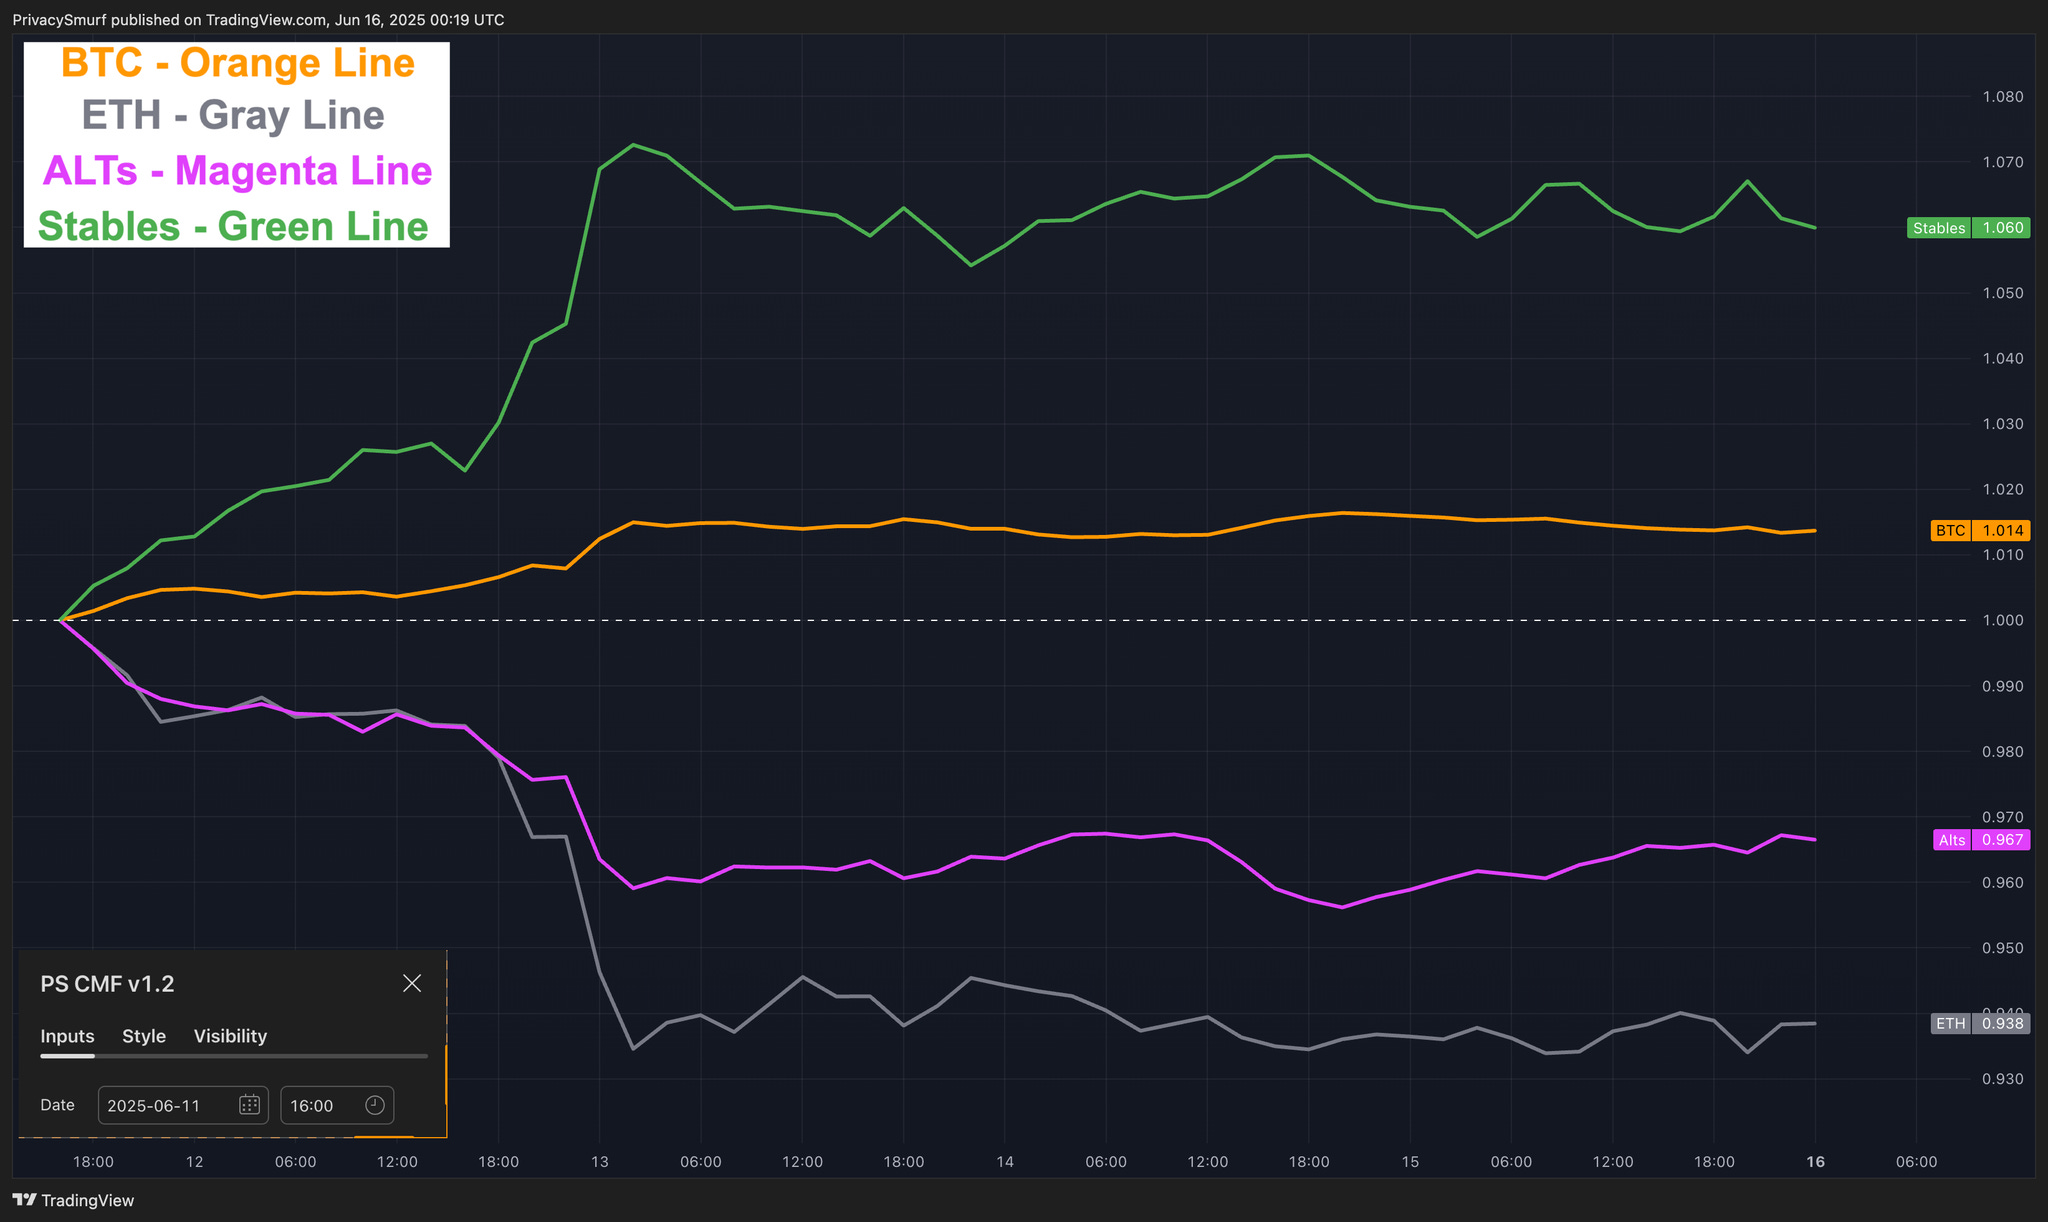
Anchor point: June 11, 2025, 16:00 UTC.
Observation: While the anchor point is moved there hasn’t been a big enough market wide rotation to note. I’m moving the anchor forward to maintain fine enough granularity in the data to identify a new rotation.
Interpretation: BTC and Stables going up with ETH and ALTs go down can be presented in price as a continued market decline with BTC and Stables as protection, or the be presented as a BTC rally. ETH and ALTs may not experience the same price appreciation. I’m not looking for an ETH or ALT rotation at the moment.
4. Additional Metrics
Retail Sentiment:

Moderately Bullish. Given the current rate of descent in price and sentiment the midline of sentiment may be around a price test under $100K, perhaps in the $98K to $100K range. There’s nothing more to be gleaned from the chart.
Market Validity Score:
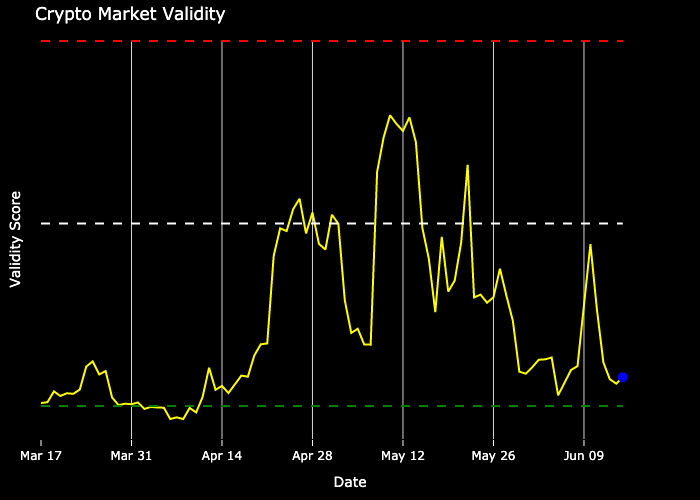
Most assets show a bearish daily structure. There’s nothing more to be gleaned from this chart.
Market Drivers:

The Market Driver Ratio tracks whether large-cap cryptocurrencies or smaller altcoins are leading the market by measuring their relative performance. When the line rises, large-caps are outperforming; when it falls, smaller cryptocurrencies are showing relative strength. I’ll have a post dedicated to this analysis out soon.
The Driver Chart can’t be updated from last week as one of the data providers hasn’t updated information since June 9.
Click the links below if you need a refresher on the sections above.
@ThePrivacySmurf