

This post contains the key technical data and metrics used to create the weekly update released each Monday morning.
1. Total Market Weekly Structure
No New Changes - Most Recent Update Nov 9, 2025:
(Chart: Link)
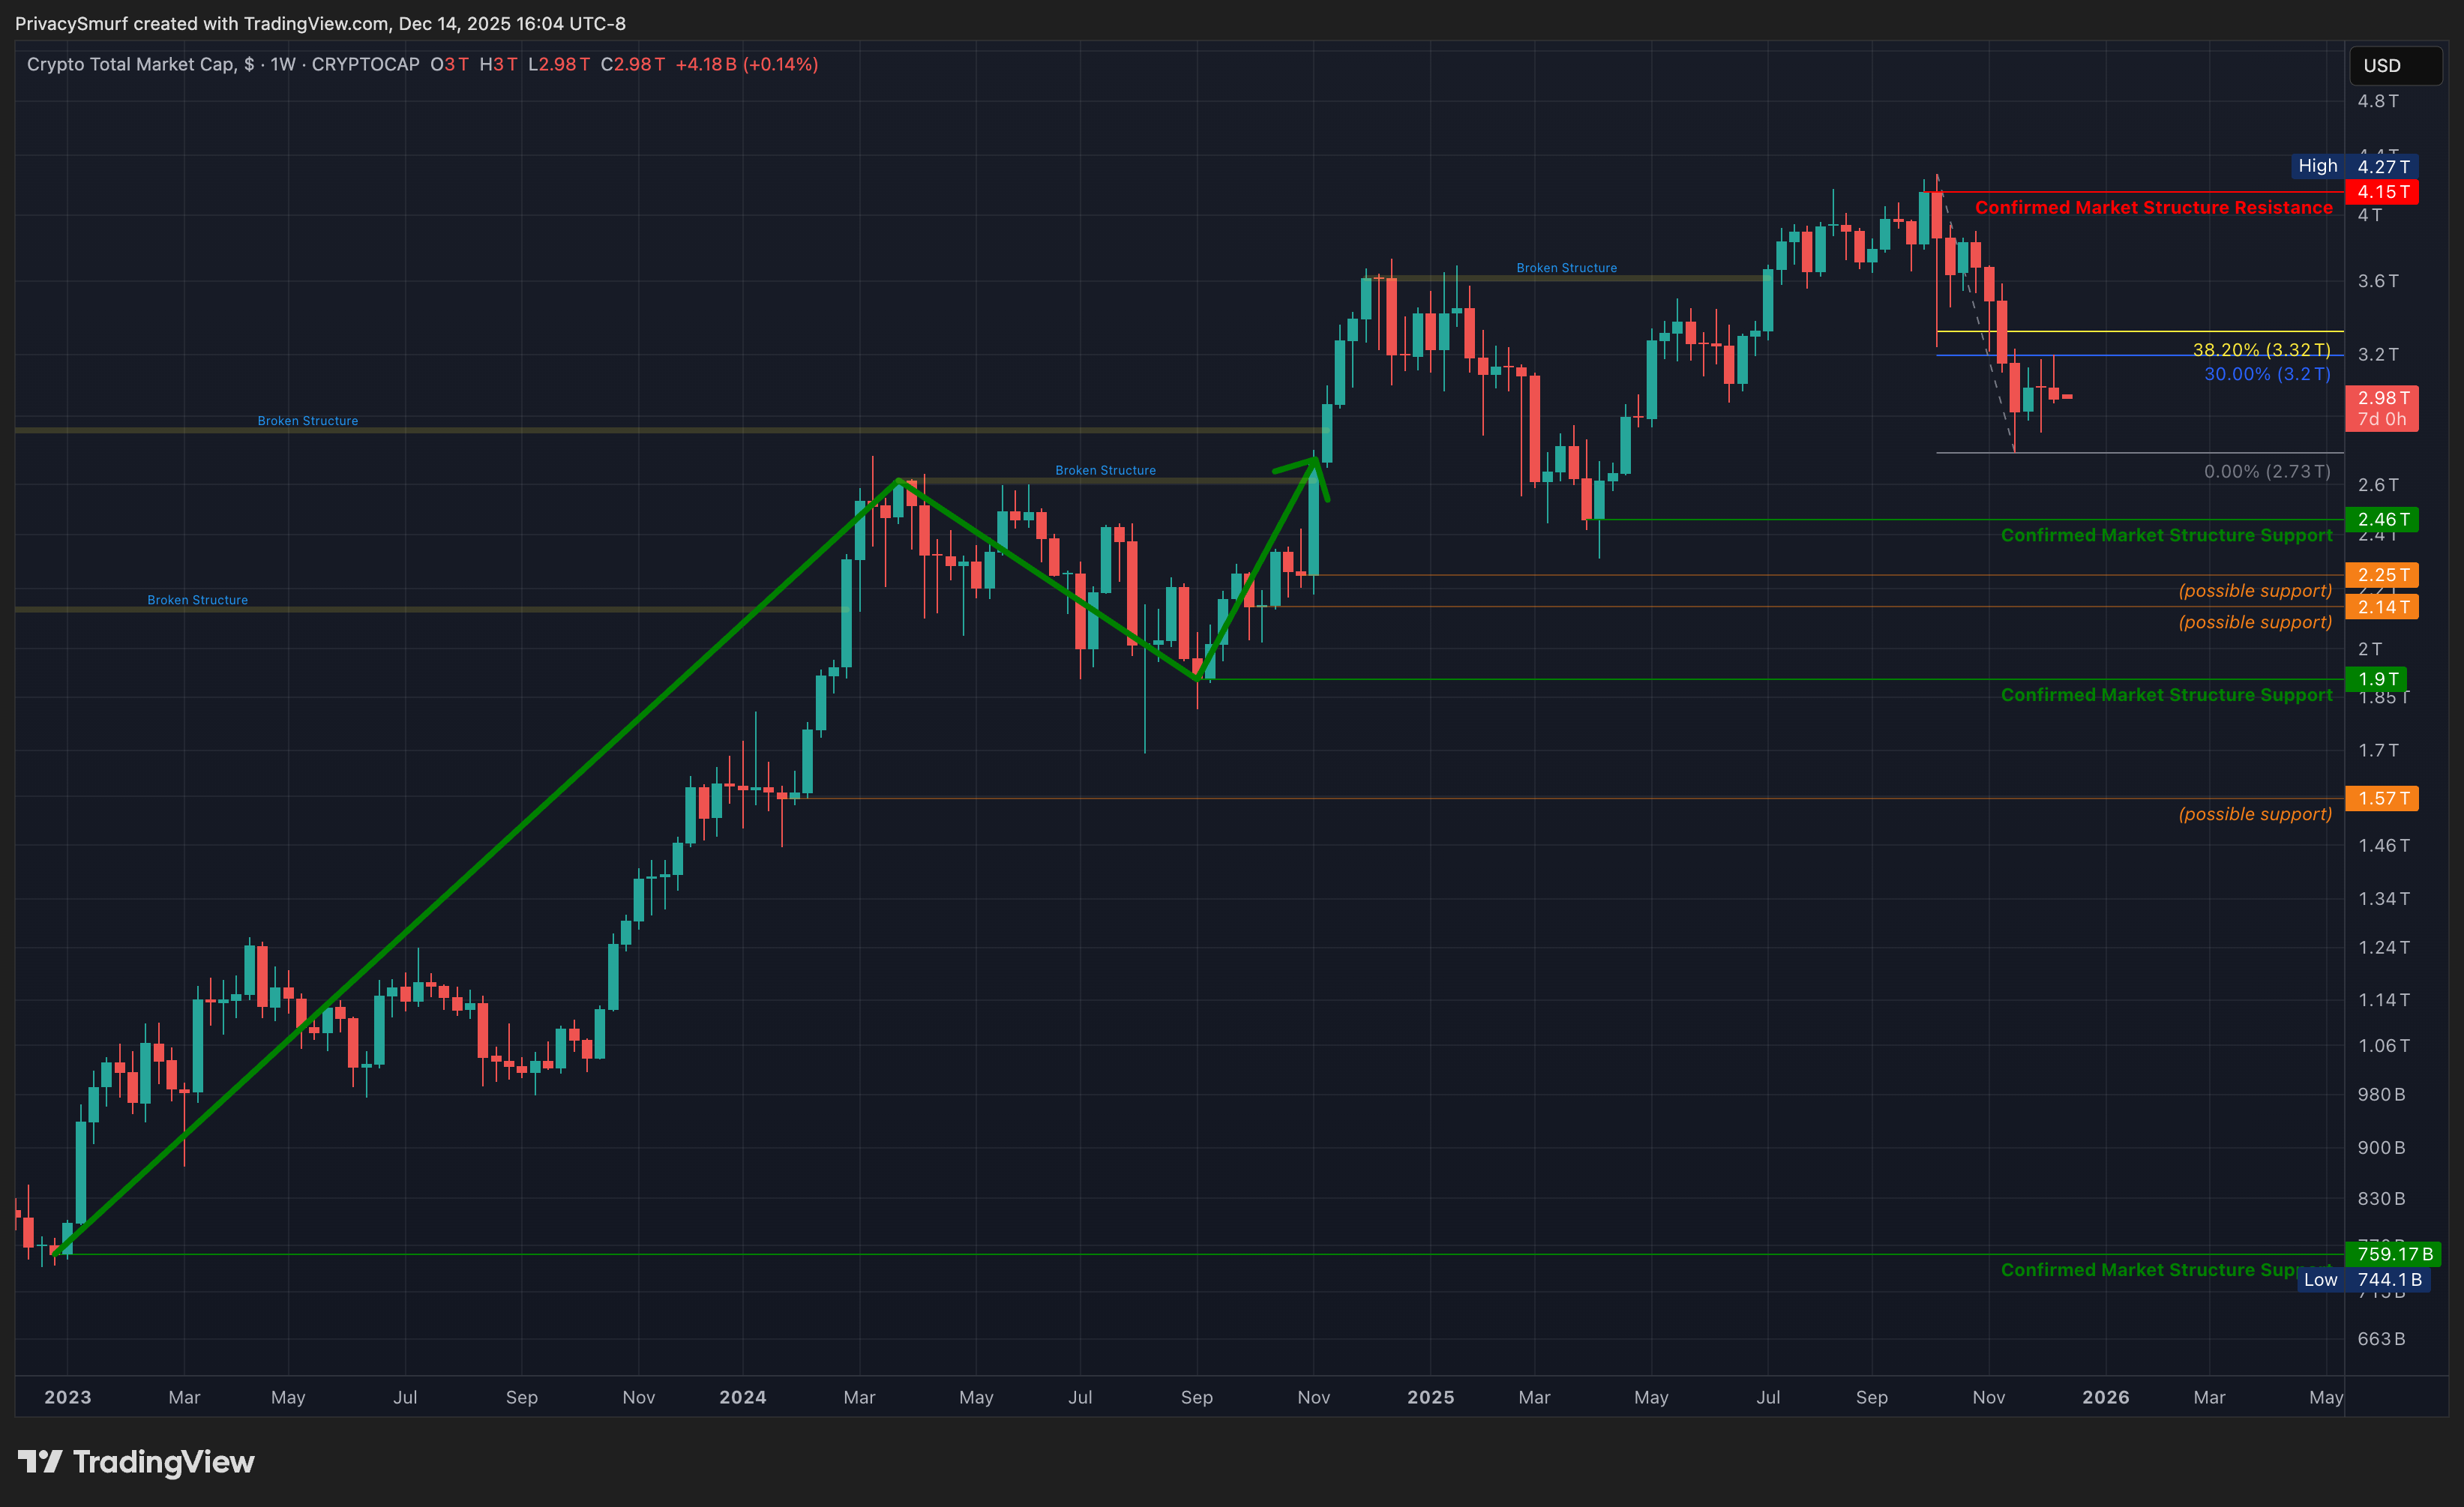
Trend: Bullish. On retracement from the latest ATH.
Key Levels: Resistance at $4.15T. Support at $2.46T.
Confirmation Watch: Awaiting two consecutive bullish candles and a close above $3.32T (at the time of writing) to confirm support.
Potential Scenarios:
Bullish: Market Cap rallies and sets a higher high close above $4.15T. This establishes a traditional bullish trend continuation pattern (MAR low, SEP high, potential higher low here, future higher high later), delaying a shift towards a bearish trend and bear market.
Bearish: Two bullish weeks and a rally above $3.32T would give us structure support at the lowest close. Breaking below that after that support confirmation would flip the weekly trend to bearish as it would create the traditional high, low, lower high, lower low zigzag shape.
2. Total Market Daily Structure
No new changes - Most Recent Update Nov 4, 2025:
(Chart: Link)
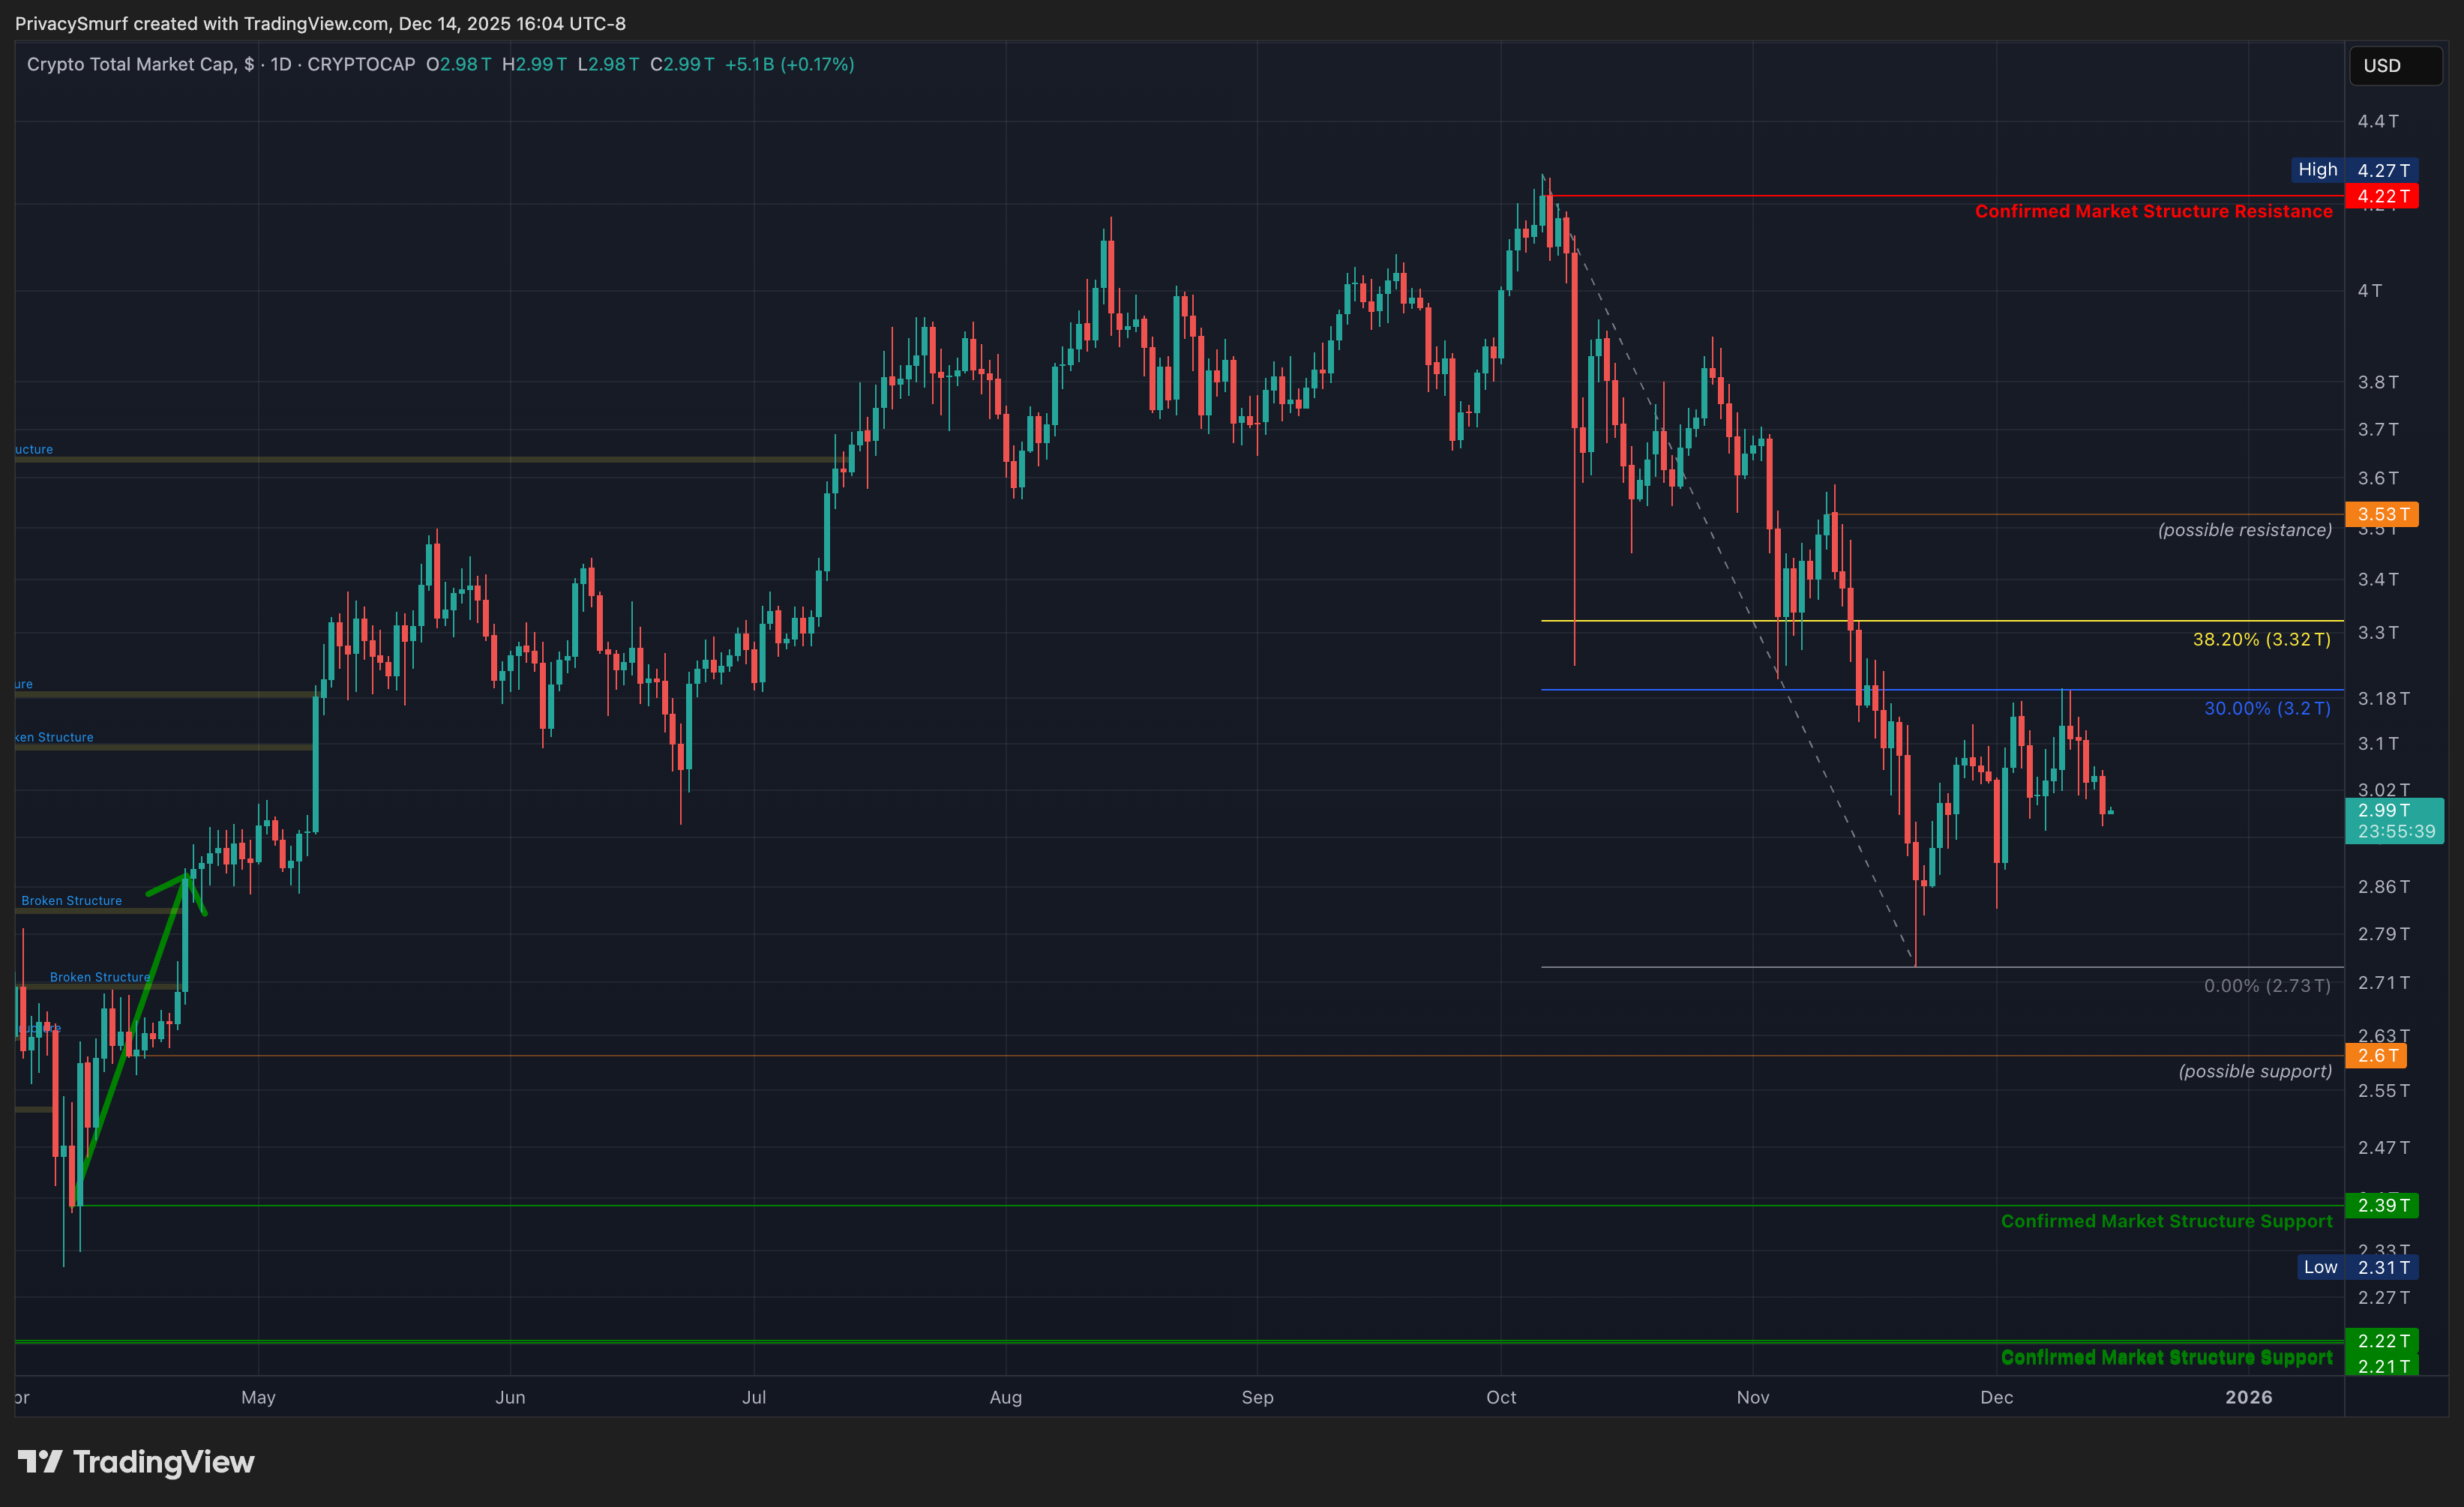
Trend: Bullish. On retracement from the latest ATH.
Key Levels: Potential resistance at $3.53T, Resistance at $4.22T. Potential support at $2.6T. Closest confirmed support is at $2.39T.
Confirmation Watch: Awaiting a close above $3.32T (at the time of writing) to confirm support.
Potential Scenarios:
Bullish: A rally confirming a support would be a step towards making a traditional bullish continuation (APR low, OCT high, potential higher low here, future higher high later), delaying a shift towards a bearish trend and bear market.
Bearish: A rally above $3.62T would give us structure support at the lowest close. Breaking below that after that support confirmation would flip the daily trend to bearish as it would create the traditional high, low, lower high, lower low zigzag shape (OCT high, potential low here, future lower high later, future lower low after that).
3. Crypto Money Flow
No New Changes - Most Recent Update Nov 25, 2025:
(Chart: Link)
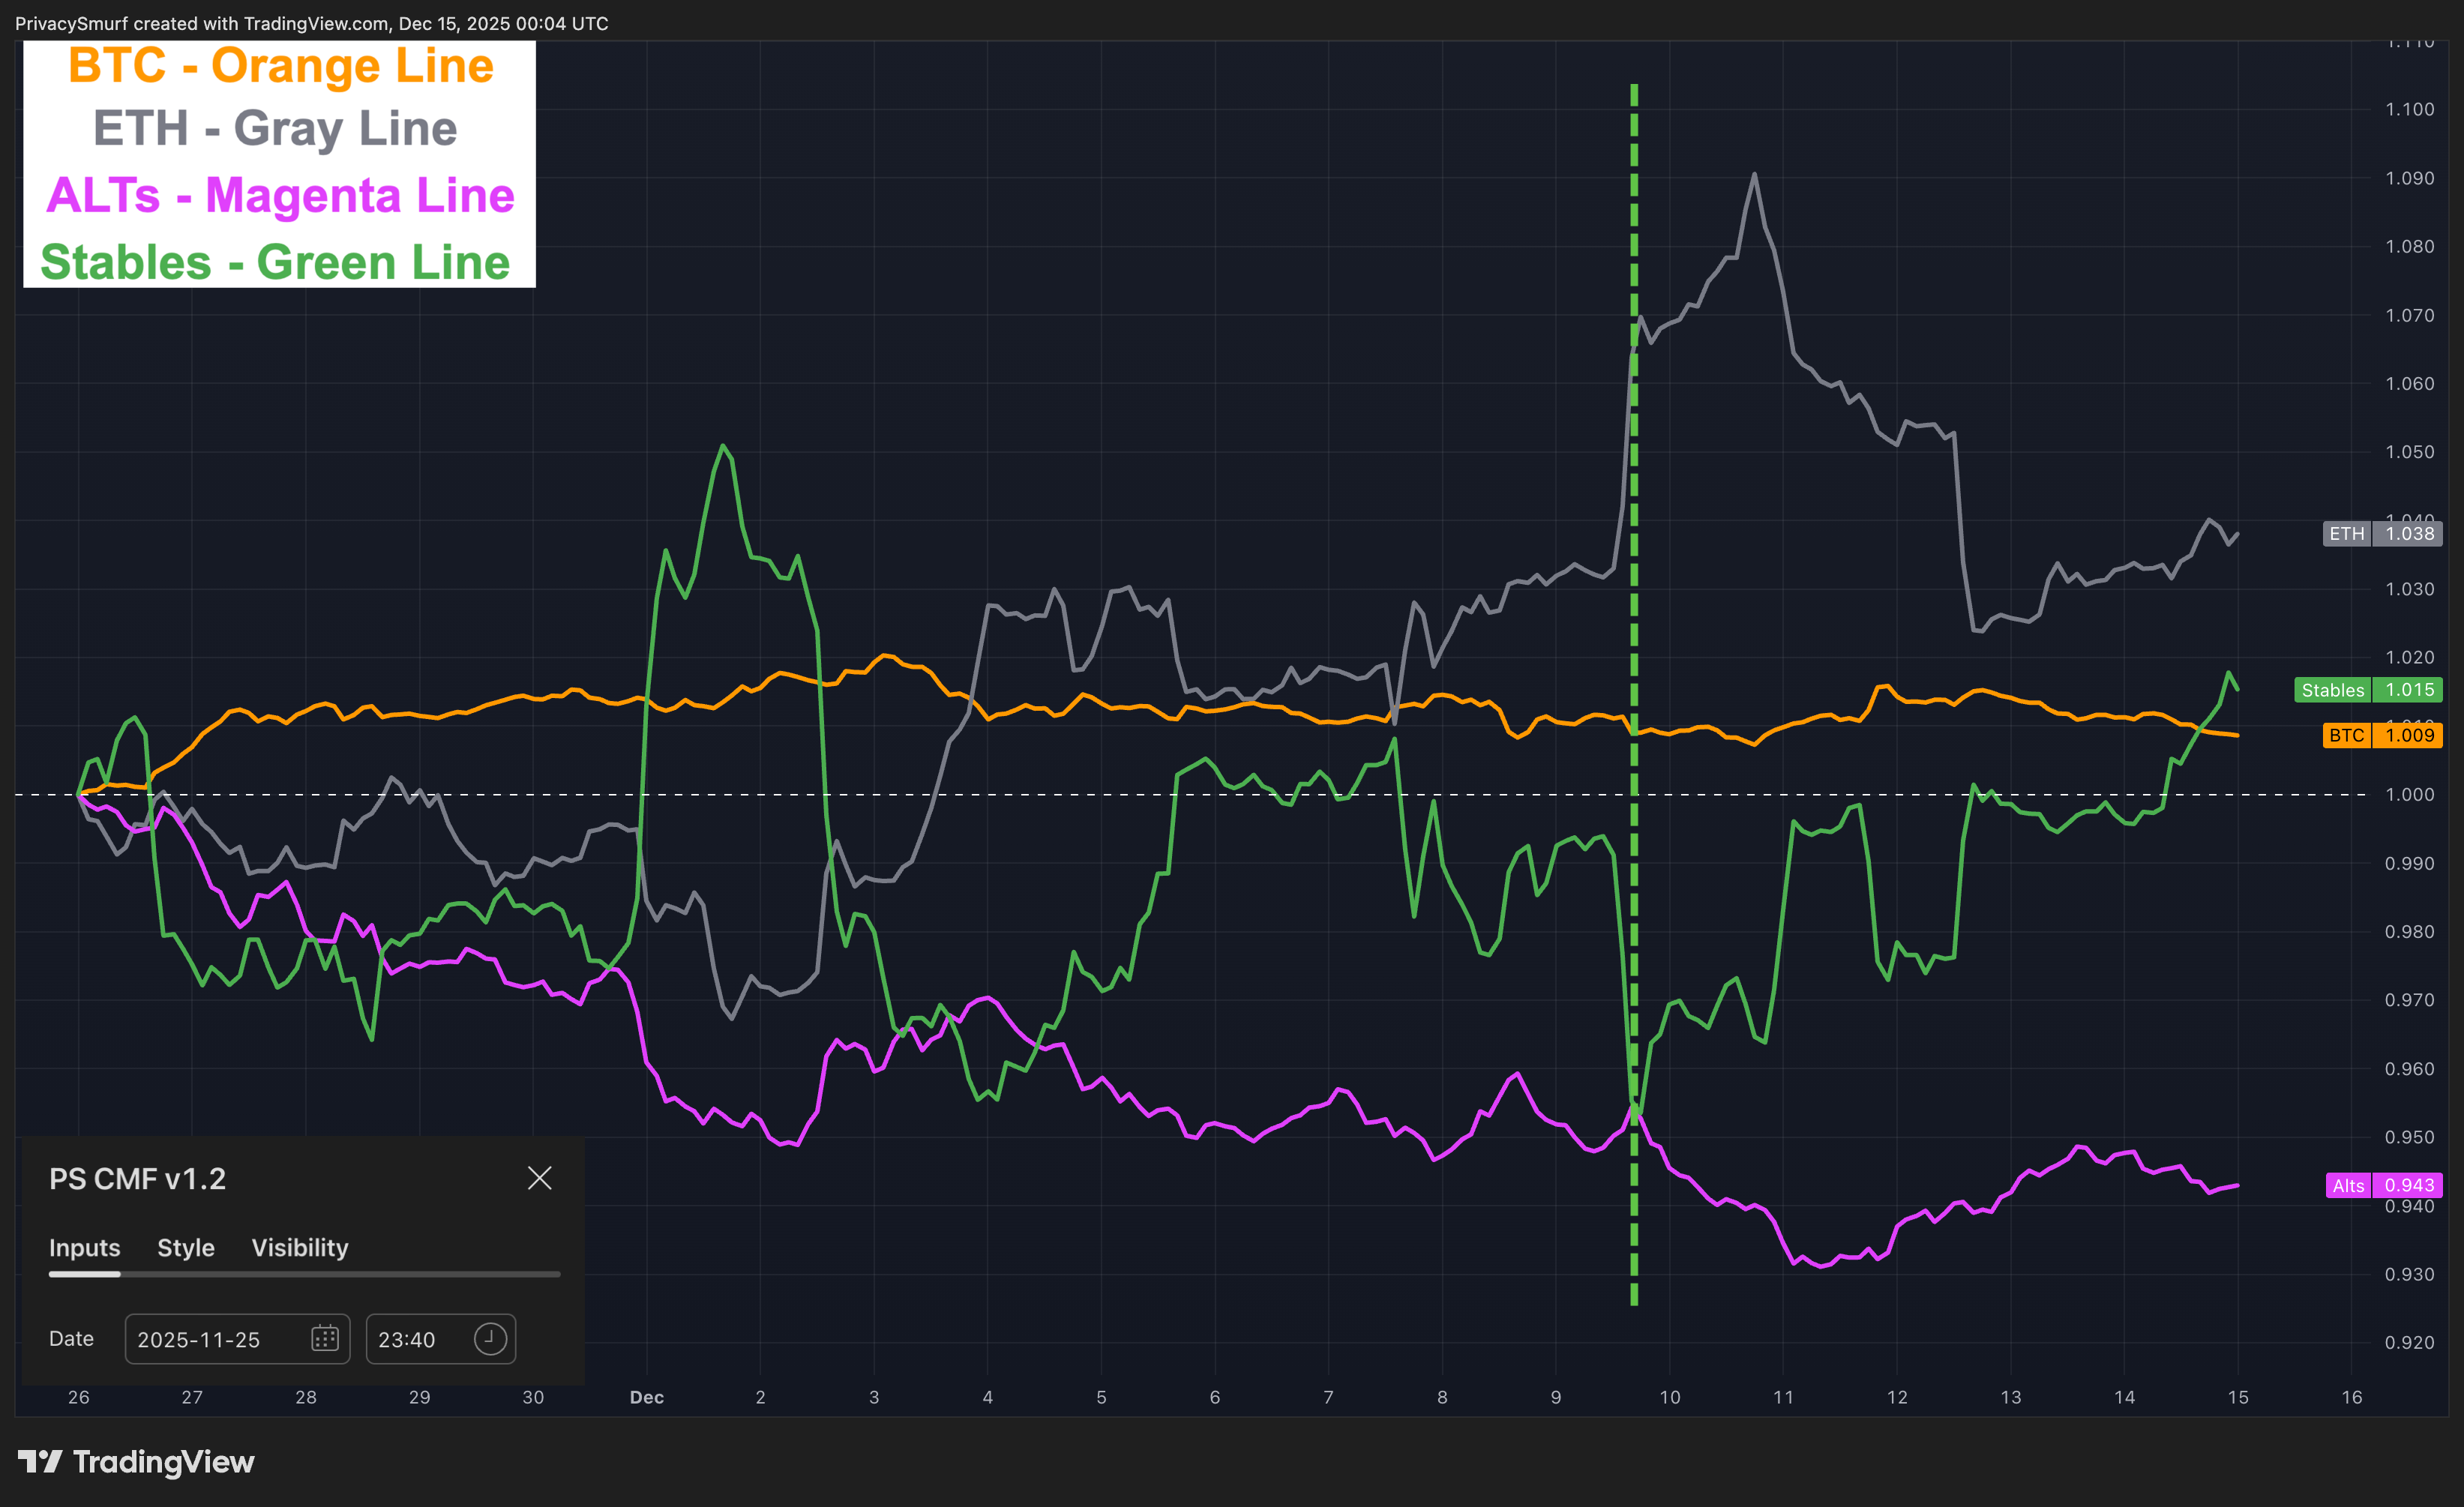
Anchor point: November 25, 2025, 23:40 UTC.
Observation: The original bottoming phase appears to be completed with a minor ETH rotation. BTS is now losing ground to Stables.
Interpretation: With most assets declining in market share to Stable (after the green vertical dashed line), we may see a price decline in the market as it searches for a new bottom. Ideally, the closes are above the lowest lows.
4. Additional Metrics
Retail Sentiment:
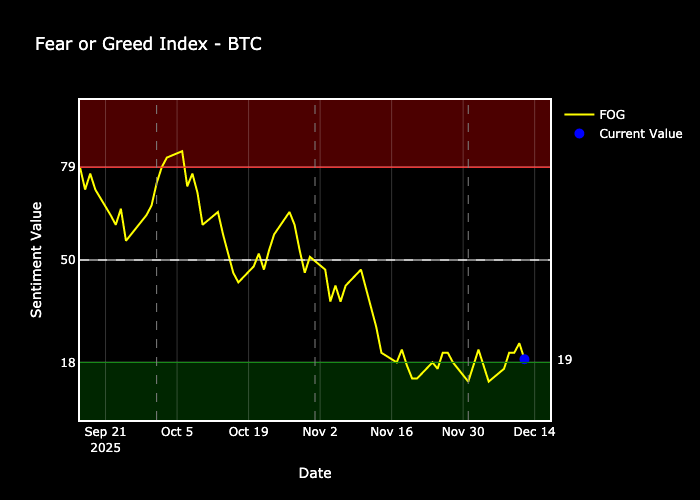
Highly Fearful. After recent trips into the extremely fearful zone, we're still waiting for a bullish trade signal.
Market Validity Score:
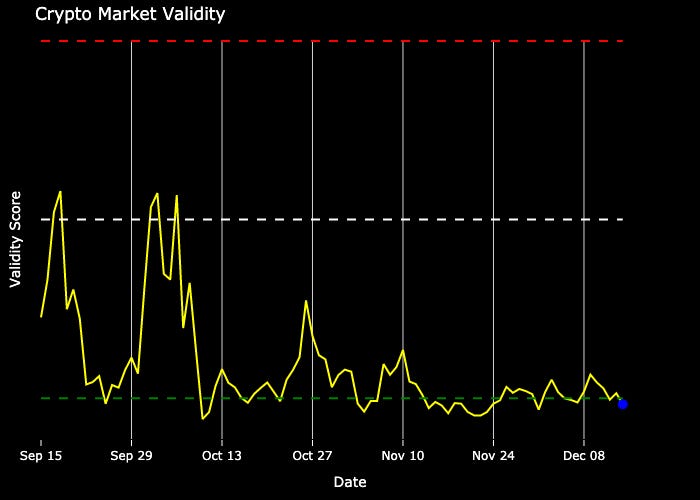
Nearly all crypto assets exhibit a bearish daily pattern. Perpetual bottom finding.
Market Drivers:
The Market Driver Ratio measures relative performance concentration among the top 100 cryptocurrencies by comparing market-cap-weighted performance with equally weighted performance.
Rising ratio: Indicates a concentrated, large-cap dominated market. This typically reflects risk-off sentiment or Bitcoin/Ethereum leadership. Consider favoring large-cap positions or reducing altcoin exposure.
Falling ratio: Signals broad-based strength and altcoin outperformance. This reflects risk-on sentiment and market expansion. Consider rotating into smaller-cap opportunities.
Watch for turning points or ranges where the ratio changes overall direction or breaks levels. These often indicate shifts in market regime and can signal when to reposition between large-cap and altcoin strategies.
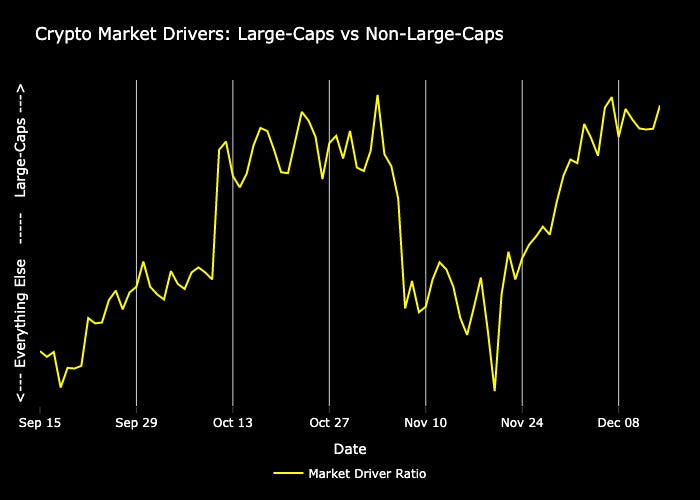
People are LOADING up on large caps. This is in anticipation of, and a precursor to, a bullish move, IMO. Breaking out on the chart would likely coincide with BTC making a new high after breaking out above $94K.
Click the links below if you need a refresher on the sections above:
@ThePrivacySmurf