

This post contains the key technical data and metrics used to create the weekly update released each Monday morning.
1. Total Market Weekly Structure
No New Changes - Most Recent Update Nov 9, 2025:
(Chart: Link)
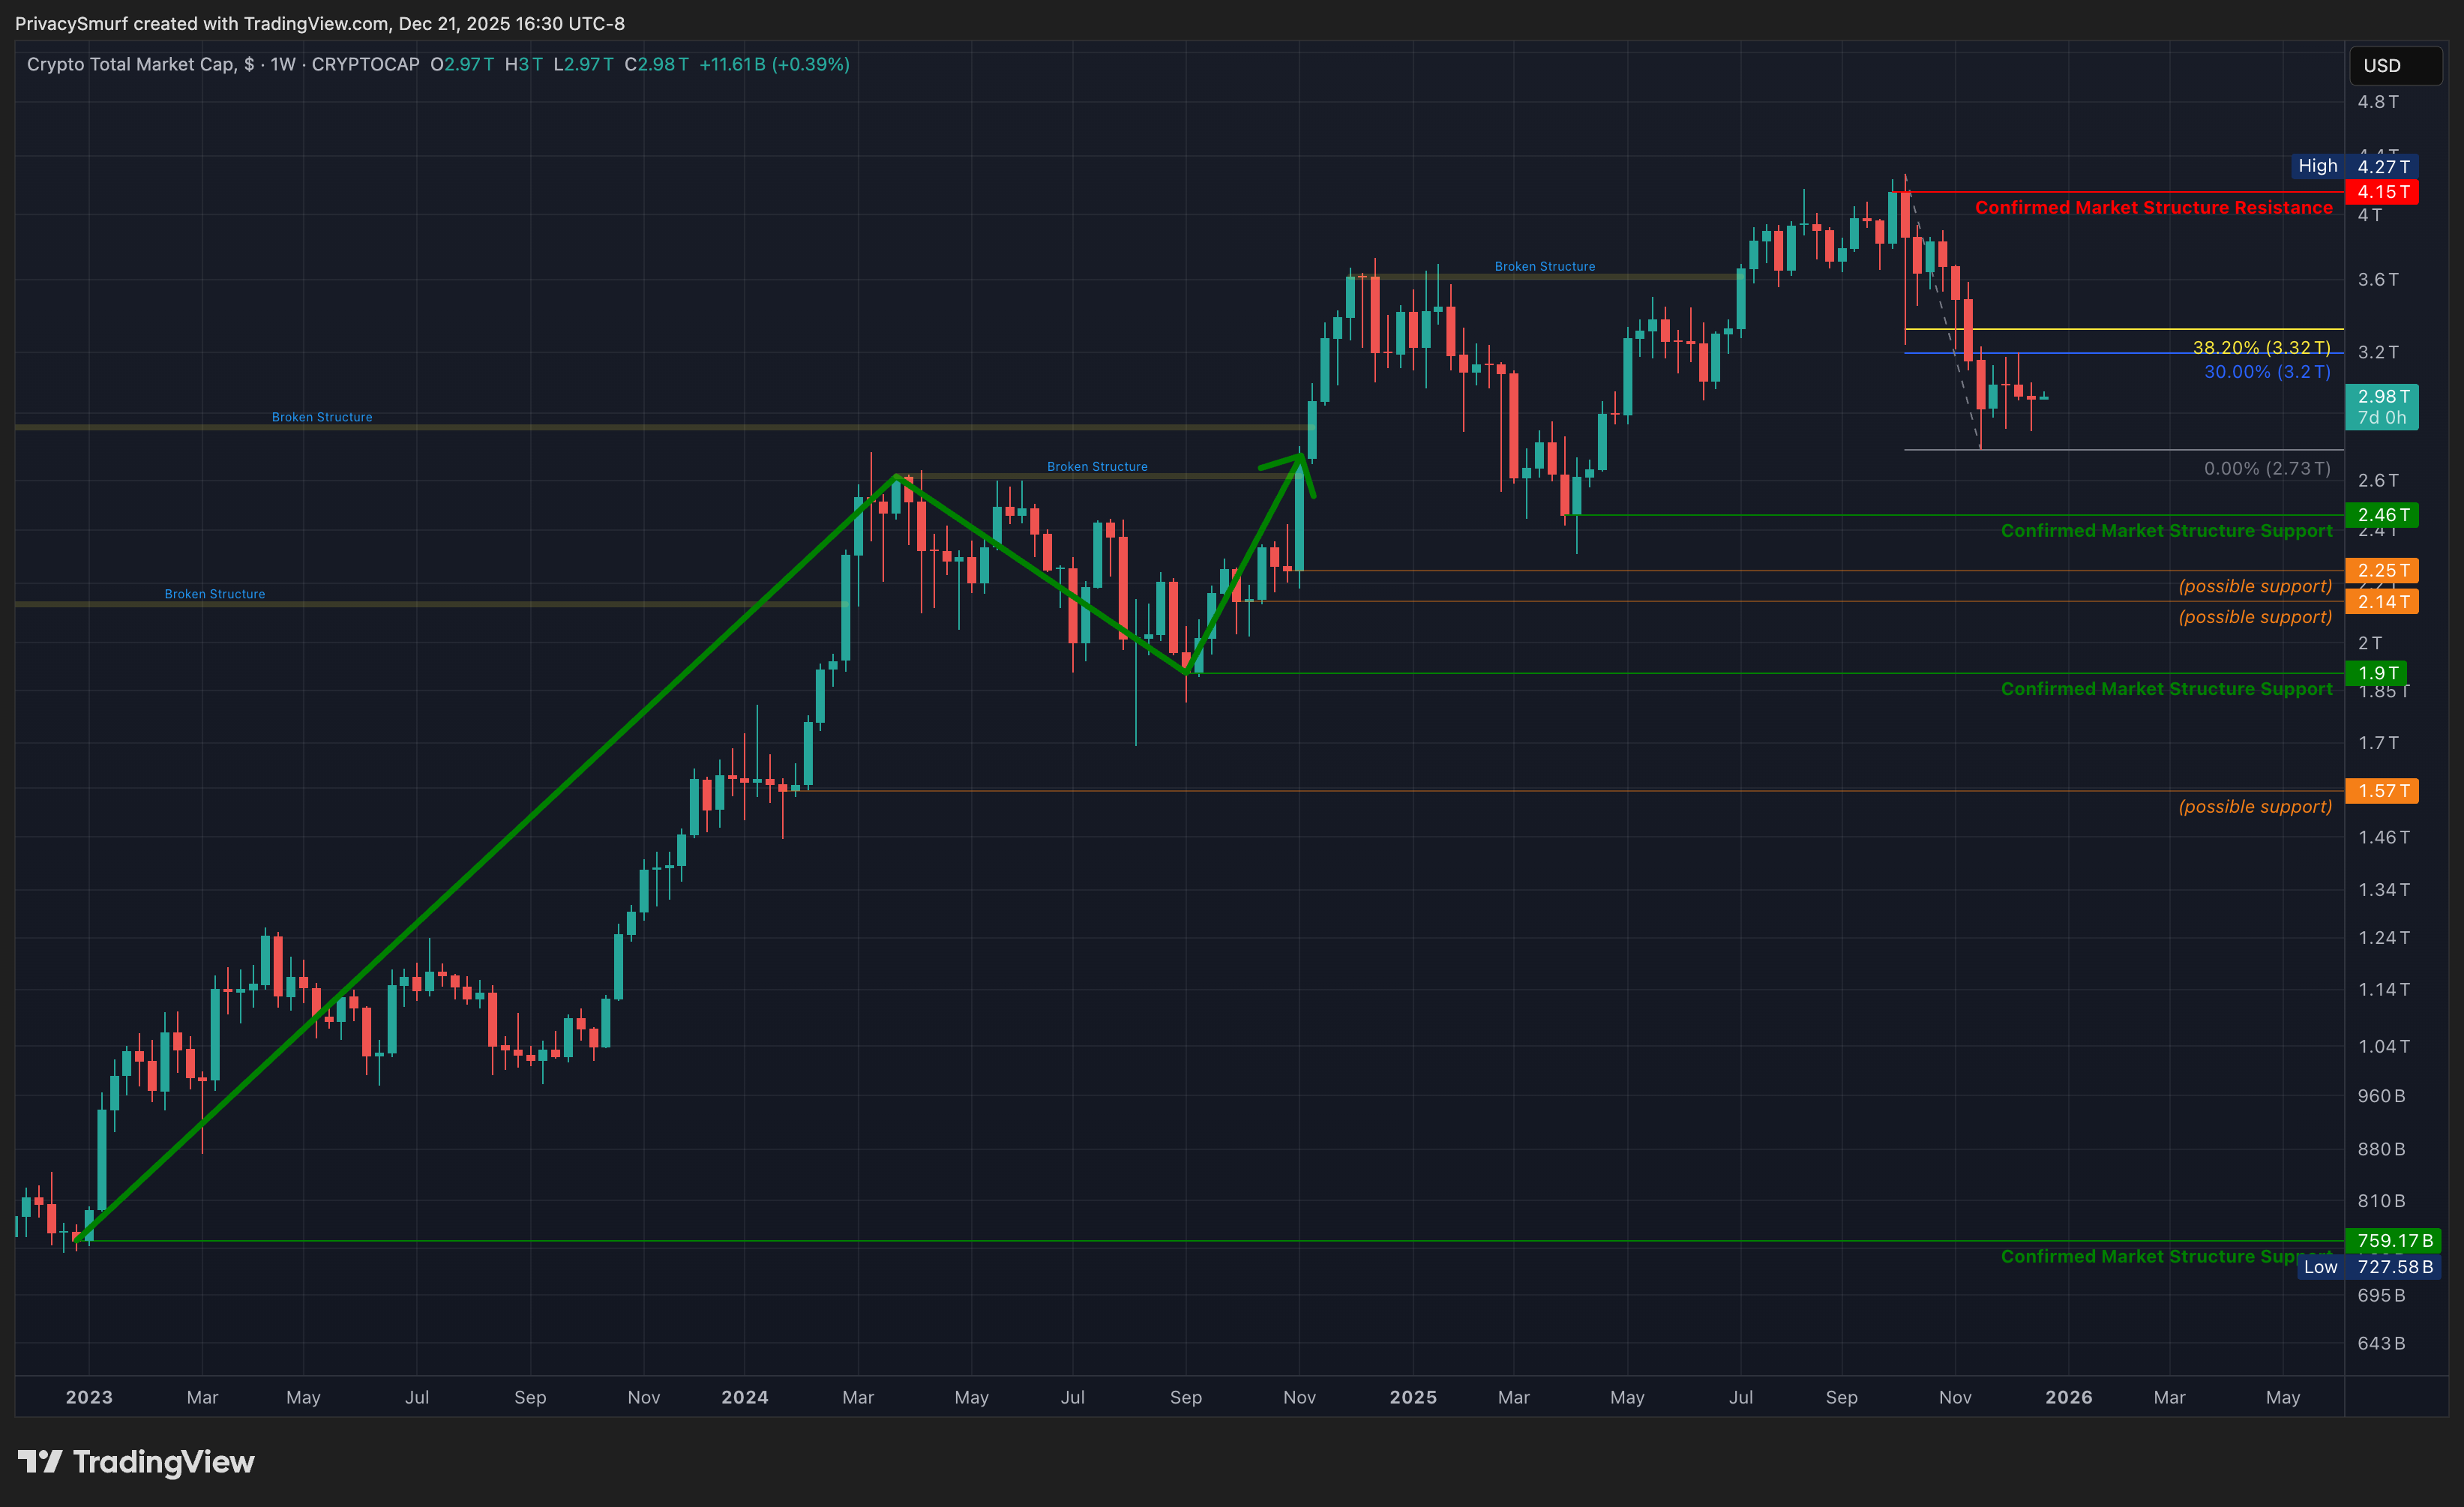
Trend: Bullish. On retracement from the latest ATH.
Key Levels: Resistance at $4.15T. Support at $2.46T.
Confirmation Watch: Awaiting two consecutive bullish candles and a close above $3.32T (at the time of writing) to confirm support.
Potential Scenarios:
Bullish: Market Cap rallies and sets a higher high close above $4.15T. This establishes a traditional bullish trend continuation pattern (MAR low, SEP high, potential higher low here, future higher high later), delaying a shift towards a bearish trend and bear market.
Bearish: Two bullish weeks and a rally above $3.32T would give us structure support at the lowest close. Breaking below that after that support confirmation would flip the weekly trend to bearish as it would create the traditional high, low, lower high, lower low zigzag shape.
2. Total Market Daily Structure
No new changes - Most Recent Update Nov 4, 2025:
(Chart: Link)
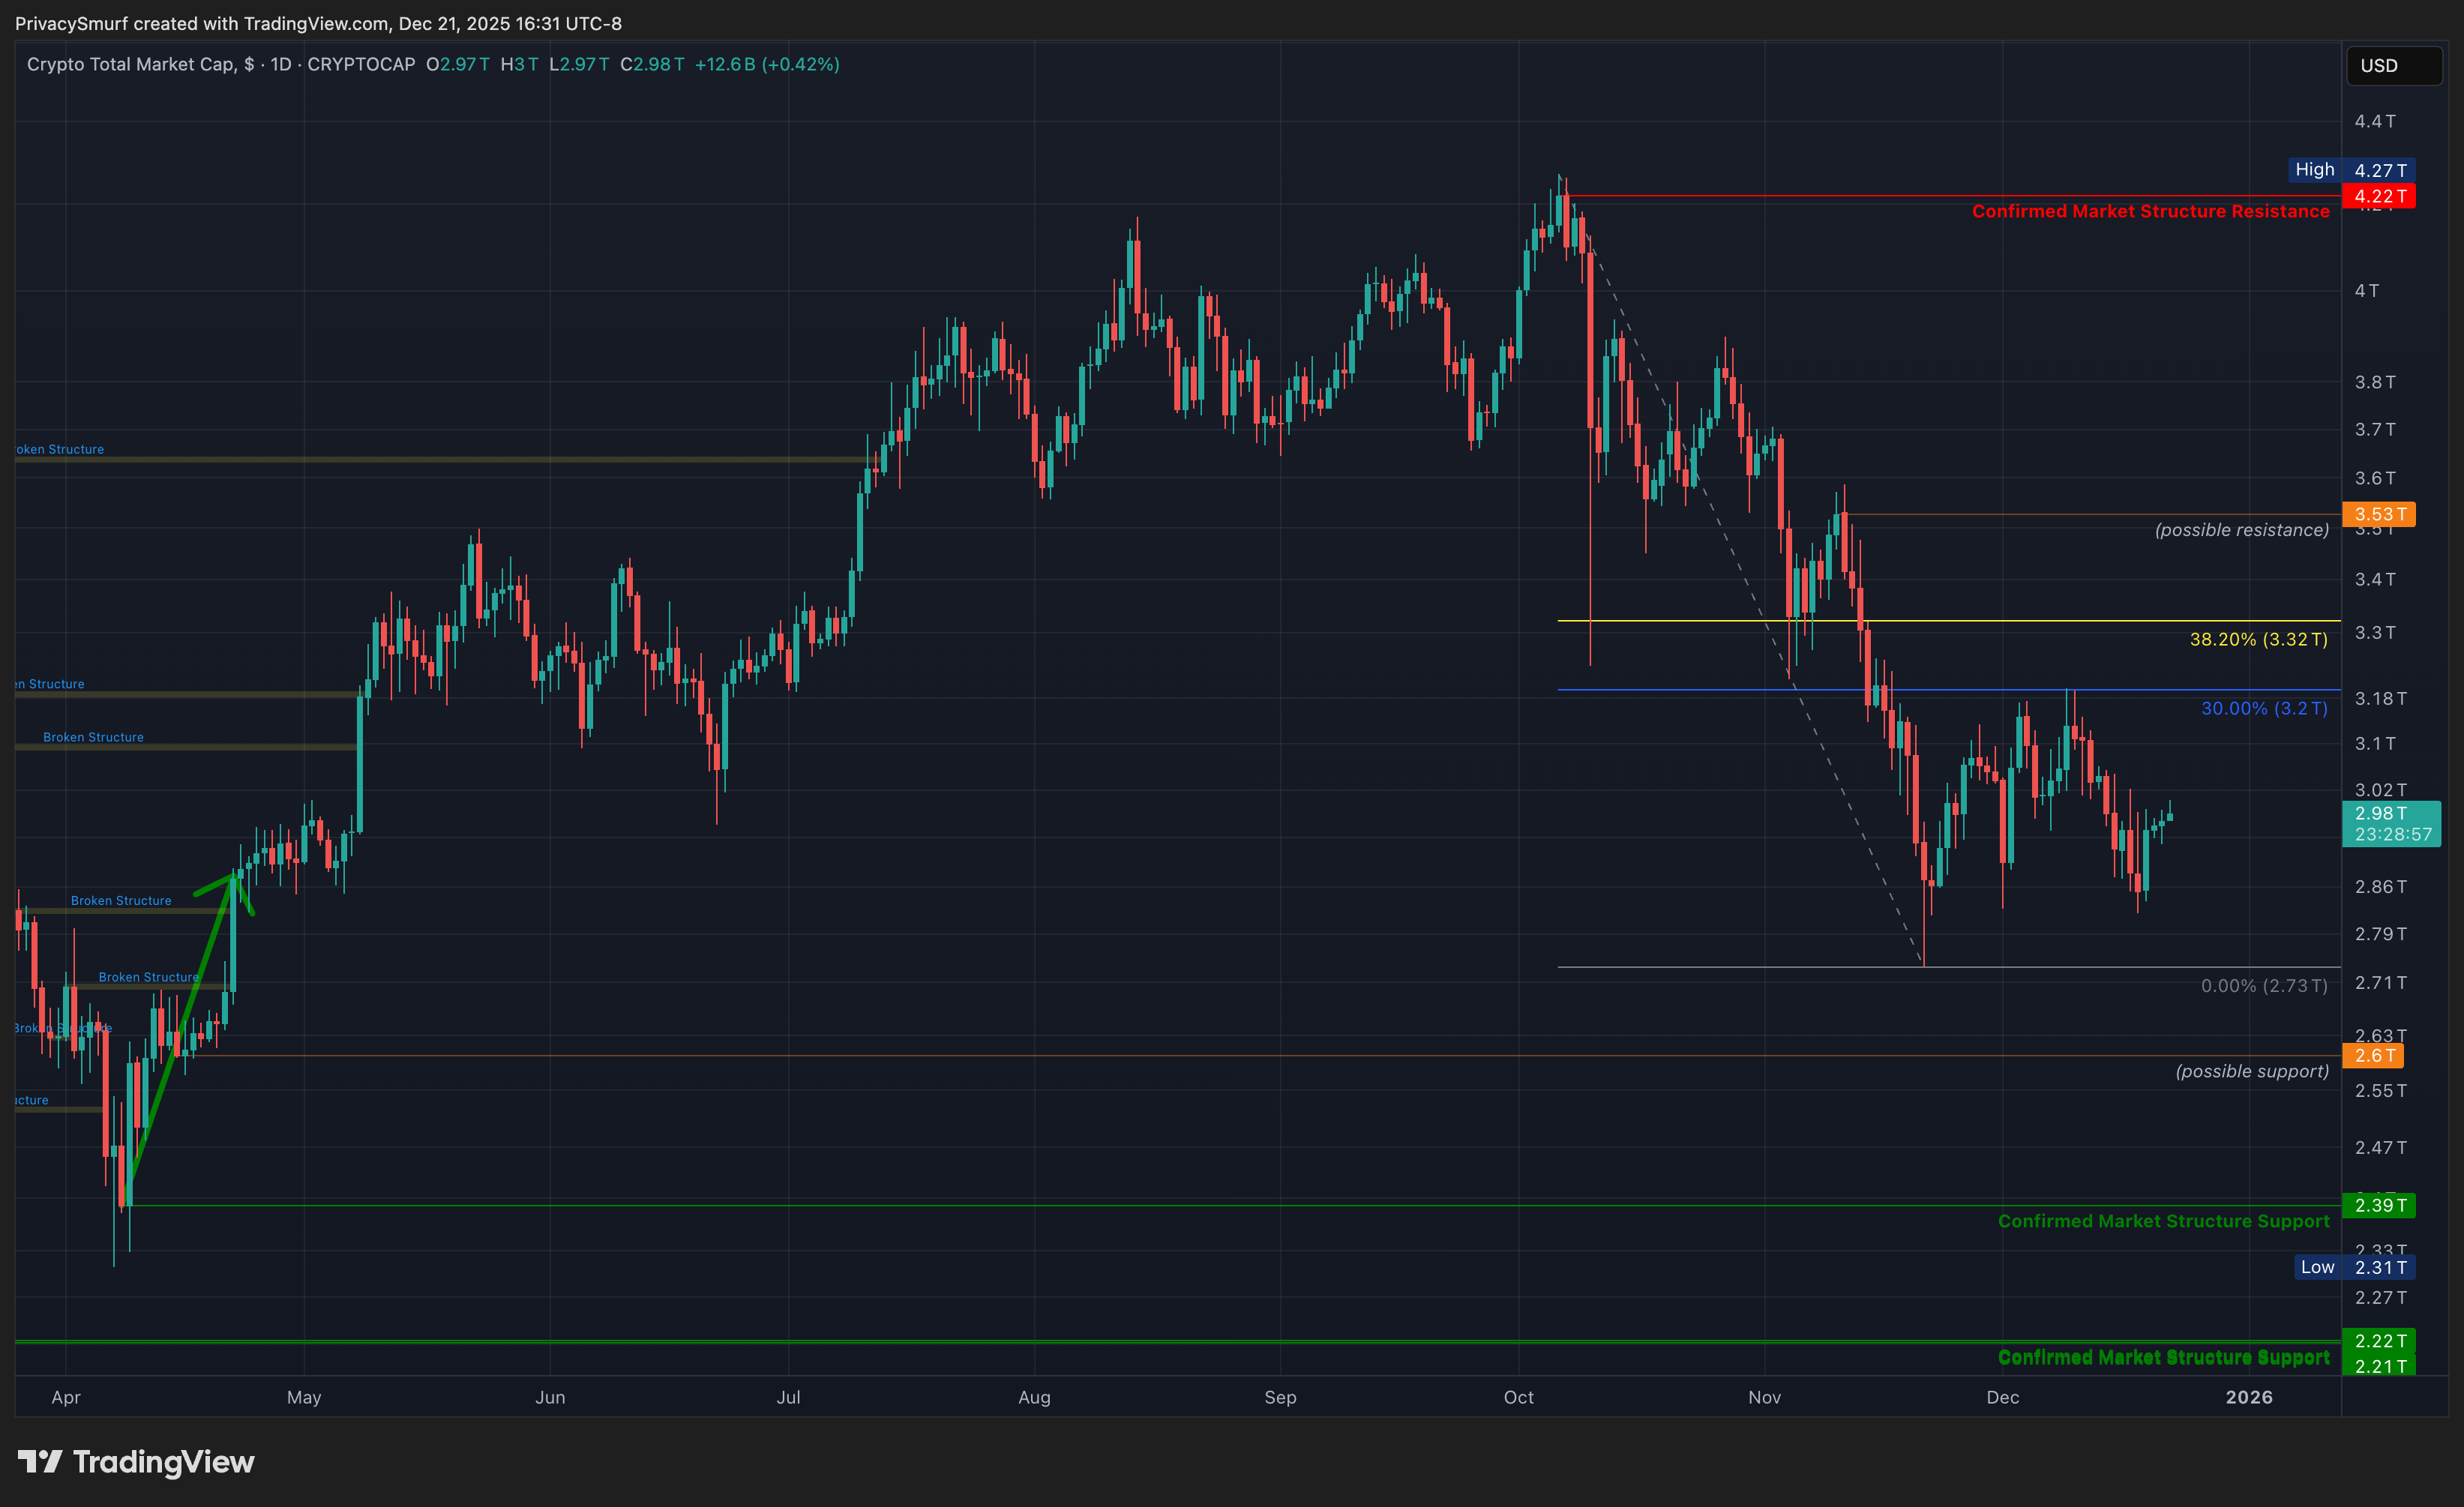
Trend: Bullish. On retracement from the latest ATH.
Key Levels: Potential resistance at $3.53T, Resistance at $4.22T. Potential support at $2.6T. Closest confirmed support is at $2.39T.
Confirmation Watch: Awaiting a close above $3.32T (at the time of writing) to confirm support.
Potential Scenarios:
Bullish: A rally confirming a support would be a step towards making a traditional bullish continuation (APR low, OCT high, potential higher low here, future higher high later), delaying a shift towards a bearish trend and bear market.
Bearish: A rally above $3.62T would give us structure support at the lowest close. Breaking below that after that support confirmation would flip the daily trend to bearish as it would create the traditional high, low, lower high, lower low zigzag shape (OCT high, potential low here, future lower high later, future lower low after that).
3. Crypto Money Flow
No New Changes - Most Recent Update Nov 25, 2025:
(Chart: Link)
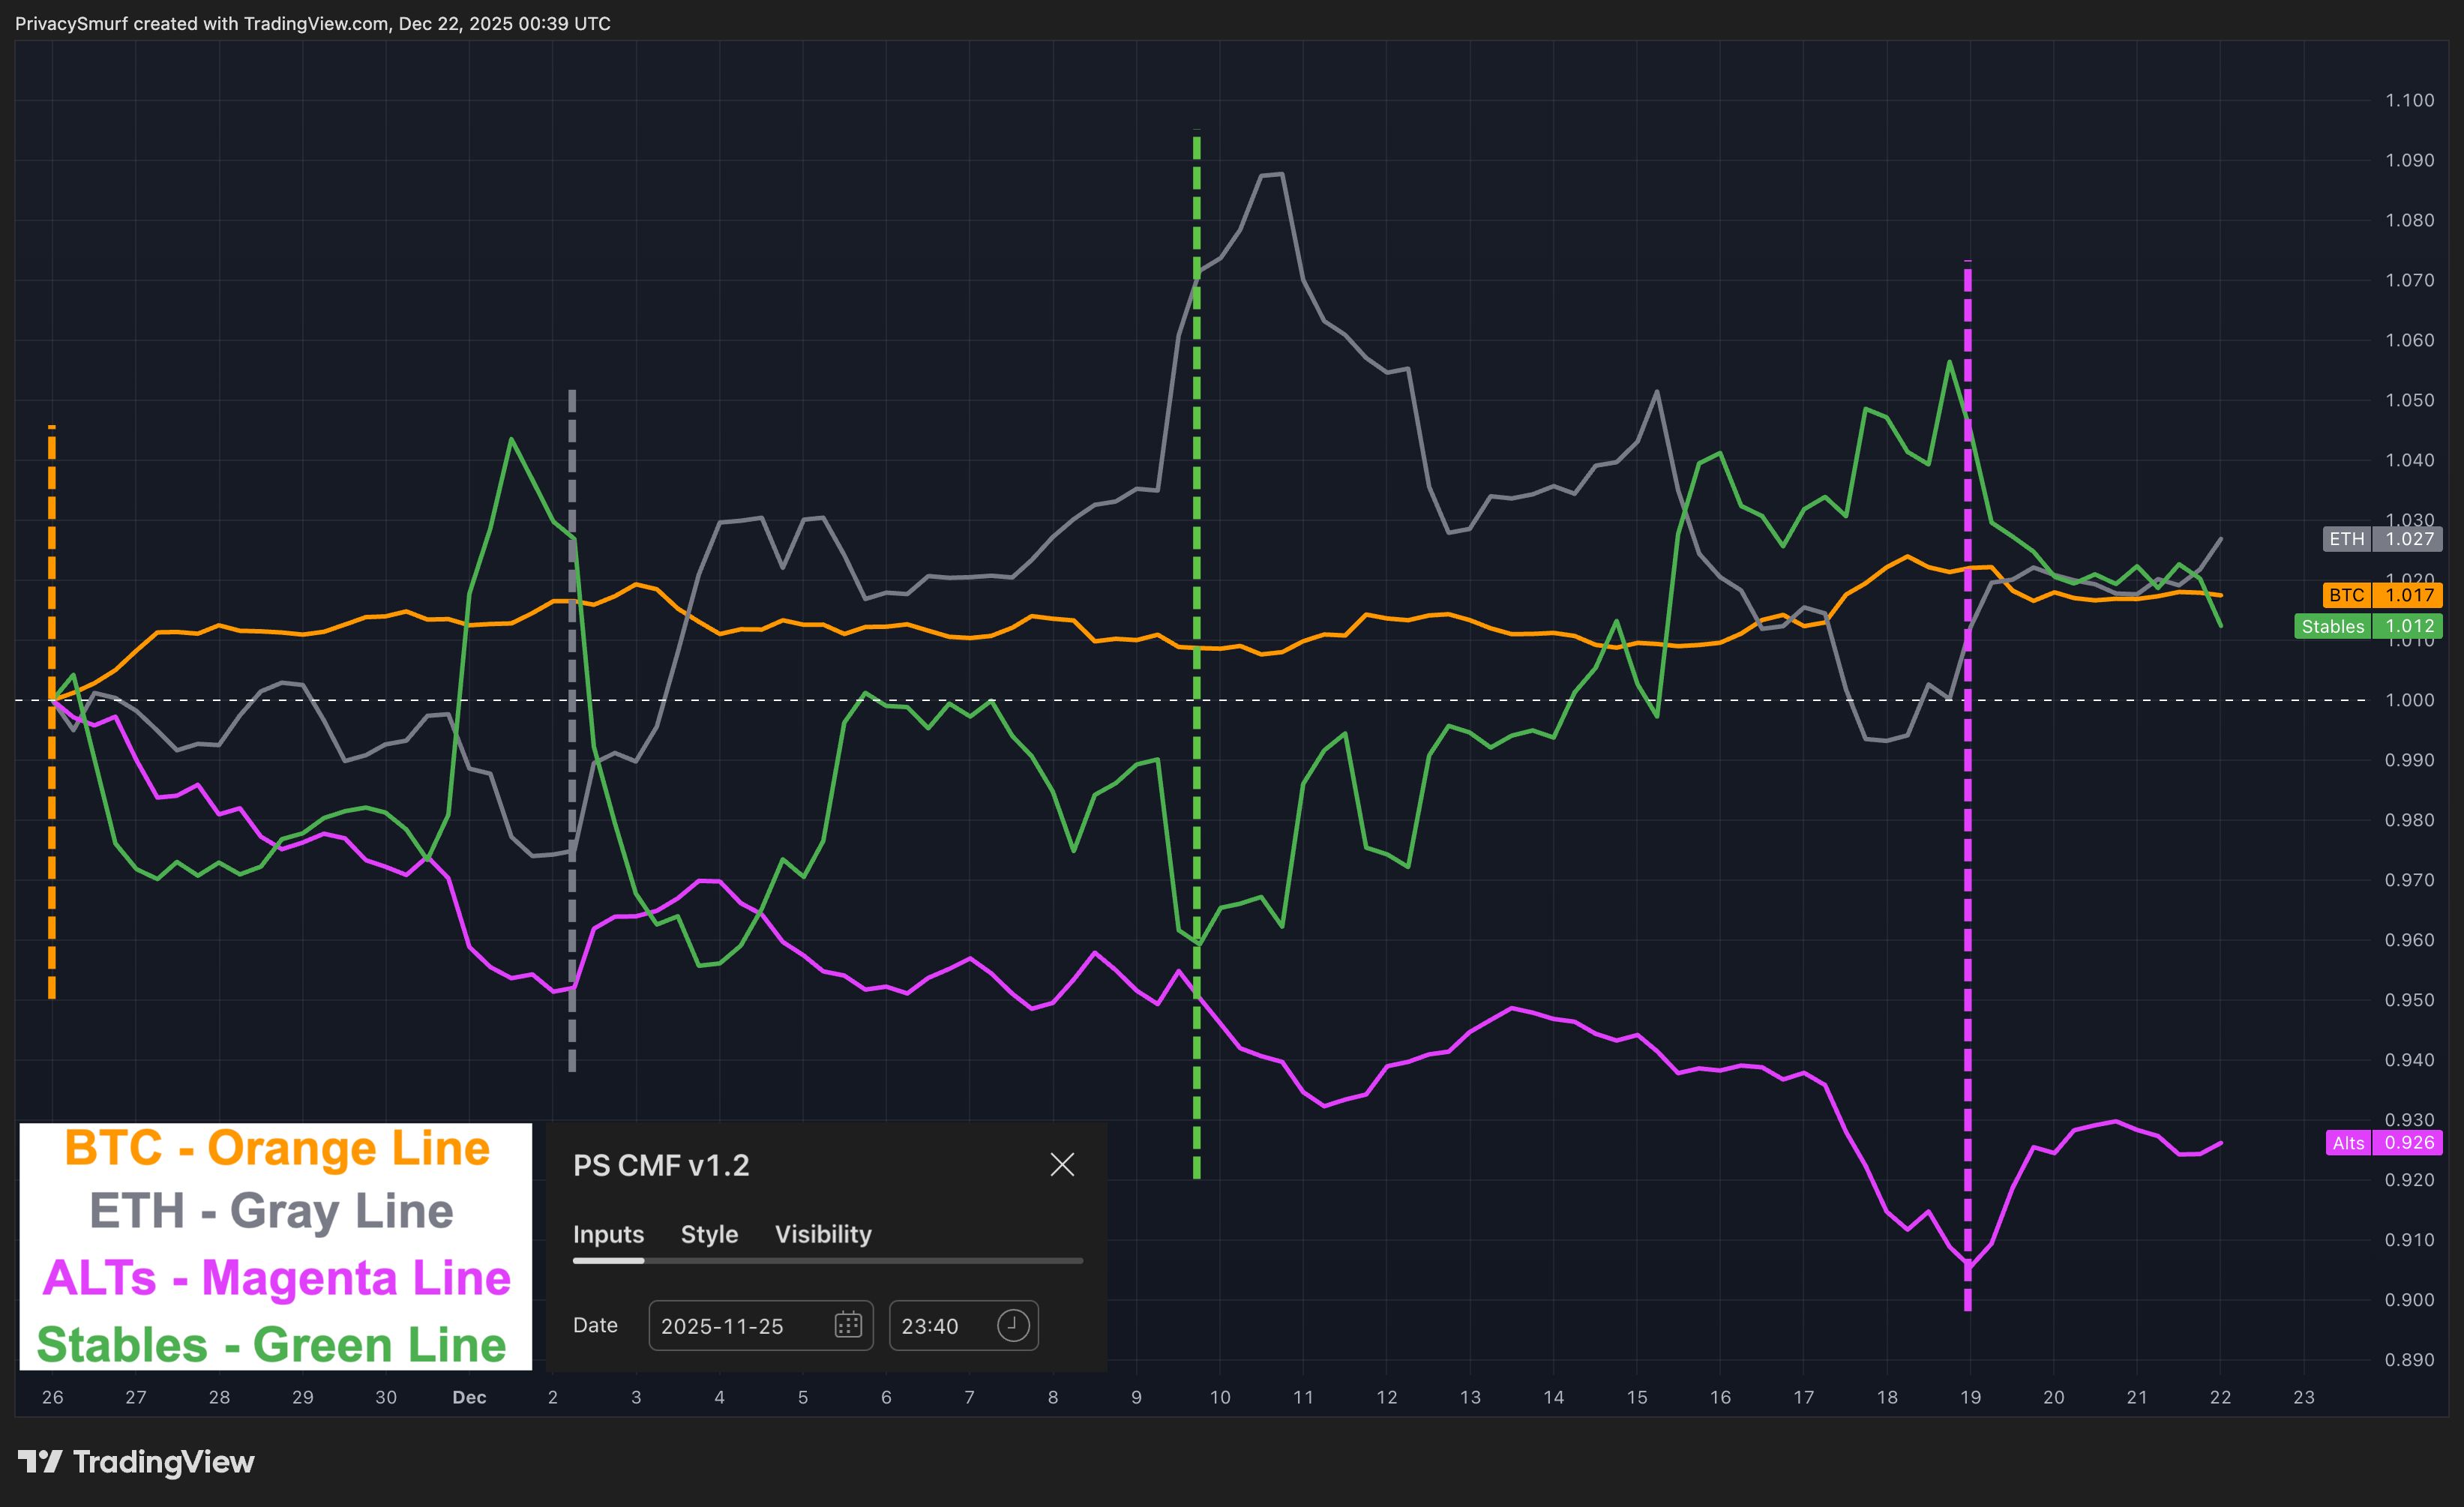
Anchor point: November 25, 2025, 23:40 UTC.
Observation: A fragmented but full rotation is playing out over time. We are in the final stages.
Interpretation: Our starting point still hasn’t changed. From the beginning to the end of the observed rotation, Bitcoin has steadily increased, with minor fluctuations. At the vertical gray dashed line, ETH spiked and has been slowly selling off as the Stables line began to grow. Near the end of the fuchsia vertical dashed line, ALTs and ETH have again started to increase their exposure. The worrisome part is that this could be a bounce into another lower high, followed by a rollover and market downturn.
4. Additional Metrics
Retail Sentiment:
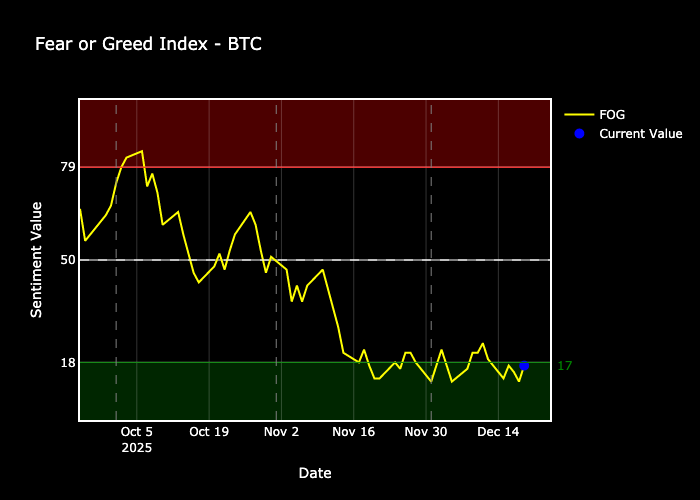
Extremely Fearful. We're still waiting for a bullish trade signal to capitalize on the fear.
Market Validity Score:
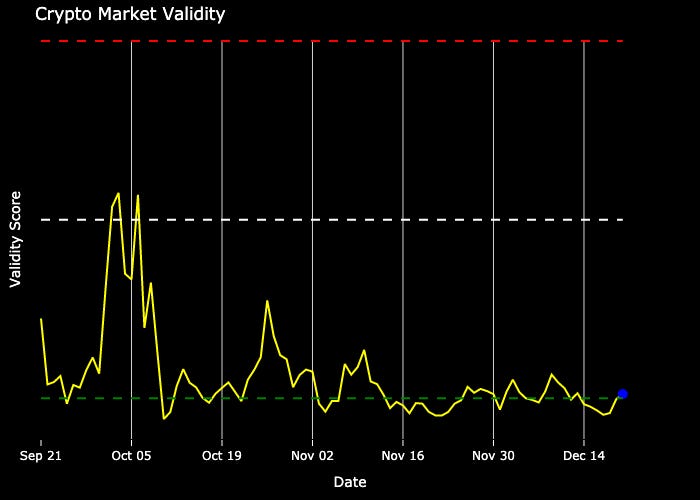
Nearly all crypto assets exhibit a bearish daily pattern. Perpetual bottom finding. DCA opportunities abound.
Market Drivers:
The Market Driver Ratio measures relative performance concentration among the top 100 cryptocurrencies by comparing market-cap-weighted performance with equally weighted performance.
Rising ratio: Indicates a concentrated, large-cap dominated market. This typically reflects risk-off sentiment or Bitcoin/Ethereum leadership. Consider favoring large-cap positions or reducing altcoin exposure.
Falling ratio: Signals broad-based strength and altcoin outperformance. This reflects risk-on sentiment and market expansion. Consider rotating into smaller-cap opportunities.
Watch for turning points or ranges where the ratio changes overall direction or breaks levels. These often indicate shifts in market regime and can signal when to reposition between large-cap and altcoin strategies.
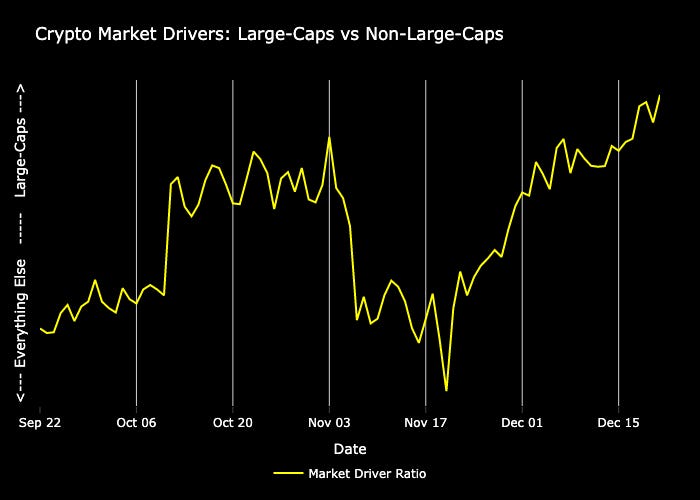
Large caps are still the primary drivers in the market. This is in anticipation of, and a precursor to, a bullish move, IMO. Breaking out on the chart would likely coincide with BTC making a new high after breaking out above $94K. If that doesn’t come this week, the odds increase that my expectation is incorrect and that this is protective movement out of ALTs, with the market turning down.
Click the links below if you need a refresher on the sections above:
@ThePrivacySmurf
PrivacySmurf - is Link for Crypto Money Flow correct? It opens a multiple-timeframe chart that doesn't look like your chart image. Thanks