The price action of the last few days is much more indicative of a standard bullish rotation. Check out the money flow chart. I suggest you follow the link so you can zoom in more than I can provide in a screenshot.
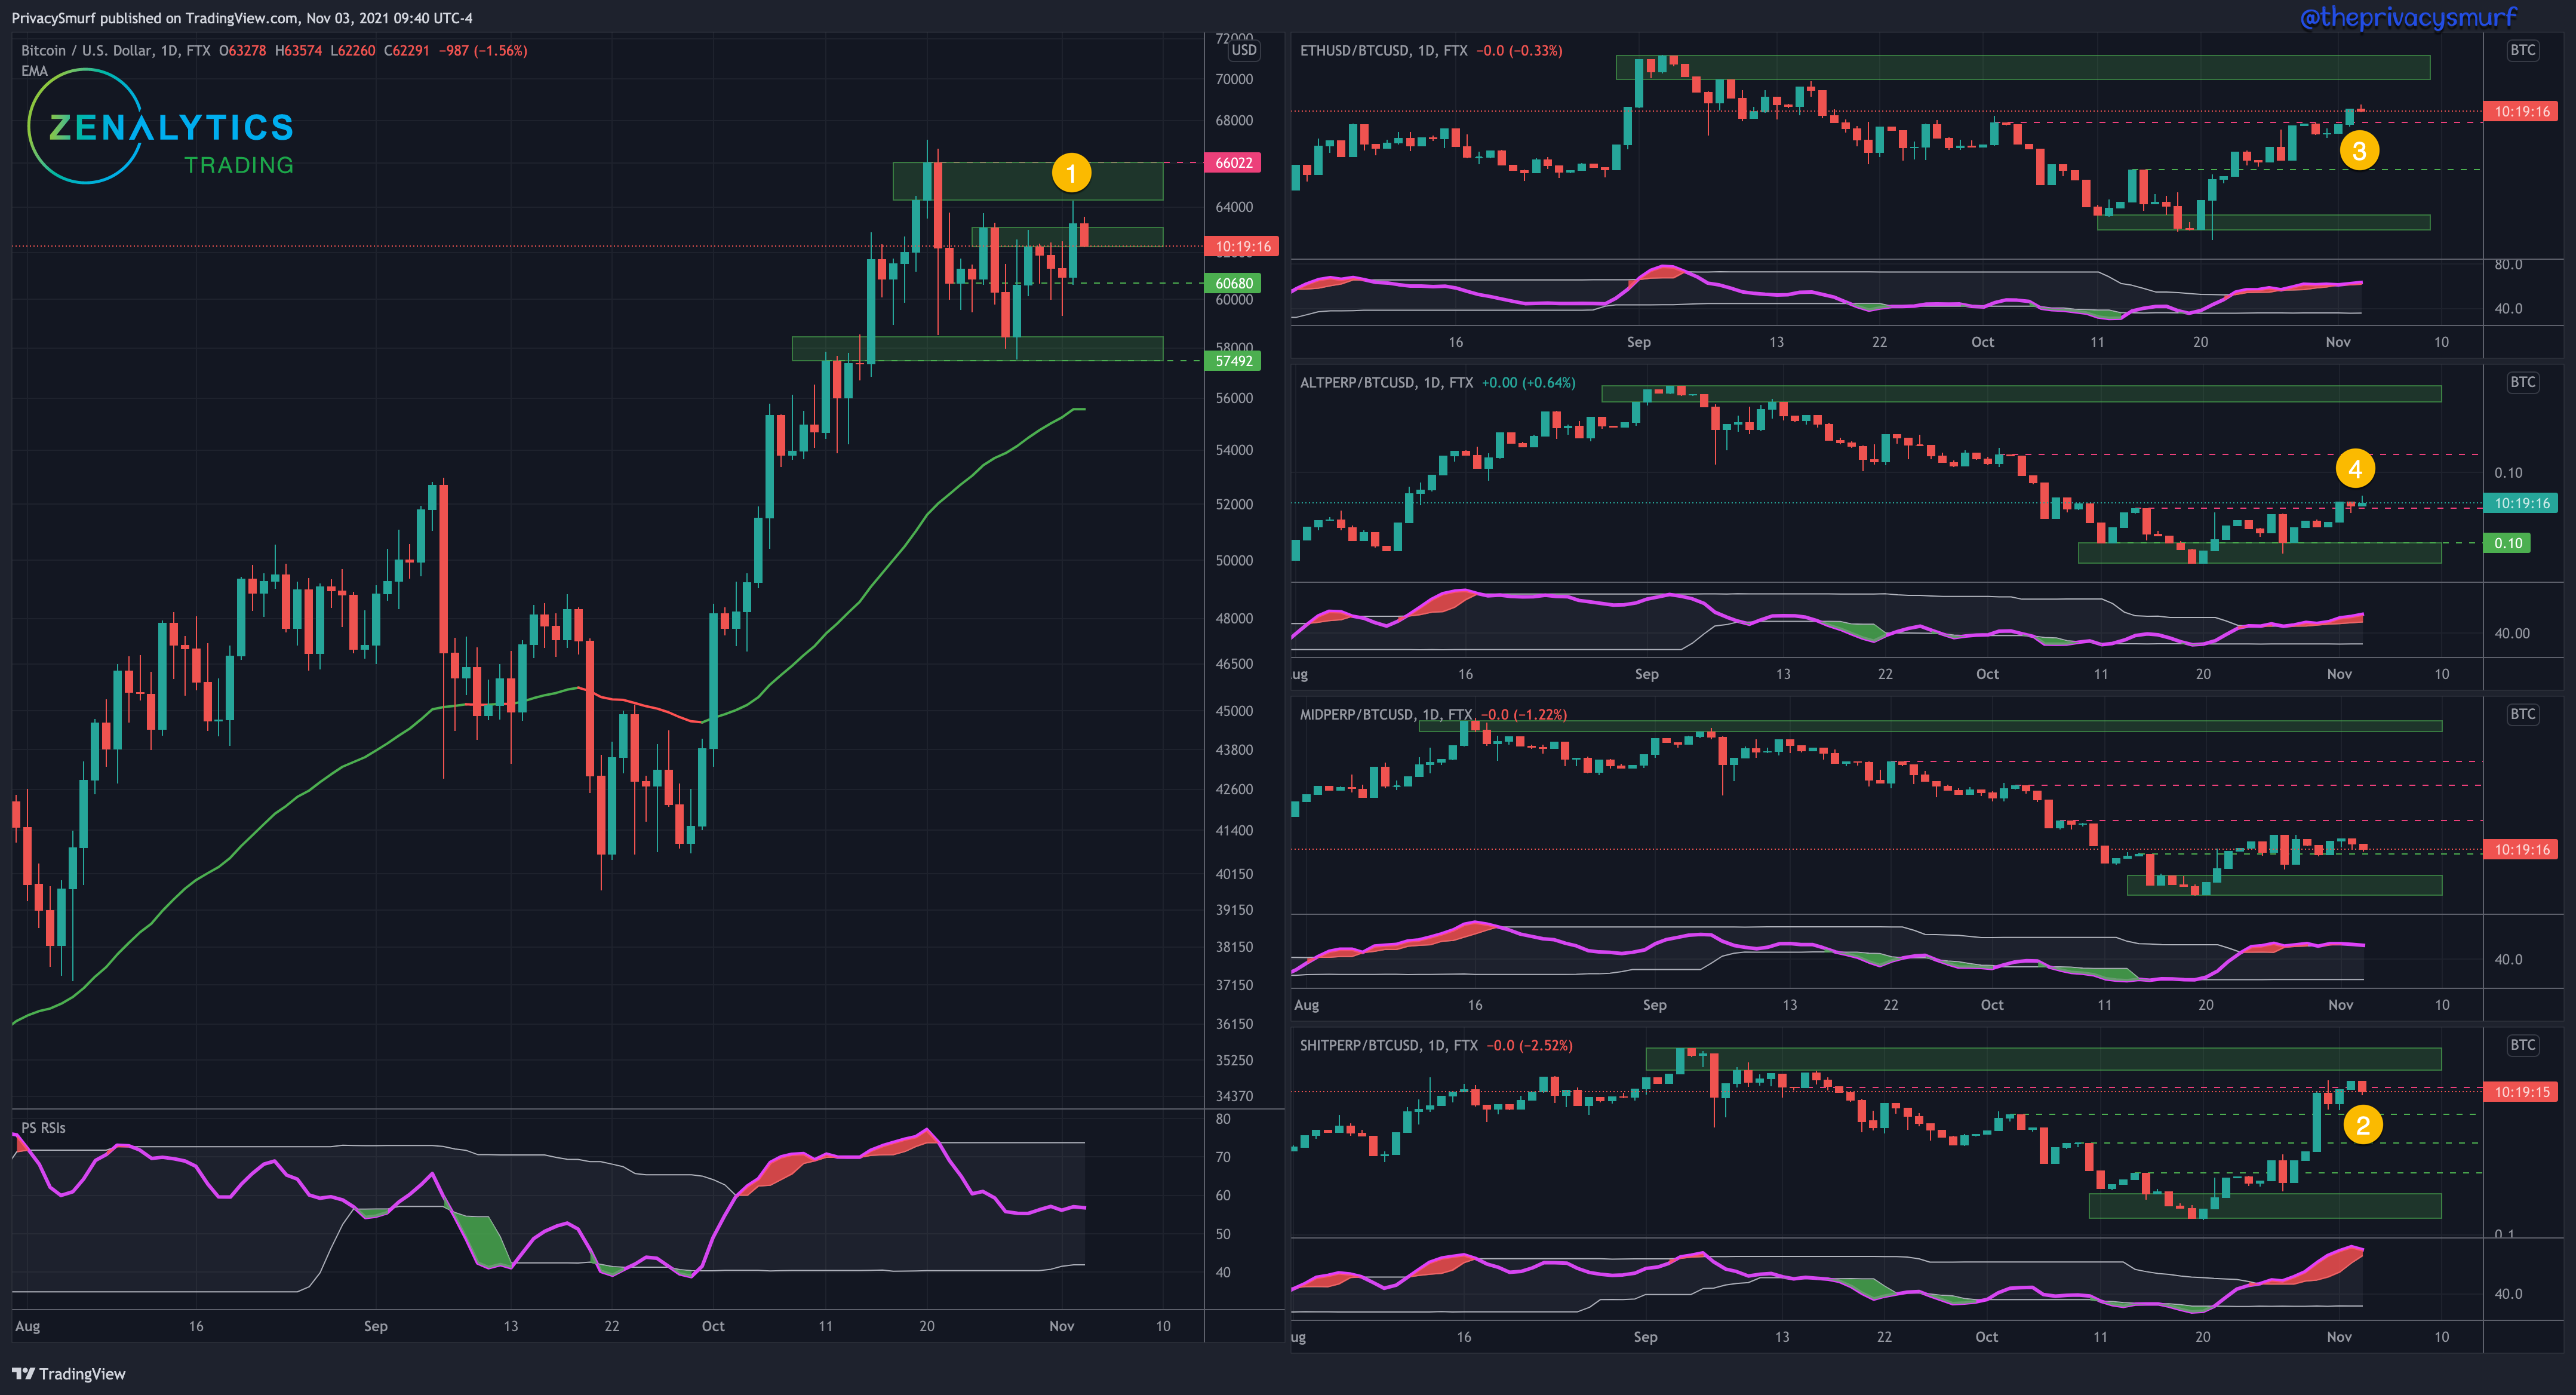
1: End of October and into November BTC was ranging between $60.7k support and $63k resistance and went literally from the bottom through that resistance all in a day on the 2nd.
2:At the same time small-cap altcoins followed BTC price action on the 2nd.
3: At the same time despite BTC going up ETH went up more shown in the ETH/BTC chart on the 2nd and has been gaining since the end of October.
4:On the 3rd ETH and BTC begin a retracement but large-caps show an increase and have also been gaining since the end of October. This is showing profit-taking back into the big fundamental coins. (note SOL ADA and XRP up while all else are down)
This is the type of rotation on a larger scale that creates a technically and fundamentally strong bull rally.
**Side note: As long as we don’t get a daily close below $60911 I think this bullish wave is still preserved. If not things will probably be pushed back some more. For ETH that line in the sand is no lower daily close than $4287**


Thank you very much...🙏🏽🙏🏽🙏🏽!!!