I got into a long and annoying conversation which I won’t go into but I’ll share a graphic here that I also made for them in the process of debate.
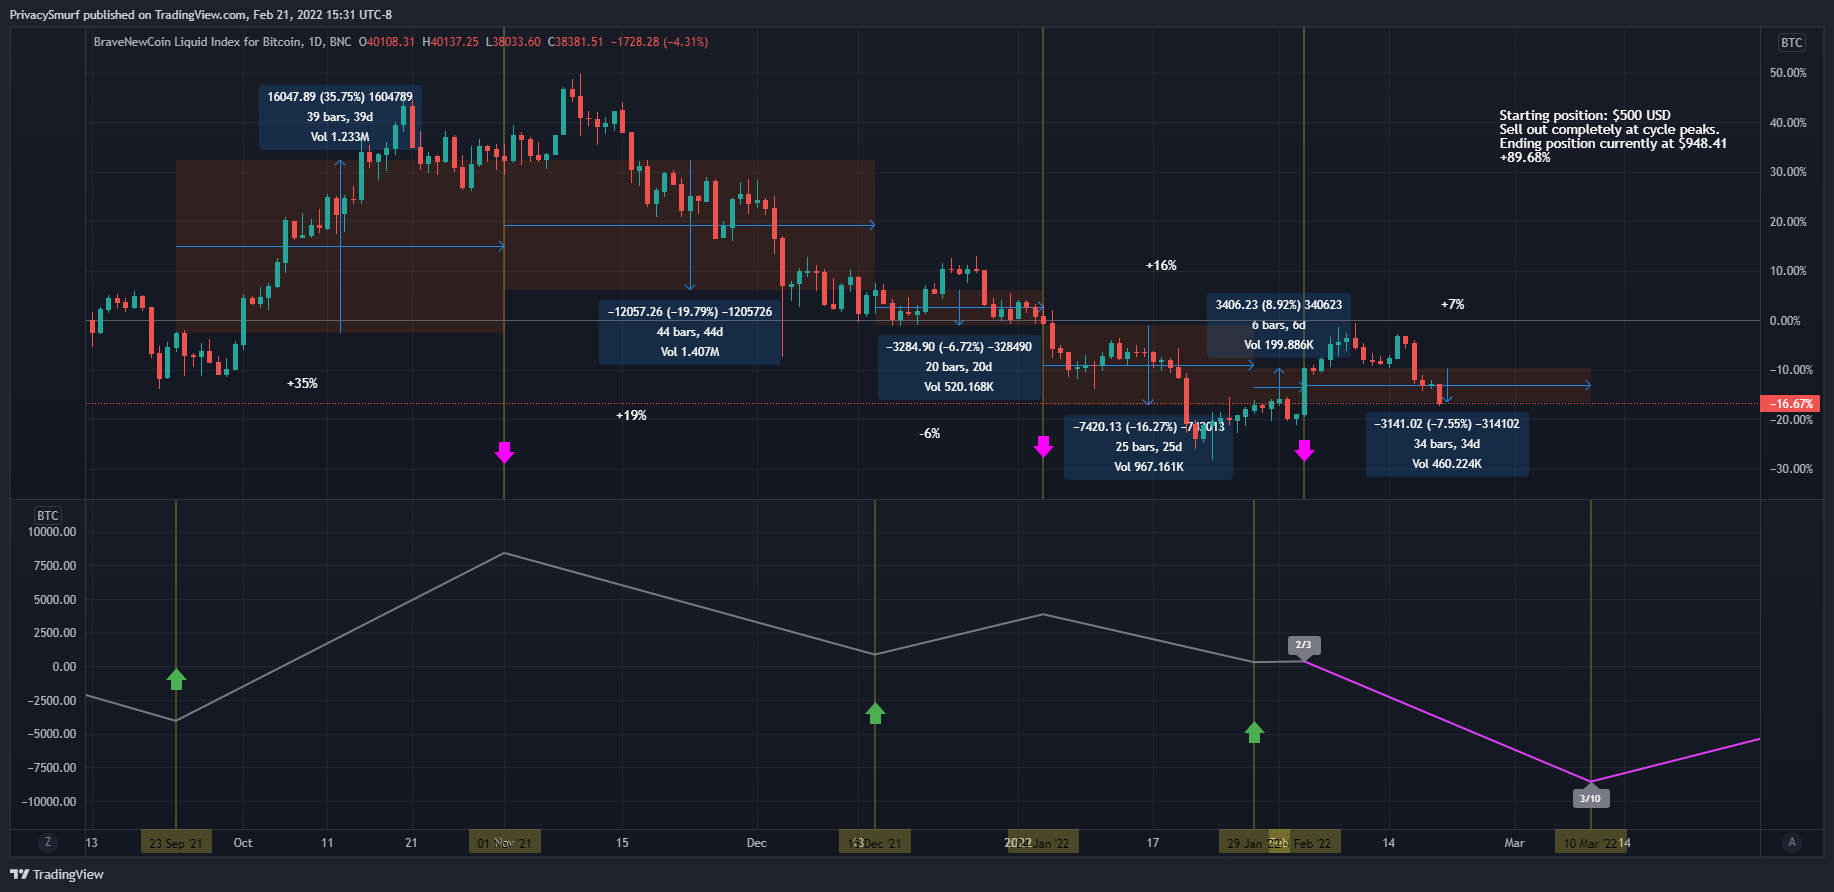
This is the daily cycle from 2021 midQ3 til the present day. I didn’t go all out and get the exact date/times back from the mid Q3 bottom or the Q4 top because it would have taken longer to respond but these are the backdated calendar dates drawn from the Q1 forecast so it’s not 100% accurate, but it still illustrates the point.
The point I was making:
There are forces outside of news and TA that have effects on prices. Not doing any TA or reading one article or listening to any news segments just selling at projected peaks and buying at projected bottoms from each quarterly projection an account would have increased the portfolio by almost 90% with only 1 losing period from mid-December to January. That single loss was also smaller than every other trade win.
Had TA principles been applied on top of the forecasts it would be possible to mitigate that loss and also lock in further gains.
If you find yourself asking the question, ‘Why did (insert asset here) go up/down (insert time period here)?’ just stop. It ultimately doesn’t matter. If you are morbidly curious, sure I guess you can go down the rabbit hole but it won’t help your trading/investing one bit. There is any number of reasons why or why not things occur and we will likely never be able to figure that out completely.
The above shows that you don’t need to spend that time anyways. There are more important things to focus on that will help you more than the whys.
THAT something happened is more important than WHY something happened for your equity curve.
This is not necessarily an advertisement for cycle analysis because there are also other methodologies/systems that do similar types of forecasting. It is more an admonishment of the cause-effect investigation.
I sure appreciate you spending the time to create things like this. I'm learning...but sadly still have to work for a living so not learning as fast as I would like!! Thanks again for your time and superior effort!!
Couldn't understand a thing about what you're saying or the chart, but thanks a million for your kindness to try to explain your insights, you're blessed
Thank you Terry 🙏
I am impressed. That much isn’t new. Lol. But man I 2nd your saintly patience. To create that whole chart just for a teachable moment…phew! Love it
That's amazing Terry! Sure beats the buy high sell low model I used to follow!
Terry …you have such patience. God bless you . Dismiss the those conversations .