


Synthesis Accuracy Report: Q1 2025
Forecasts showed a measurable edge over randomness.

This report is part of a broader commitment to hold my analysis accountable, quantify uncertainty, and empower readers like you with tools to critically assess my models' strength and reliability. It’s not just about how often I’m right. It’s about how well-calibrated my confidence is regarding the risks and probabilities involved. I explore this concept of calibration in forecasting in the post below.

What is the Brier Score?
The Brier Score is a statistical measure of forecast accuracy for probabilistic events. It evaluates how closely a forecast’s predicted confidence matches the actual outcome.
The score ranges from 0 to 1, where:
• 0.00: Perfect probabilistic accuracy.
• 0.01–0.10: Excellent calibration; the forecast probabilities closely match the observed occurrences.
• 0.11–0.20: Very good calibration; the forecast is generally reliable and aligns well with actual outcomes.
• 0.21–0.30: Moderate skill, the forecast has some predictive power.
• >0.30: Poor calibration or unreliable confidence; the forecast is no better than random guessing.

The key point:
A lower Brier score means the forecast’s confidence matched reality more often. If I said a market move had a 70% chance and happened roughly 7 out of 10 times, that’s considered calibrated. If I said 90% but was right, only 50% of the time? That’s overconfidence, and it would show in a higher Brier score.
What’s Being Forecasted
The foundation of this model is cyclical pattern forecasting, a technique that projects the timing of future highs and lows based on dominant market rhythms. Instead of forecasting general trend directions or issuing blanket buy/sell signals, the model maps out cyclical turning points and evaluates whether the price at a projected peak or trough will be higher or lower than the previous one.
In other words, it’s not simply asking, “Will the market turn here?” It’s asking, “Will the next cyclical peak close at a price higher than the current trough? Will the next cyclical trough close at a price lower than the current peak?”
Each model is assigned a confidence score, quantifying how strongly I expect each turning point to align with a higher or lower close.
Why This Matters
I’m trying to hold myself to a higher standard, one where predictions are measurable, reviewable, and held accountable. Each forecast is judged by what happened and how likely I said it was in the first place.
That’s how trust is built—not through cherry-picked charts but by rigorous, transparent evaluation of hits and misses.
Methodology Overview
For a quick review, a successful turning point prediction was based on the cycle model, measured within a defined turning point window. This window represents a range of days that encompasses the 15% of days centered around a forecasted peak or trough.
For example, if there are 100 days from one cycle peak to the next, the turning point window for the forecasted cycle low between those peaks would span 15 days. During this window, I would assess the lowest close to the highest close within the middle 15% range from each cycle low to the subsequent cycle low. This approach allows for precisely evaluating directional reversals relative to the model.
Let’s get into the numbers…
Here are the results for the Q1 report.

🟩 Combined Results:
→ Brier Score: 0.2392
→ Efficiency: 67.74% (21 out of 31 turns)
📣 Interpretation Summary:
🔹 Brier Score: 0.2392 → Moderate skill - forecasts show a measurable edge over randomness.
🔹 Efficiency: 67.74% → Strong directional edge - consistent forecast accuracy.
The system achieved a composite Brier score of 0.2392 (okay), reflecting moderately strong probabilistic calibration. Its overall directional efficiency was 67.74%, capturing 21 of 31 turning points.
These figures reflect a moderate accuracy in probabilistic forecasting. While not perfect, my process demonstrates a consistent edge over random guessing. The directional efficiency metric near 68% confirms a strong alignment between high-confidence forecasts and actual market pivots.
🟩 Individual Results:
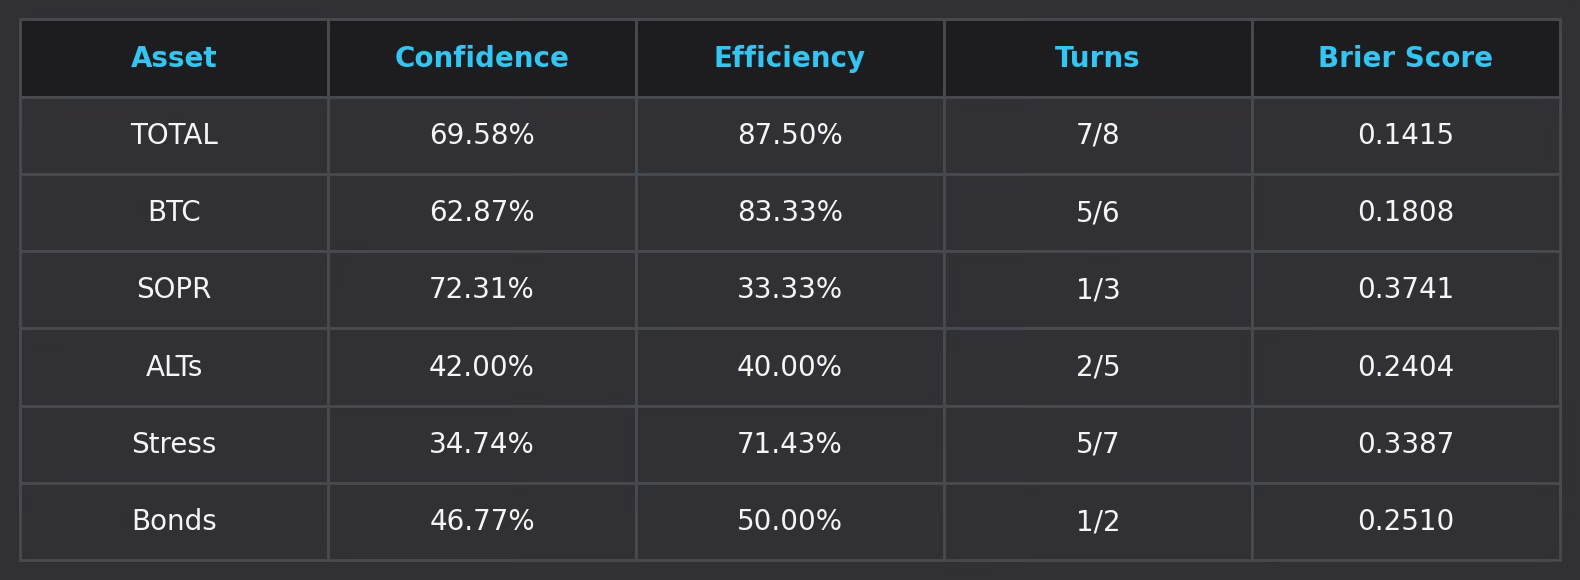
While the overall result was okay, the individual forecasts for BTC and Total MarketCap strongly aligned with actual market reversals, producing good Brier scores. At the same time, SOPR and ALTs underperformed relative to their confidence levels. The Stress Composite and Bonds displayed efficient directional signals despite lower confidence, suggesting a potential hidden edge in these models.
Forecasting Performance by Asset
• Total MarketCap: Best-performing asset overall. High efficiency and the lowest Brier score suggest very strong model accuracy.
• BTC: High alignment between forecast and actual turns. The forecast was confident and accurate, with a low Brier score suggesting good calibration.
• SOPR: Overconfidence noted. While forecasts were highly confident, real-world turns were missed. Requires recalibration.
• ALTs: Low-confidence, low-efficiency asset. Possibly due to higher volatility or weaker signal-to-noise ratio, more data or revised metrics are needed.
• Stress Composite: Outperformed its confidence. Despite a modest 34.74% confidence, it delivered 71.43% efficiency.
• Bonds: A mixed performer. Moderate confidence with average efficiency. Fewer forecasted turns limit statistical significance.
Calibration Insights
• SOPR significantly underperformed versus its confidence rating, which showed a degree of overconfidence in signal quality. Historically, the SOPR model has experienced regular phases of inaccuracy, but it's been generally consistent over time. This may be one of those current phases. I plan to analyze historical data to identify patterns correlating with low-accuracy periods. This could provide insights into when to trust or question the forecasts from this model.
• Stress and Bond exhibited underconfidence. While low in confidence, their forecasts performed above expectations in directional accuracy. It’s too soon to say if I must adjust my settings to assess confidence in these models.
• Due to persistent underperformance, I will consider excluding or deprioritizing ALTs in the composite metrics. A more rigorous analysis will help determine if their historical volatility significantly affects the overall model effectiveness.
• For assets with fewer detected turning points, it may be necessary to consider including weaker cycles. Gathering additional turning point data may enhance the reliability of confidence metrics, providing a more robust basis for future forecasts.
The Q1 2025 results confirm that my process and analysis provide a meaningful edge in forecasting market turning points, especially for BTC and the crypto market capitalization. However, discrepancies between confidence and performance in assets like SOPR and ALTs suggest areas for refinement. Strategic recalibration is expected to enhance the robustness and consistency of forecasts moving forward.
Stay tuned for the Q2 report!
@ThePrivacySmurf