


TT: Trend Identification
Just go with the flow.

Here’s the next installment in the educational series. Here’s where we are, and before long, you’ll have all the foundational elements you need to build your trading brick house.

Acknowledging the trend will help you know ‘what’s going on.’
If I got a penny for every time I heard "the trend is your friend," I would stop trading. Likewise, if I were given a nickel for every time I listened to a trader use the phrase and then showed me a chart of a countertrend trade they were planning, we could both stop trading.
Over the years, I've learned that trend identification remains one of the most powerful tools for increasing your probability of profitable trades. However, it's also one of the most misunderstood concepts among novice traders. Let me share what I've learned about truly understanding and applying trend analysis to your trading decisions.
Why Trend Identification Matters
I like to think of trends as a river current. You can't control it, but you can position yourself to drift with it or power through against it. Going with the flow will get you to your destination faster and with less stress. Swimming against the current, while sometimes necessary, requires significantly more energy and carries a higher risk of exhaustion.
The beauty of trend identification lies in its ability to align your trades with the market's natural momentum. When you trade with the trend, you're essentially letting the market do the heavy lifting. However, it's crucial to understand that trends aren't infallible; they can and will reverse, sometimes violently. That's why we need multiple methods to confirm our analysis and manage our risk accordingly.
Understanding the Fractal Nature of Trends
Before diving into identification methods, let's address a critical concept that confuses many traders: trends are relative and fractal. A daily chart trend can be bullish, while a 2-hour chart trend can and will flip multiple times to create the candles on the daily chart. This isn't a contradiction; it's the natural structure of markets.
Think of market trends like a long road trip. The overall direction of your journey might be north (daily chart trend), but along the way, you’ll have to make countless turns—right, left, even temporary detours (2-hour chart trends). You might even get caught in traffic or backtrack for gas, but these small changes don’t contradict your ultimate destination. If you only focus on the small changes, you may lose sight of the bigger route.
Understanding this relationship helps you avoid the common trap of analysis paralysis, where traders waste valuable time jumping between timeframes trying to find the clearest picture.
The Timeframe Alignment Strategy
To navigate this complexity, I use a simple but effective rule that helps maintain perspective while trading. The key is ensuring your trades align with the dominant trend of a higher timeframe. Here's my proven framework:
The 6x Timeframe Rule:
Multiply your trading timeframe by 6 to determine your trend bias timeframe. This ratio provides enough separation to filter out noise while staying relevant to your trading horizon.
For the 20-minute timeframe, use the 2-hour as your bias (20min × 6 = 120min or 2HR)
For the 2-hour, use the 12-hour as your bias (120min × 6 = 720min or 12HR)
For the 4-hour, use the Daily as your bias (240min × 6 = 1440min or 1 Day)
Daily chart trades should align with the weekly trend
Why does this work? The 6x multiplier creates sufficient distance to see the "forest through the trees" without losing touch with your actual trading timeframe. It filters out the market noise that causes false signals while keeping you synchronized with the dominant market direction.
Three Methods of Trend Identification
I categorize trend identification into three distinct approaches: Structural, Indicator, and Oscillator. Each has its strengths and limitations, and the most robust analysis combines elements from all three.
Method 1: Structural Trend Analysis
Structural analysis forms the foundation of trend identification. It's based on the fundamental principle of how markets move in waves.
Key Concepts to Understand:
Support: A price level where buying interest is strong enough to overcome selling pressure, causing prices to bounce higher
Resistance: A price level where selling pressure overcomes buying interest, causing prices to reverse lower
Retracement: A temporary reversal in price that goes against the prevailing trend
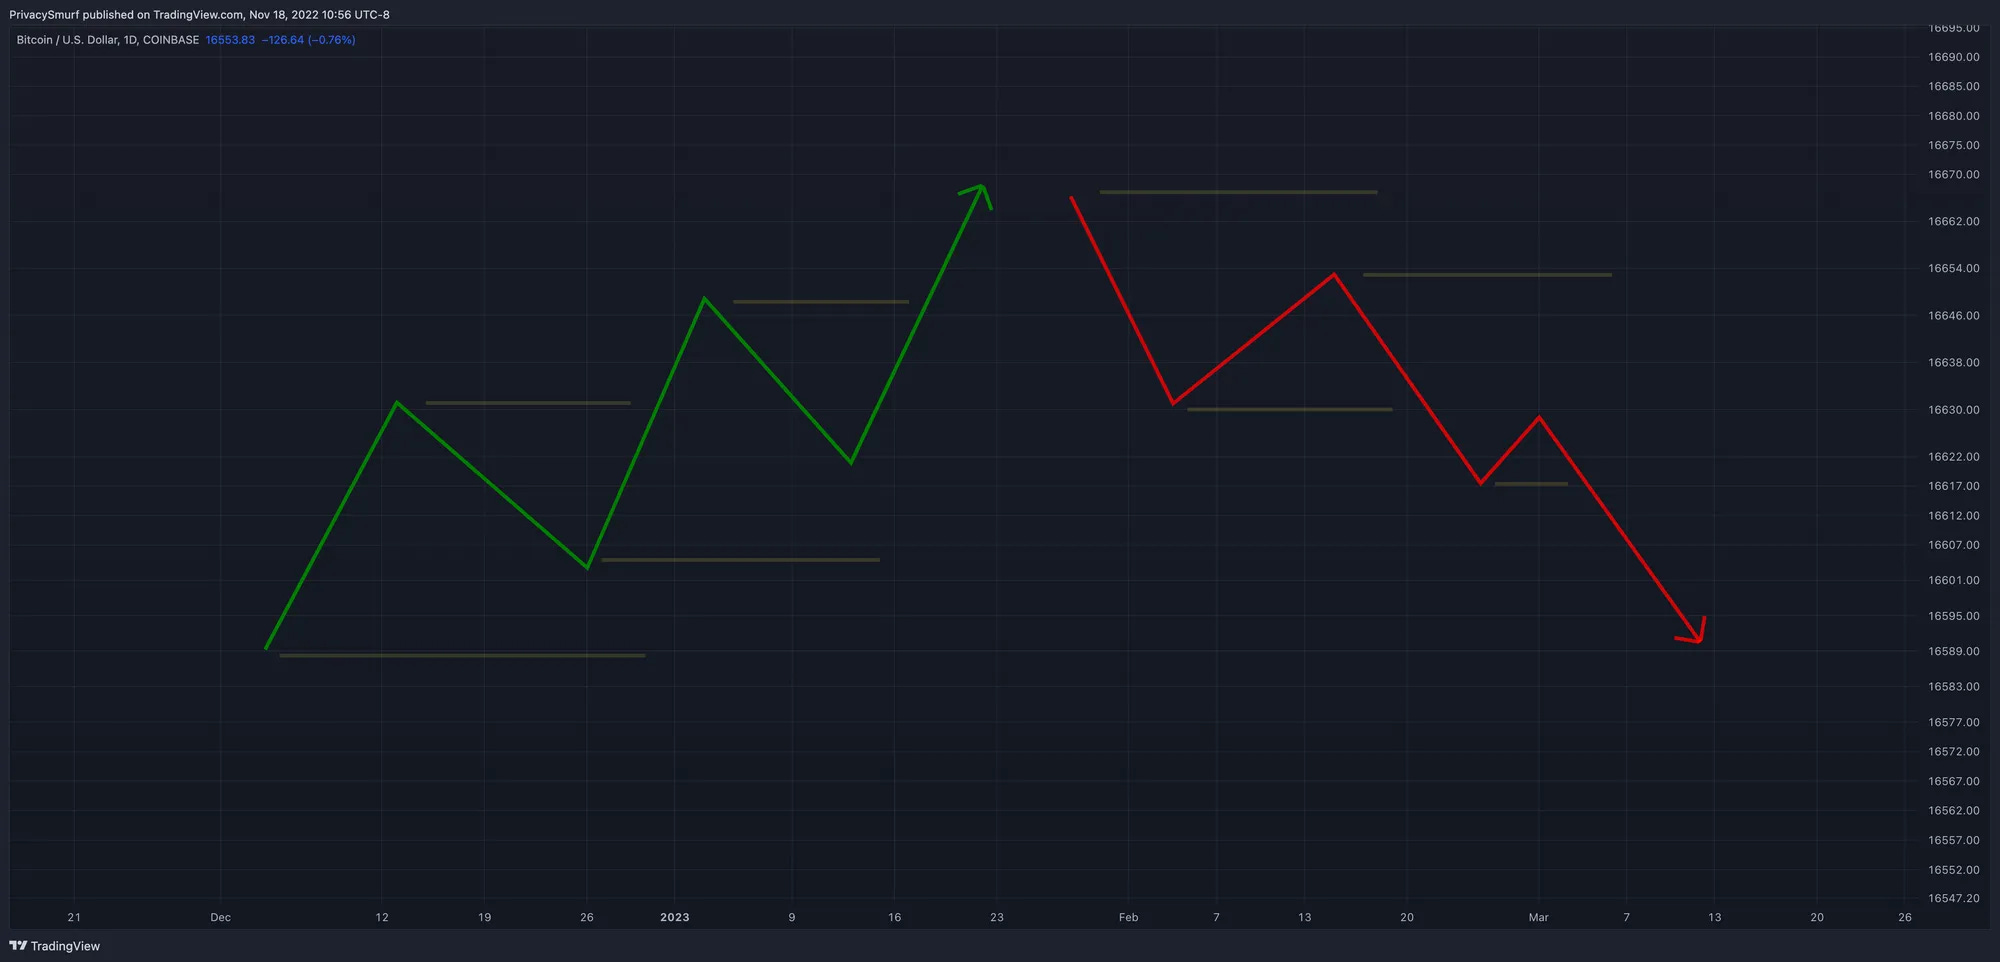
Bullish Trend Structure:
A bullish trend consists of a series of higher highs and higher lows. Each peak (high) exceeds the previous peak, and each valley (low) remains above the previous valley. To trade with this trend, look for opportunities when prices retrace to support levels. These retracements offer lower-risk entry points, as you're betting on the continuation of the established pattern.
Bearish Trend Structure:
Conversely, a bearish trend displays lower lows and lower highs. Each valley drops below the previous one, and each peak fails to exceed the prior peak. Trading opportunities arise when prices rally to resistance levels, providing favorable risk-reward ratios for short positions or exits from long positions.
Important Caveat: While trendlines connecting highs or lows can visualize trends, I've found them less reliable than horizontal support and resistance levels. Trendlines are subjective and can be drawn multiple ways, leading to confirmation bias. Focus instead on clear horizontal structural levels that the market has repeatedly respected.
Understanding Indicators vs. Oscillators
Before exploring the next two methods, let's clarify an important distinction. Think of it like the square-rectangle relationship: all squares are rectangles, but not all rectangles are squares. Similarly, all oscillators are indicators, but not all indicators are oscillators.
An oscillator differs because its calculations produce results bound to a fixed range. For example, the Relative Strength Index (RSI) can only return values between 0 and 100, oscillating around the midpoint of 50. This bounded nature makes oscillators particularly useful for identifying consistent extremely high and extremely low values.
Method 2: Indicator-Based Trend Analysis
Moving averages are among the most common trend indicators, although their traditional application has significant limitations. The conventional wisdom suggests that prices trading above a moving average indicate a bullish trend, while prices below signal a bearish trend. While this contains a kernel of truth, it oversimplifies market dynamics and suffers from lag.

The Lag Problem:
Moving averages, by definition, react to price changes after they occur. This means they'll always miss the exact beginning and end of trends. By the time a moving average confirms a trend change in price, a significant portion of the move may already be complete, reducing your profit potential and increasing your risk.
Advanced Solutions:
To mitigate this lag, consider using:
Variable Index Dynamic Average (VIDYA): Adapts to market volatility, responding faster during trending periods
Zero-Lag Moving Average: Uses mathematical techniques to reduce the inherent delay
Volume Weighted Average Price (VWAP): Particularly useful for intraday traders, as it incorporates volume data for a more nuanced view
Trend Strength Indicators:
Beyond direction, we need to assess trend strength. The Vertical Horizon Filter (VHF) excels at this task. Higher VHF values indicate strong trending conditions, suggesting trend-following strategies have a higher probability of success. Lower or declining values indicate ranging markets, where countertrend or mean-reversion strategies may perform better.
Method 3: Oscillator-Based Trend Analysis
For years, I relied on Wilder's Directional Movement Index (DMI) as my primary trend-confirming oscillator.
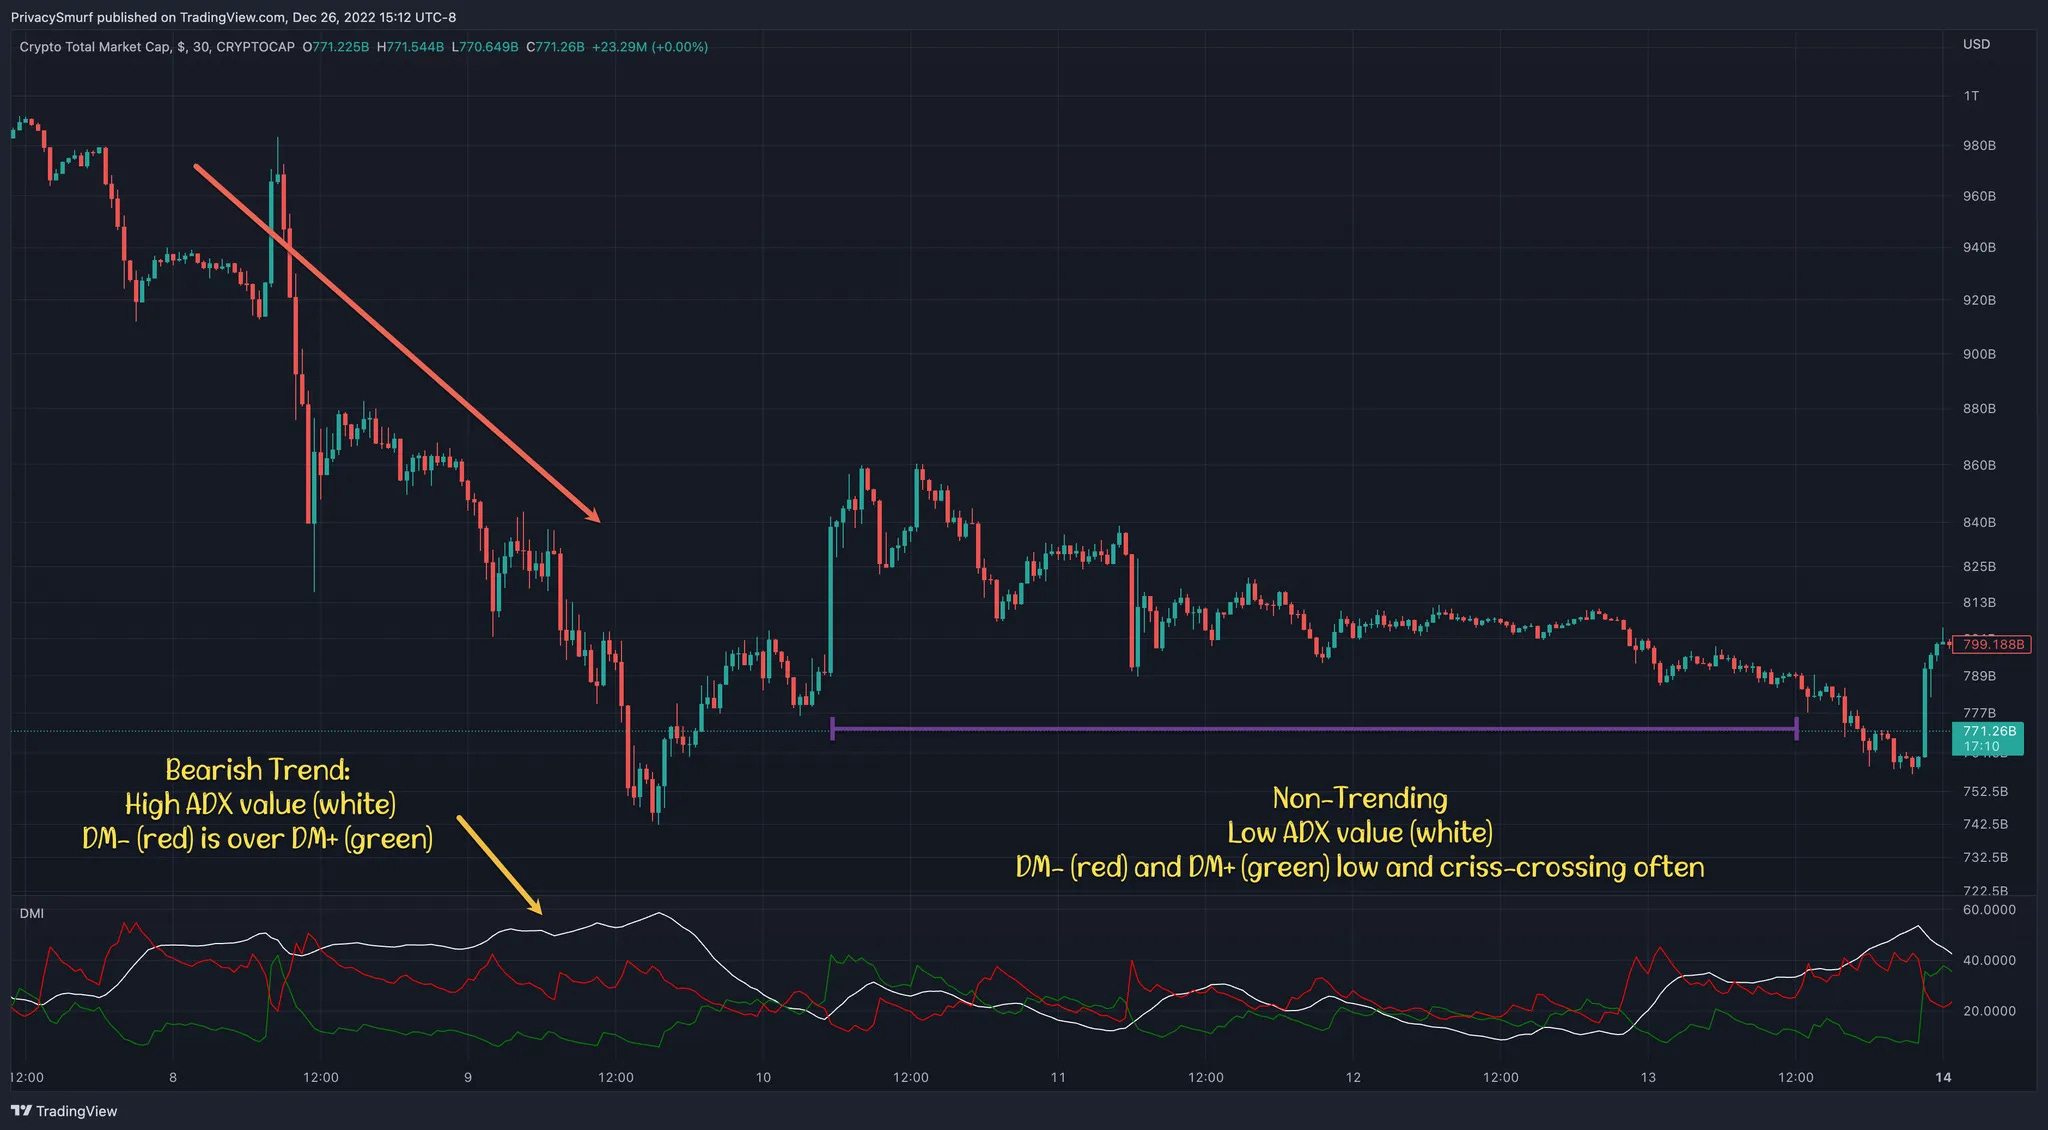
The DMI consists of three components, all bound between 0 and 100:
Average Directional Index (ADX): Measures trend strength regardless of direction
Directional Index Plus (DI+): Measures upward price movement
Directional Index Minus (DI-): Measures downward price movement
Interpretation:
When DI+ exceeds DI- and ADX reads above 25, this indicates a strong bullish trend with higher probability of continuation
When DI- exceeds DI+ and ADX surpasses 25, expect a strong bearish trend likely to persist
ADX below 20 suggests a weak or absent trend, warranting caution with trend-following strategies
Dynamic Adaptation:
Markets constantly evolve, which is why I've transitioned to using volatility-adjusted indicators, such as the VIDYA (above) and the Chande Momentum Oscillator (CMO). By calculating absolute CMO values, we can compare trend strength across different market conditions, accounting for changing volatility regimes.
I coded a version of the Absolute CMO Trend (ACT) indicator specifically for this purpose. While similar to the VHF in measuring trend strength, the ACT calculates based on closing prices rather than high-low ranges. This subtle but important difference prevents false strong trend readings during volatile but directionless markets.
Integrating the Three Methods: A Practical Approach
The most robust trend analysis combines all three methods. Here's my recommended workflow:
Start with Structure: Identify the prevailing trend using price action analysis
Confirm with Indicators: Verify your structural analysis aligns with indicator signals
Assess Strength with Oscillators: Determine whether the trend is strong enough to warrant influencing your bias or trade idea.
Managing Risk and Avoiding Common Pitfalls
Common Mistakes to Avoid:
Ignoring Conflicting Signals: When methods disagree, reduce position size or stay out entirely
Fighting the Trend: Picking tops and bottoms might feel clever, but it's usually expensive
Overcomplicating Analysis: More indicators don't equal better decisions
Neglecting Higher Timeframes: Always check the bigger picture before entering trades
Risk Management Guidelines:
Position Sizing: Increase size when all three methods align; reduce when signals conflict
Stop Losses: Place stops beyond key structural levels, not arbitrary percentages
Profit Targets: Use the next significant resistance (in uptrends) or support (in downtrends) as initial targets
Trend Reversal Signs: Exit or reduce positions when structure breaks down, even if indicators haven't confirmed
Putting It Into Practice: Your Action Plan
Choose Your Primary Timeframe: Select based on your lifestyle and risk tolerance
Identify the Higher Timeframe Trend: Apply the 6x rule to establish directional bias
Wait for Alignment: Only trade when your timeframe and higher timeframe trends agree
Confirm with Multiple Methods: Use at least two of the three identification methods
Start Small: Begin with reduced position sizes until you gain confidence
Track Your Results: Document which method combinations work best for your style
Key Takeaways
Trends exist across all timeframes; success comes from aligning your trades with the dominant flow.
No single method is perfect; combining structural, indicator, and oscillator analysis increases reliability.
The 6x timeframe rule helps filter noise while maintaining relevance to your trading horizon.
Risk management and position sizing should reflect the strength and clarity of trend signals.
Patience pays; waiting for clear alignment dramatically improves your probability of success.
Remember, trend identification is both an art and a science. While these methods provide a framework, developing intuition through practice and observation will ultimately make you a more successful trader. Start with one method, master it, then gradually incorporate the others. Most importantly, always respect the market's ability to surprise.
The trend truly can be your friend, but like any friendship, it requires understanding, respect, and the wisdom to recognize when the relationship has changed. Trade with the flow when possible, but always keep one eye on the exit.
In future writing, we’ll drill down deeper into the VIDYA, seen in the weekly update posts.
@ThePrivacySmurf