


Why the Crypto Top May Be Closer Than You Think
Beyond the hype and headlines, hidden signals reveal the crypto market may be near its tipping point.

Prices in the crypto market are surging and optimism is running high, but could we be nearing a market top? Many believe we are far from the peak citing various metrics, hypotheticals and historical patterns. There are details obscured by all the noise that tell a different story.
Below I will show a combination of proportional comprisons, historical patterns and technical analysis that suggests we may be closer to the top than most people think.
The Surface View: Common Arguments for Continued Growth
A: Public Interest is Too Low for a Top
The popular belief suggest that the crypto market can’t be at a top citing good search trends. Searches for terms like “bitcoin,” “crypto,” and ‘coinbase” are not near the highs of the last market cycle - not peak interest means we are not at a price peak.

This data is accurate. From the 2021 peak current search volume is below the 2021 peak. Bitcoin is 63%, Crypto is at 47% and Coinbase is at 34% of the 2021 highs, on average many crypto related terms are down around 35-50% from 2021 highs.
Interest is not only visible in search trends though. It can also be measured in trading volume. Trading volume in the crypto market is also down around 35% the 2021 peak. The google search metrics are relatively similar to the trading going on in the market. Lower abolsute numbers (a direct comparison from 2021 to today) don’t mean the market can’t peak now. The reduced public engagement both in trading volume and google searches are proportionally equivalent to the 2021 top. This reflects the market doesn’t necessarily need a retail frenzy to top. Perhaps this suggests the market has matured to reflet longer-term horizons instead of the potential for short term untapped parabolic growth.
B: Echoes of 2021: Familiar Headlines and Sentiment
Here are various headlines from a few weeks to days before the 2021 peak.

Today’s headlines are strikingly similar if you go browse around. The same is also mirrored in the crypto fear or greed index.
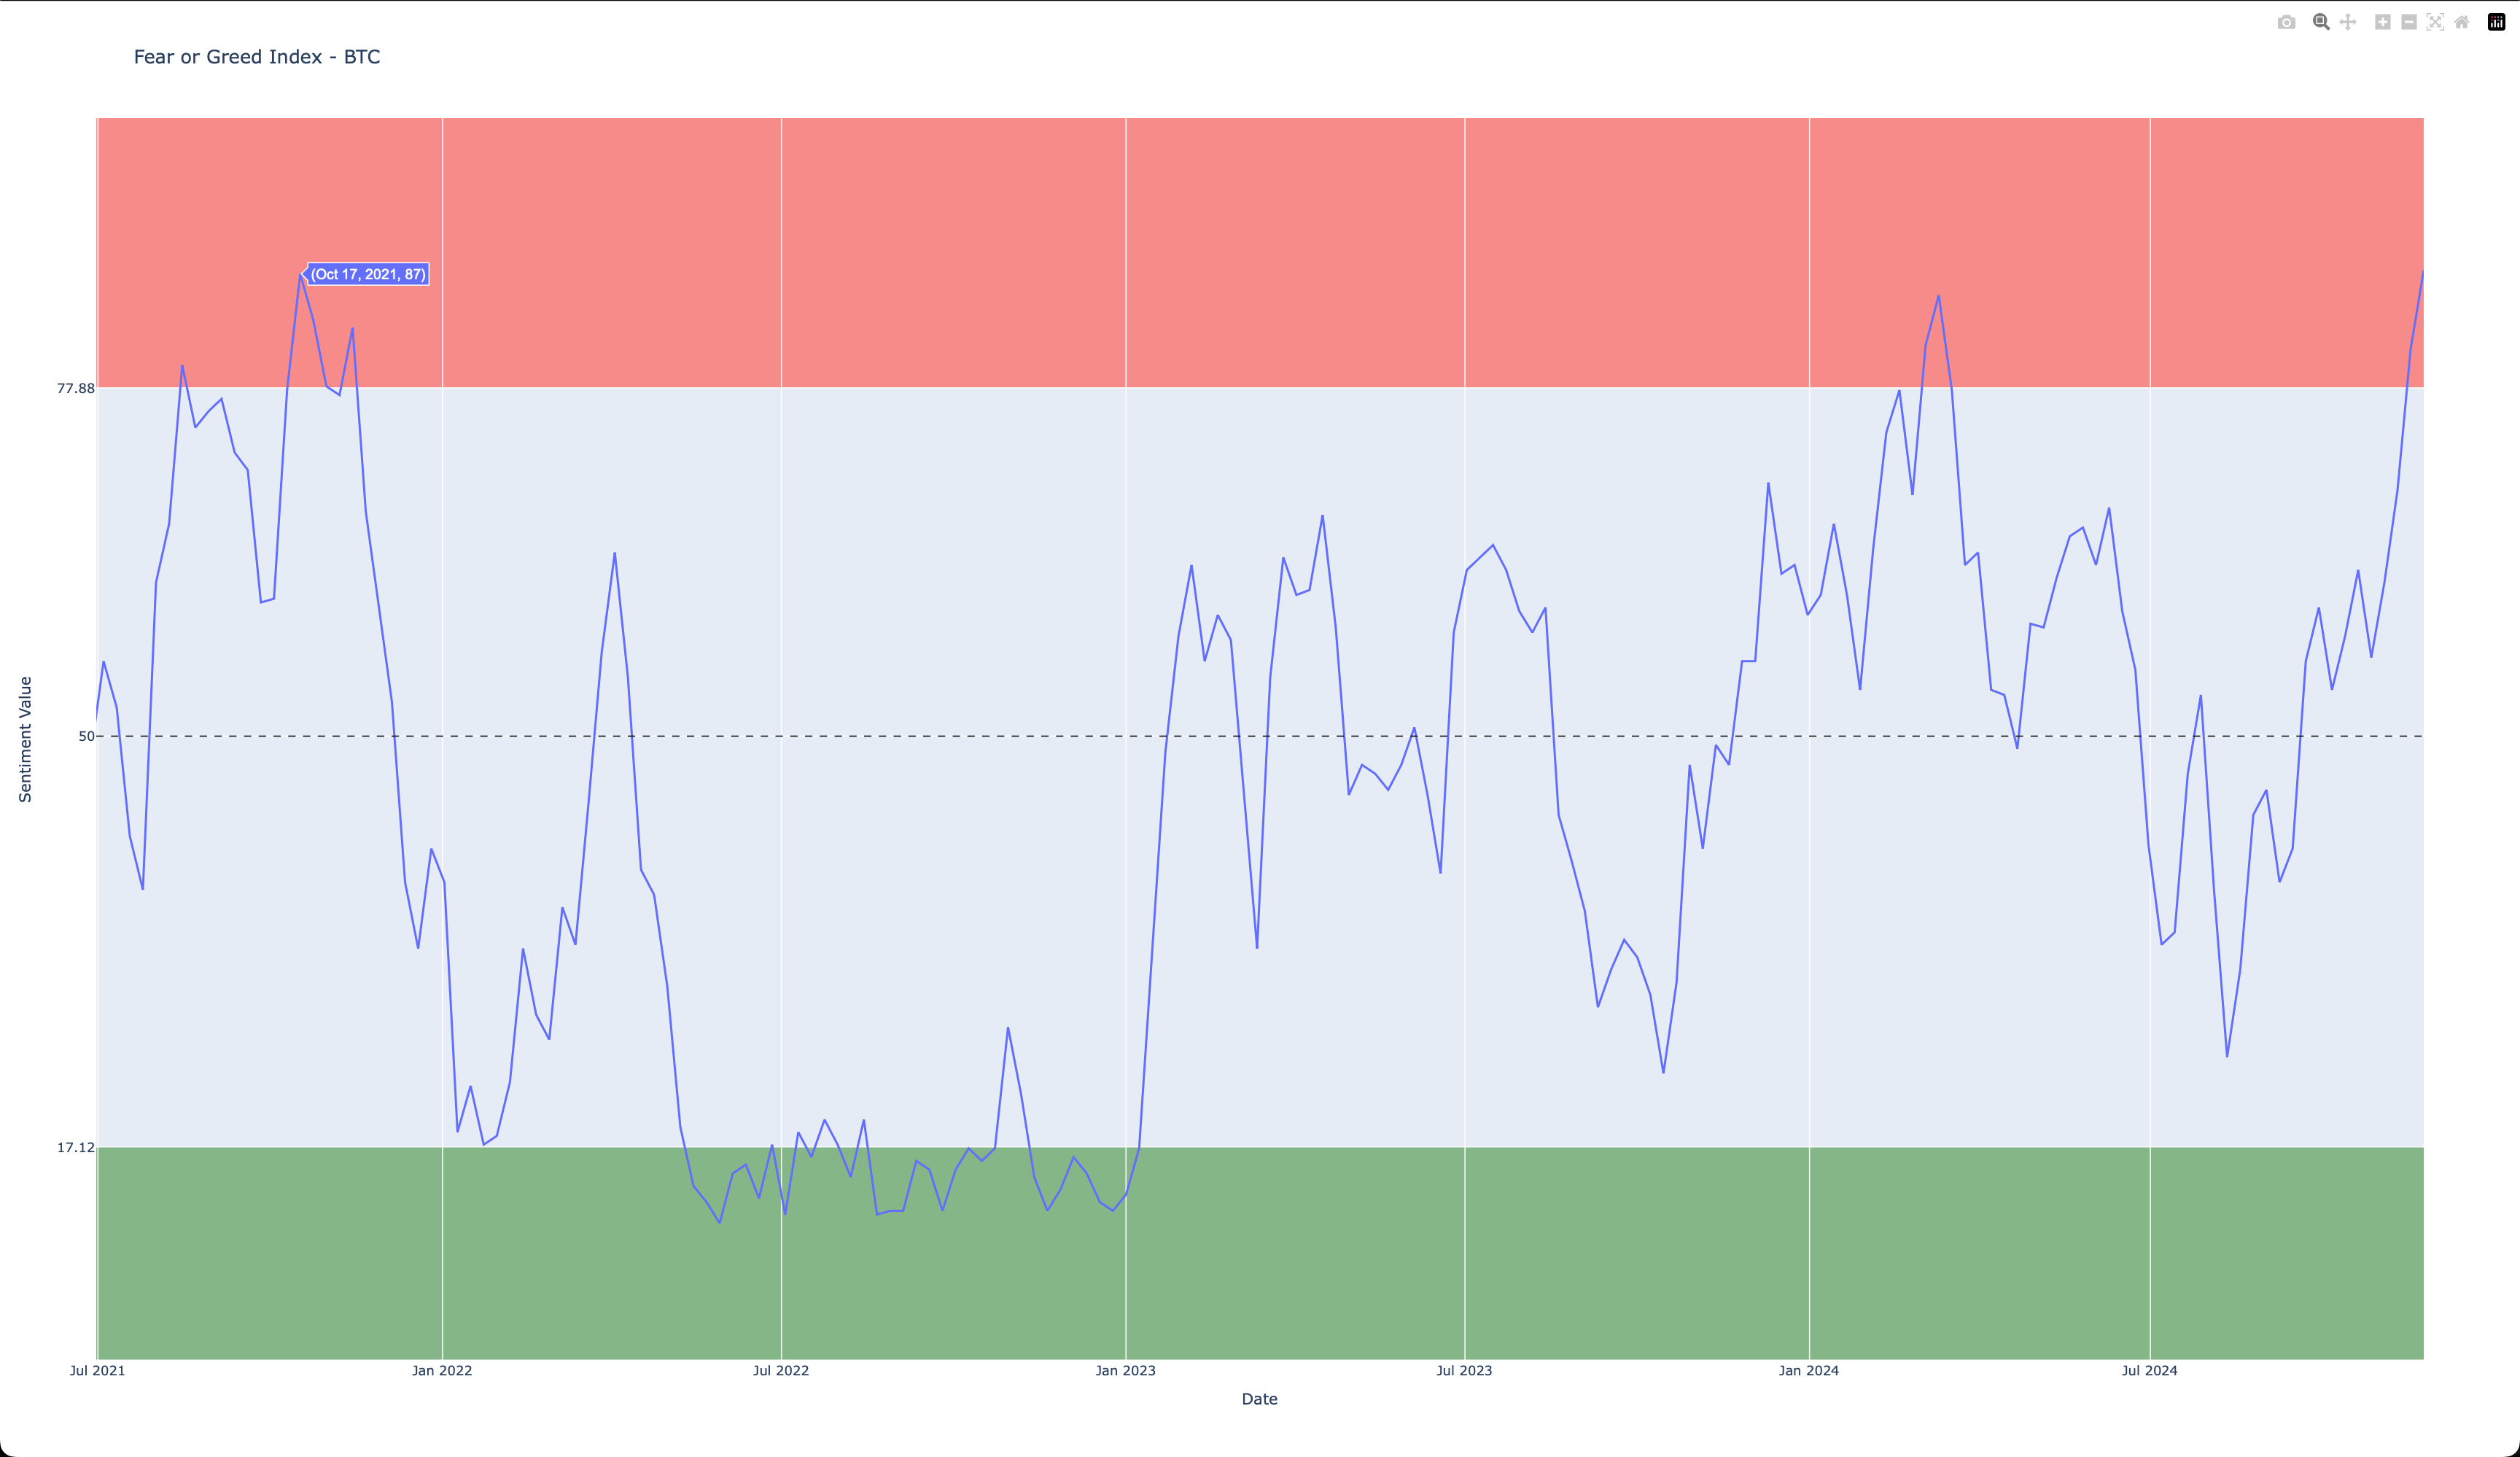
Weekly levels of retail sentiment are back into measurements of extreme greed rivaled only with the levels seen in March 2024 and October/November 2021 which all were a precursor to a departure from bullish price bahavior. The emotions visible in the market suggest a peak in sentiment rather than a foundation for sustained growth.
The Deeper View: Hidden Signals of a Market Top
A: Historical Patterns Point to Familiar Outcomes
Price action is behaving similarly to the past cycle as mentioned in one of the earlier headlines. Observing the weekly close of the crypto marketcap and BTC, the market ran up for months (green arrow), pulled back making a higher low (blue arrow), broke resistance making a new higher high weekly close (2nd green arrow) then proceeeded to move into a bear market.


B: Technical Analysis: Momentum is Slowing
Commonly used, and my preferred, indicators show that prices are rising but the underlying momentum in the market is decreasing. This is called bearish divergence. The images below on the weekly timeframe illustrate this separation between prices and the directional power the market is generating.


Yes, momentum has set a new high on these charts. I presented this to make another point. Momentum is today’s price subtracted from a past price. While this is a valuable metric it has a flaw. The indicator Rate of Change is essentially the same tool but instead of using a raw price value it uses the percent change. This crucial difference normalizes price changes making it better for comparing the directional power across various time periods and price ranges. If one were to apply the Rate of Change indicator instead of Momentum it shows the same divergence as many other momentum calculating indicators.
Higher prices with slowing momentum indicates an exhaustion among buyers. Without any change, eventually sellers will take control of the move and prices will plummet. This is evidenced in the 2021 cycle.
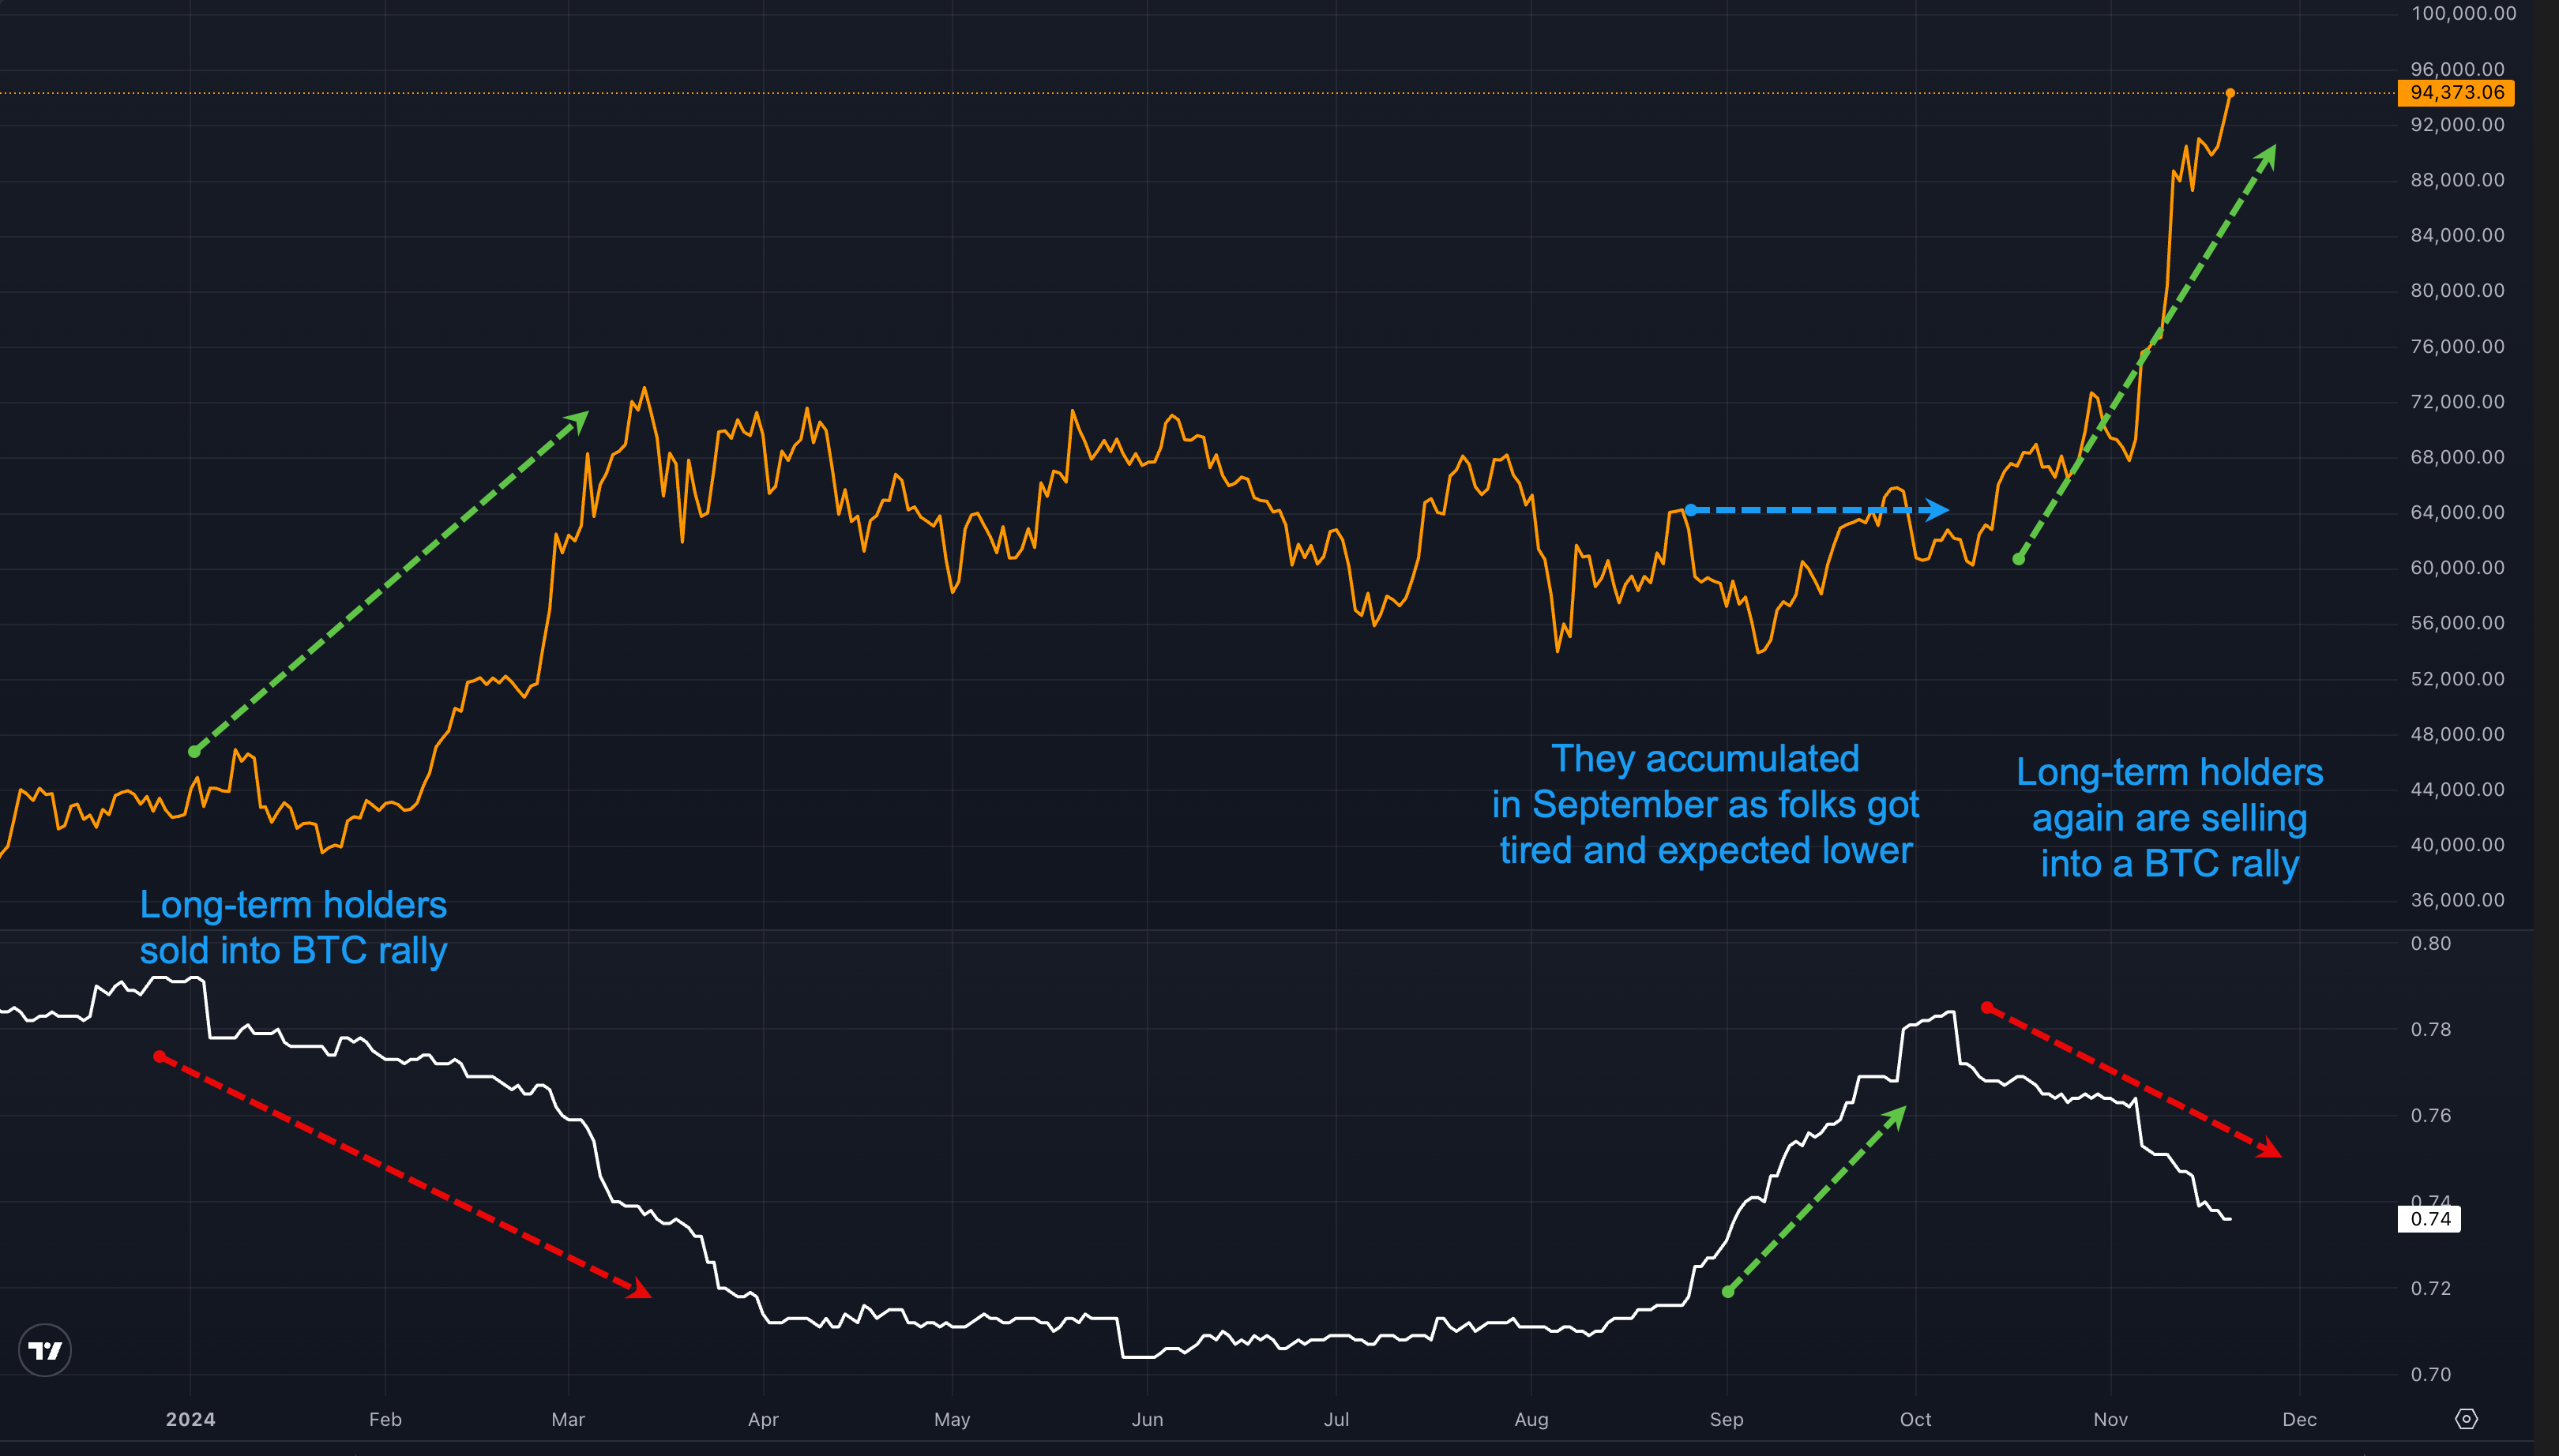
C: Holder Behavior Reveals the True Picture
An on-chain metric called the Realized Cap HODL Waves reveals insights behind the actions of long-term and short-term BTC hoders. In short this metric will analyze Bitcoin’s coin supply by combining coin age (how long they’ve been held) with economic value (based on their last movement price). Unlike regular HODL Waves, which show the number of coins in each age group, this metric focuses on the USD value held in each bracket, offering a dynamic view of holding and spending behavior.
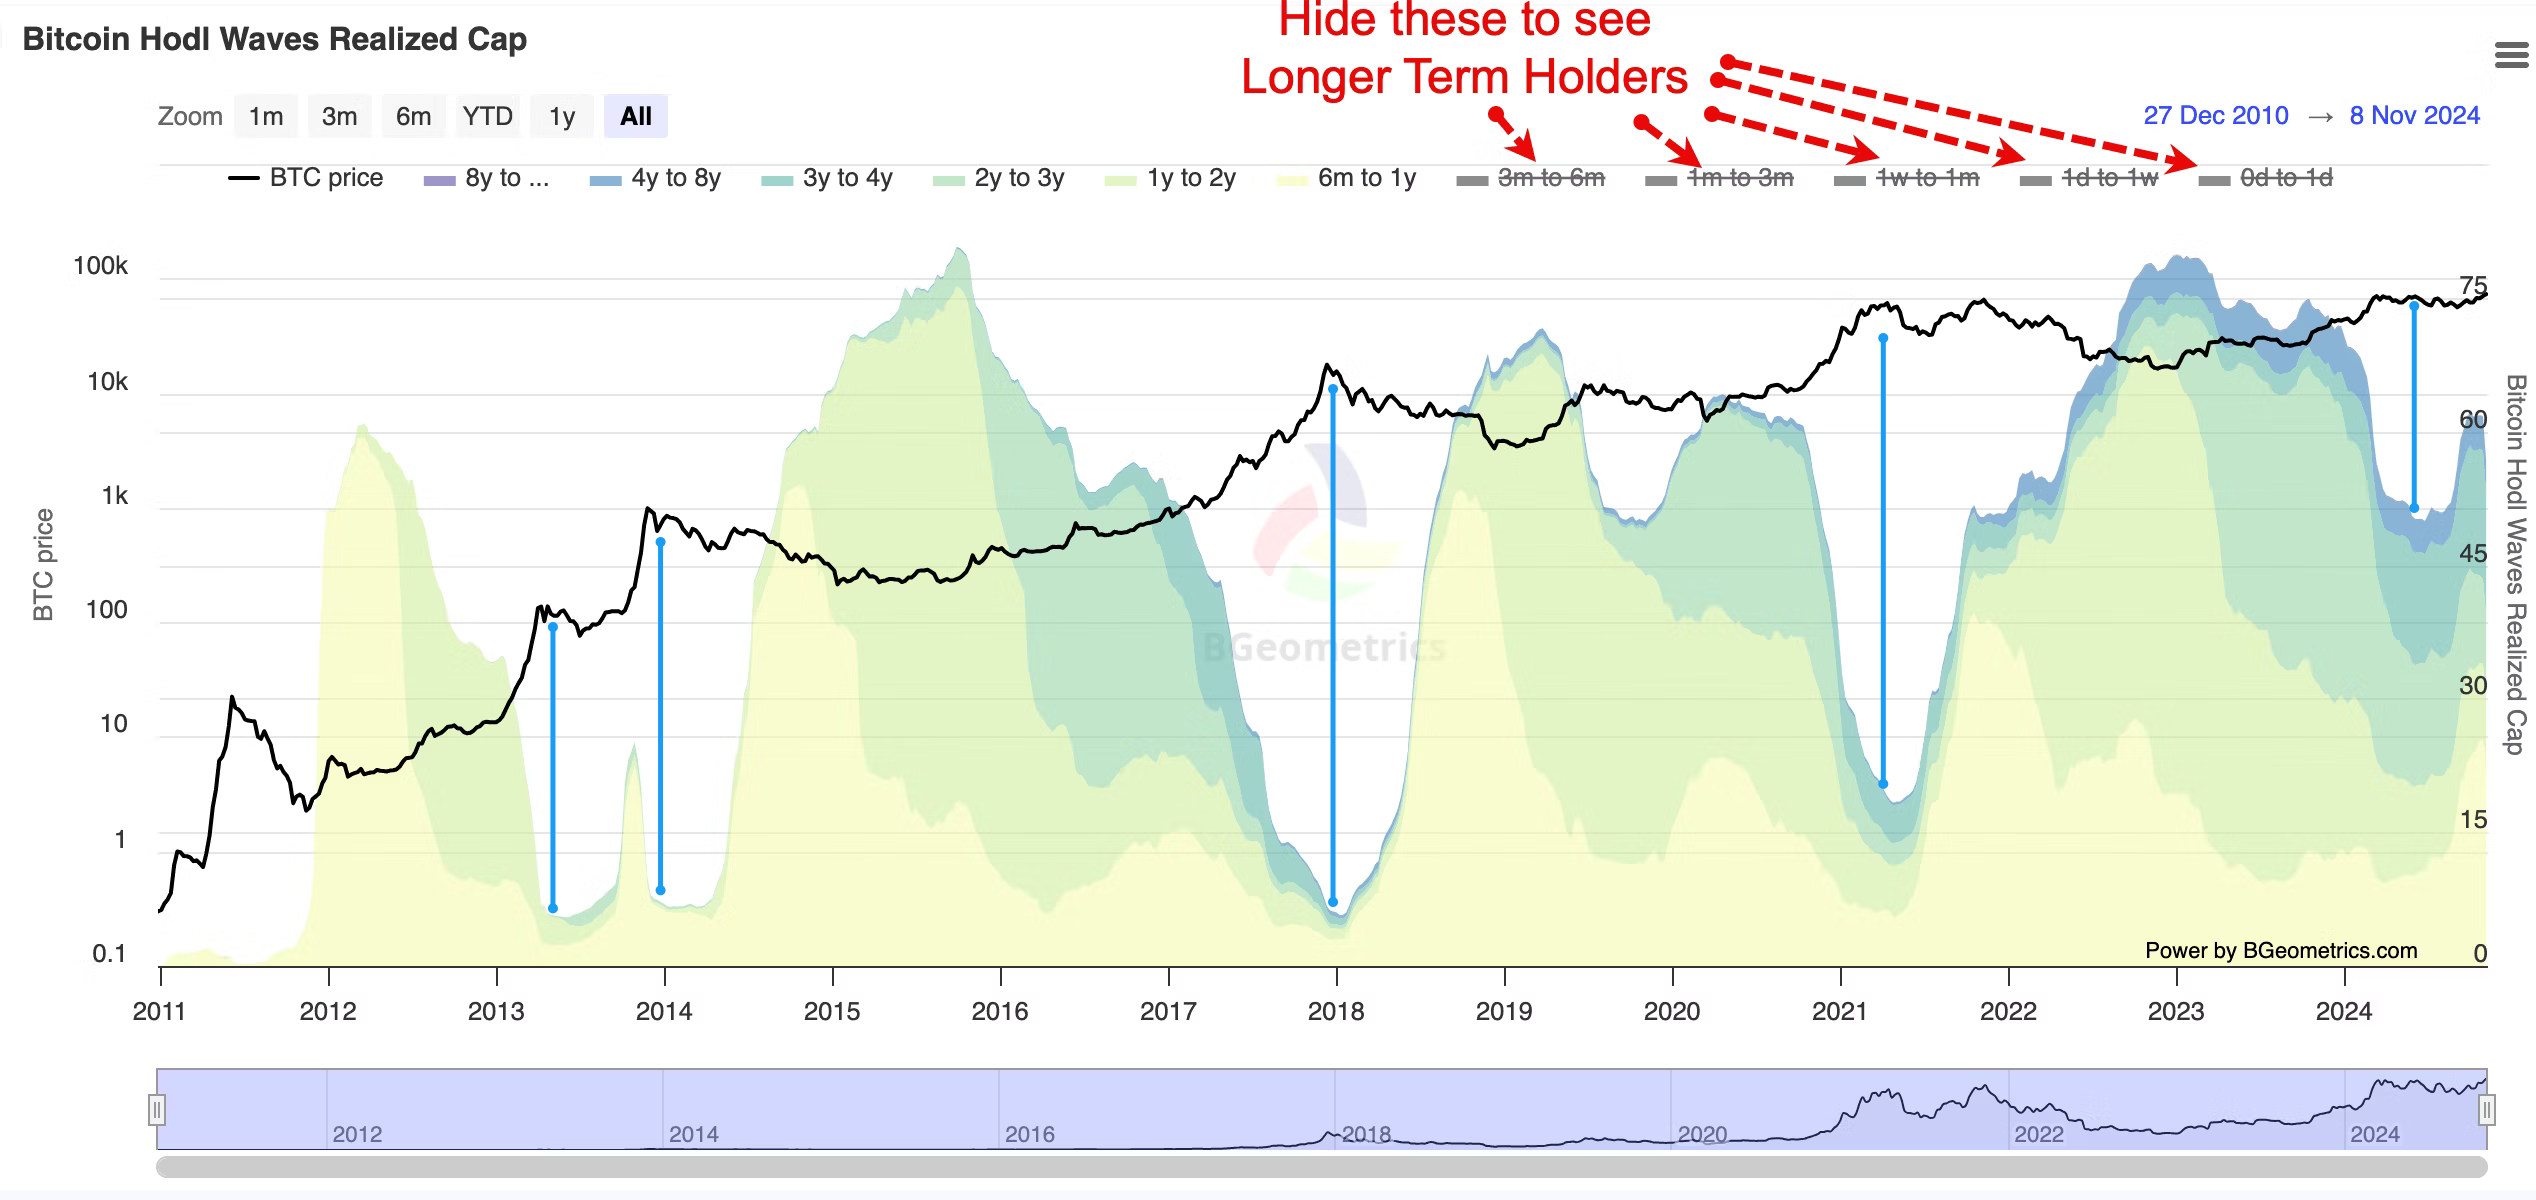
Longer-term holders typically sell into strength, transfering older valued coins into short-term holder’s hands. The vertical blue lines above show the number of old coins is typically lowest around Bitcoin price peaks preceeding major corrections. Currrent activity shows similar trends suggesting a correction could follow.
Challenging Common Beliefs: Why the Narrative is Misleading
The crypto market's current state can't be fully understood through search volumes and trading activity alone. While absolute numbers are lower than in 2021, their relative alignment paints a different picture. The reduced public engagement, both in trading volume and Google searches, are proportionally equivalent to the 2021 top.
Emotional narratives often signal a top. We've heard it before: "This time is different," or “This has never happened before,” yet, history shows these sentiments can be completely off the mark. Current narratives around institutional adoption, ETFs, and halving related behavior echo the optimism seen in late 2021 and are all either hopium or hypothetical. While these factors are or would be significant, they don't guarantee sustained growth in the near term. they are longer-term influencing factors.
The assumption that halving cycles or increased institutional involvement will ensure long-term price appreciation also ignores the cyclical nature of markets which also suggest a topping soon. How long have we heard or read institutions arriving, yet still we see major price declines?

These narratives often serve to justify extreme valuations rather than provide a realistic assessment of market conditions.
I have my own thesis on the price action of Bitcoin and the halving that helped me time the last top and I fear will make many others miss this one as well. You can read that here.

While sentiment indicators and headlines grab attention, the underlying technical and on-chain data paint a more nuanced – and potentially bearish – picture. The divergences we're seeing in price action, volume, and holder activity shouldn't be ignored.
The bearish divergences suggest we may be closer to a market top than many believe. These signals have historically been more reliable predictors of market direction.
In essence, while the surface-level optimism is palpable, a deeper analysis reveals warning signs that prudent investors should consider. The market may indeed continue to climb, but the risk-reward ratio at these levels deserves careful consideration.
And just for speculation sake I think we’ll see a double (macro-triple) topping type action possibly like this. And on a side note there is no technical trade signal for action to the short side, yet.

Thanks for your time. Join in the conversation, comment here and share this with the next person you see talking about the market extending ‘til late next year. I’d love the discussion.
@theprivacysmurf
Amazing as always! Thank you!