


#131: Bullish, but not CT bullish..
Your words walk right through my ears presuming I like what I hear

I just have to laugh at what ideas are circulating on Crypto Twitter right now.
ANALYSIS TL;DR
The market has a bearish daily structure, but price action has almost confirmed a technical bottom. Meanwhile, market participants are increasing their exposure across the board. Technical conditions are all in place, and we await a lagged bottom confirmation. Even so, I am exposed with a levered and spot entry from $78K. I don’t intend to hold with daily closes under $76K.
Bullish trades are higher risk from my perspective since we have a bearish price structure, but being closer to supports than resistances creates a better risk-to-reward ratio.
Any bullish trade execution I entertain is with the expectation that the bull market will continue until the end of the quarter and maybe one month beyond, when I will start looking for signs to exit. If I had to put entering the market now in stoplight terms for longs:
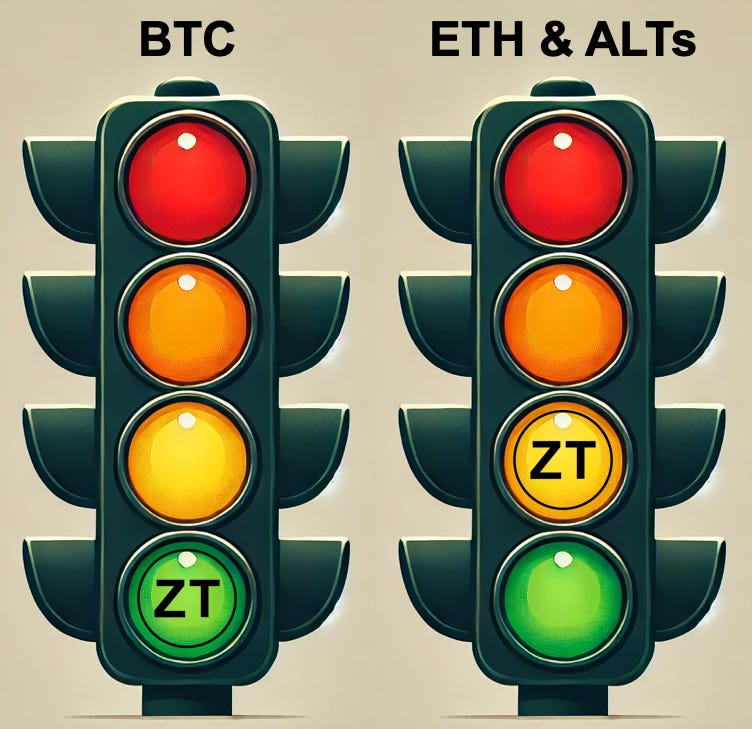
BTC: Green Light
I’m already in a medium-term bullish position with BTC at around $78K. The invalidation point for spot is closing below prior highs at $72K, and for leveraged positions, daily closes below $76K. I’ll be reevaluating exit targets upon a trigger of the daily bullish divergence trade setups. I’m not anticipating a new ATH at the moment, but I will happily take that.
ETH & ALTs: Yellow Light
I’m still not looking for dip-buying opportunities on ETH and ALTs despite “low” prices, but if that were something I did now, it might be the time I’d start considering. In the event BTC rallies, they may follow, but with dominance still being in BTC’s favor, any downturn will hurt ETH & ALTs more. I don’t think the market structure is there for ALTs yet, but it’s closer and not suggesting a deeper breakdown currently. Taking a battered down chart gamble has some appeal. This would be ideally a spot position, but entering a small-levered long isn’t out of the question.
Where are we now?
The bull market is still going, and bottoming has started. The market’s appetite for exposure is building for all assets while prices are “low.” Retail sentiment has shifted to bearishness but stabilized above extreme fear. We are in the timing window, which is the critical moment for a pivot, and daily chart technicals are starting to support the notion of a turnaround in the face of falling prices.
What is the plan?
SHORT-TERM BTC
Blending the precision of mathematical models with the artful subjectivity of technical analysis, statistical projections suggest BTC’s Sunday closing price will likely range between $77K and $85K.
The closing price for the week landed just outside the Max Expected Closing Range on Sunday (less than 1%), bringing the total to eleven out of twenty (55% accuracy). I described how these ranges are created in the ANALYZE section.
Focusing on the technicals, the RSI is below the midline, suggesting continued bearish influence. Price has to work against the flow to go up. That being said, we are at a critical inflection point. Another bullish day or two will send the RSI over the midline and the top adaptive band. These conditions typically lead to bullish, impulsive price action. This would also trigger a bullish divergence trade trigger, giving us targets for the next rally.
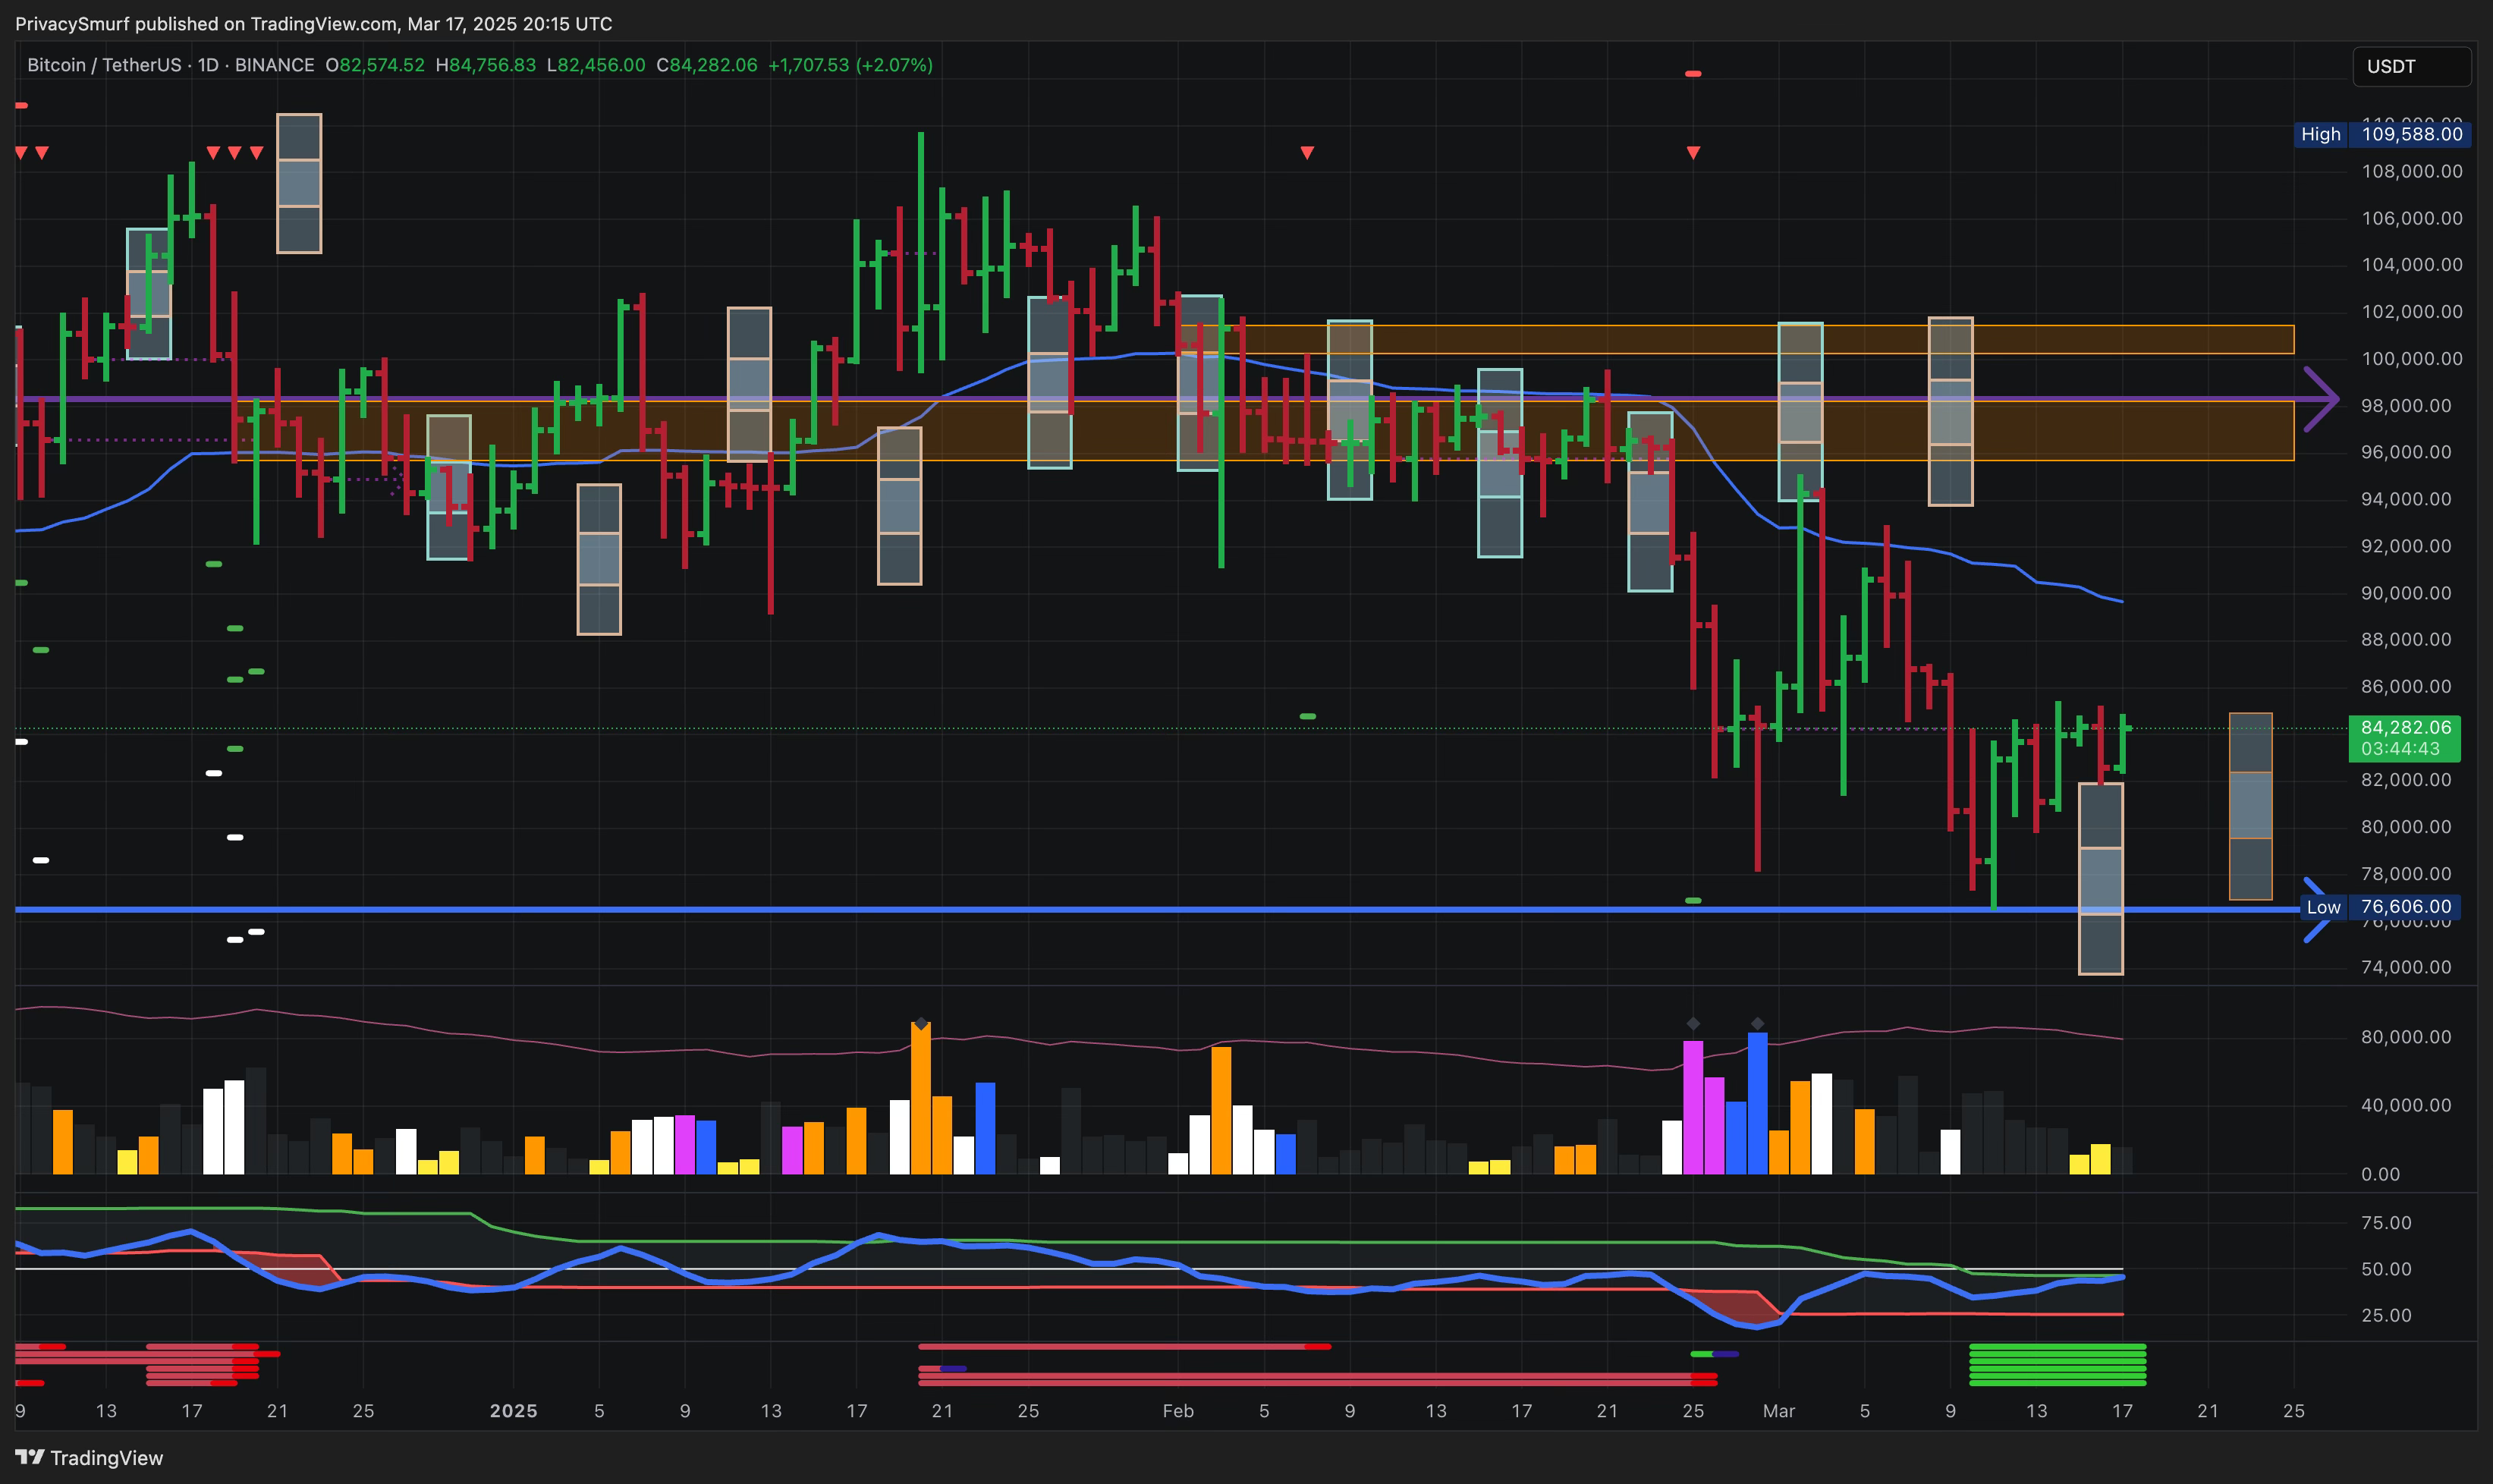
My existing BTC spot position, established at $78,000, and my leveraged long position initiated slightly higher, remain open. I hold these positions, targeting profit levels derived from the divergence trade signal. I anticipate price movement towards the $90K - $92K range. However, I'm less confident that we'll see a new all-time high (ATH) before the end of the quarter.
SHORT-TERM ETH & ALTs
Stats suggest ETH’s Sunday close will range between $1675 and $2040.
On Sunday, the closing price for the week landed dead in the middle of the Probable Closing Range, bringing the total to eight out of nineteen (42.1% accuracy). Research continues to establish reliable assumptions for technical metrics related to ETH.
Focusing on the technicals, the RSI is below the midline, suggesting continued bearish influence. Price has to work against the flow to go up. The technicals for ETH and ALTs are similar to BTC, showing bullish divergence on the daily timeframe, suggesting the potential for a bottom forming at this level. There is still room for the RSI to reach the midline, suggesting BTC may be the first mover.
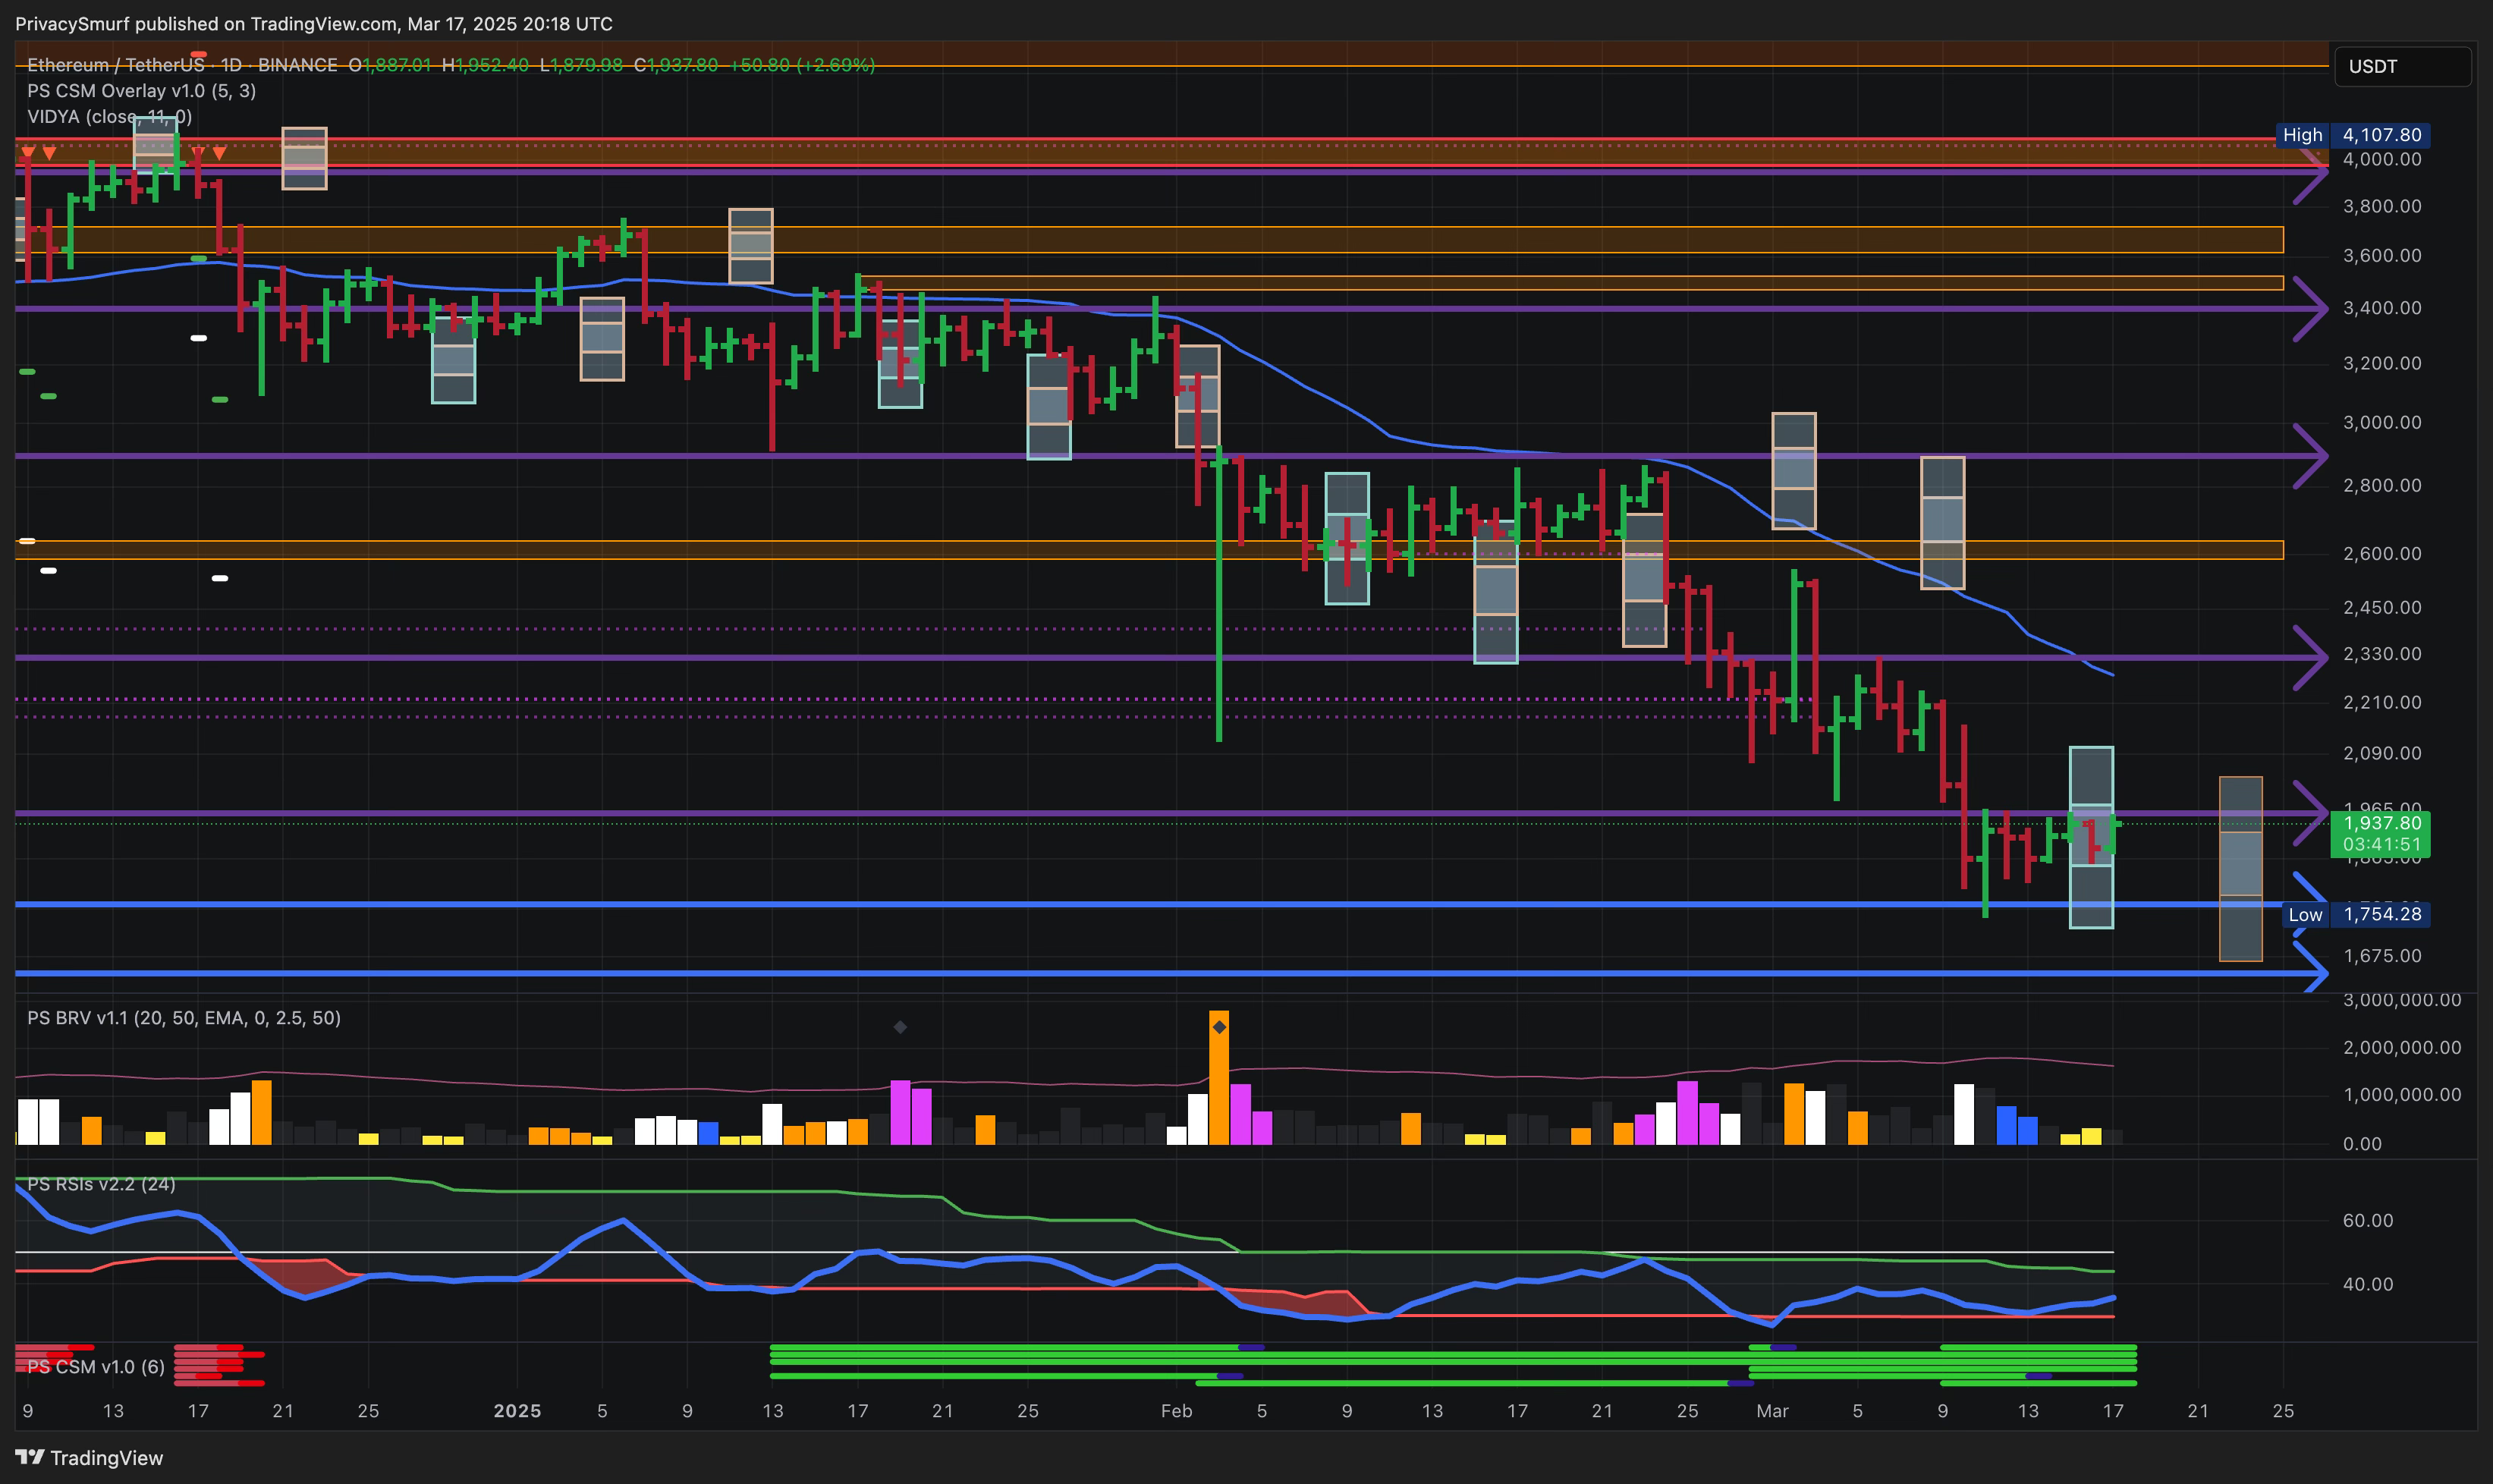
My custom ALT index is still under development. Based on modified versions of older indices, observations indicate that ALTs are in a stronger position than ETH. Over the past week, ALTs have emerged as a more attractive option, even though opportunities for ALT buys remain pretty limited. Although prices are near basement levels, I'm not yet ready to buy any further dips, though I am open to a few calculated, riskier plays. While the downside risk appears to be decreasing, the ETH & ALT bottom has yet to be confirmed. I prefer to wait until the BTC makes its move and a precise bottom forms before committing to a more significant ALT position.
Now is the time to dial in on your watchlists. If you want to limit your selection process like me, I have watchlists of such assets on Discord daily. Now is the time to watch them to see which asset shows up first with a bullish structure. Click here to join!
(MY) LONG TERM CRYPTO
I changed the heading of this section weeks ago because I think it’s vital for you to recognize that the analysis is from my perspective regarding my time horizons and trading plans. For me…

As time progresses without setting new price highs, we continue to shape the market similarly to the last bull market.
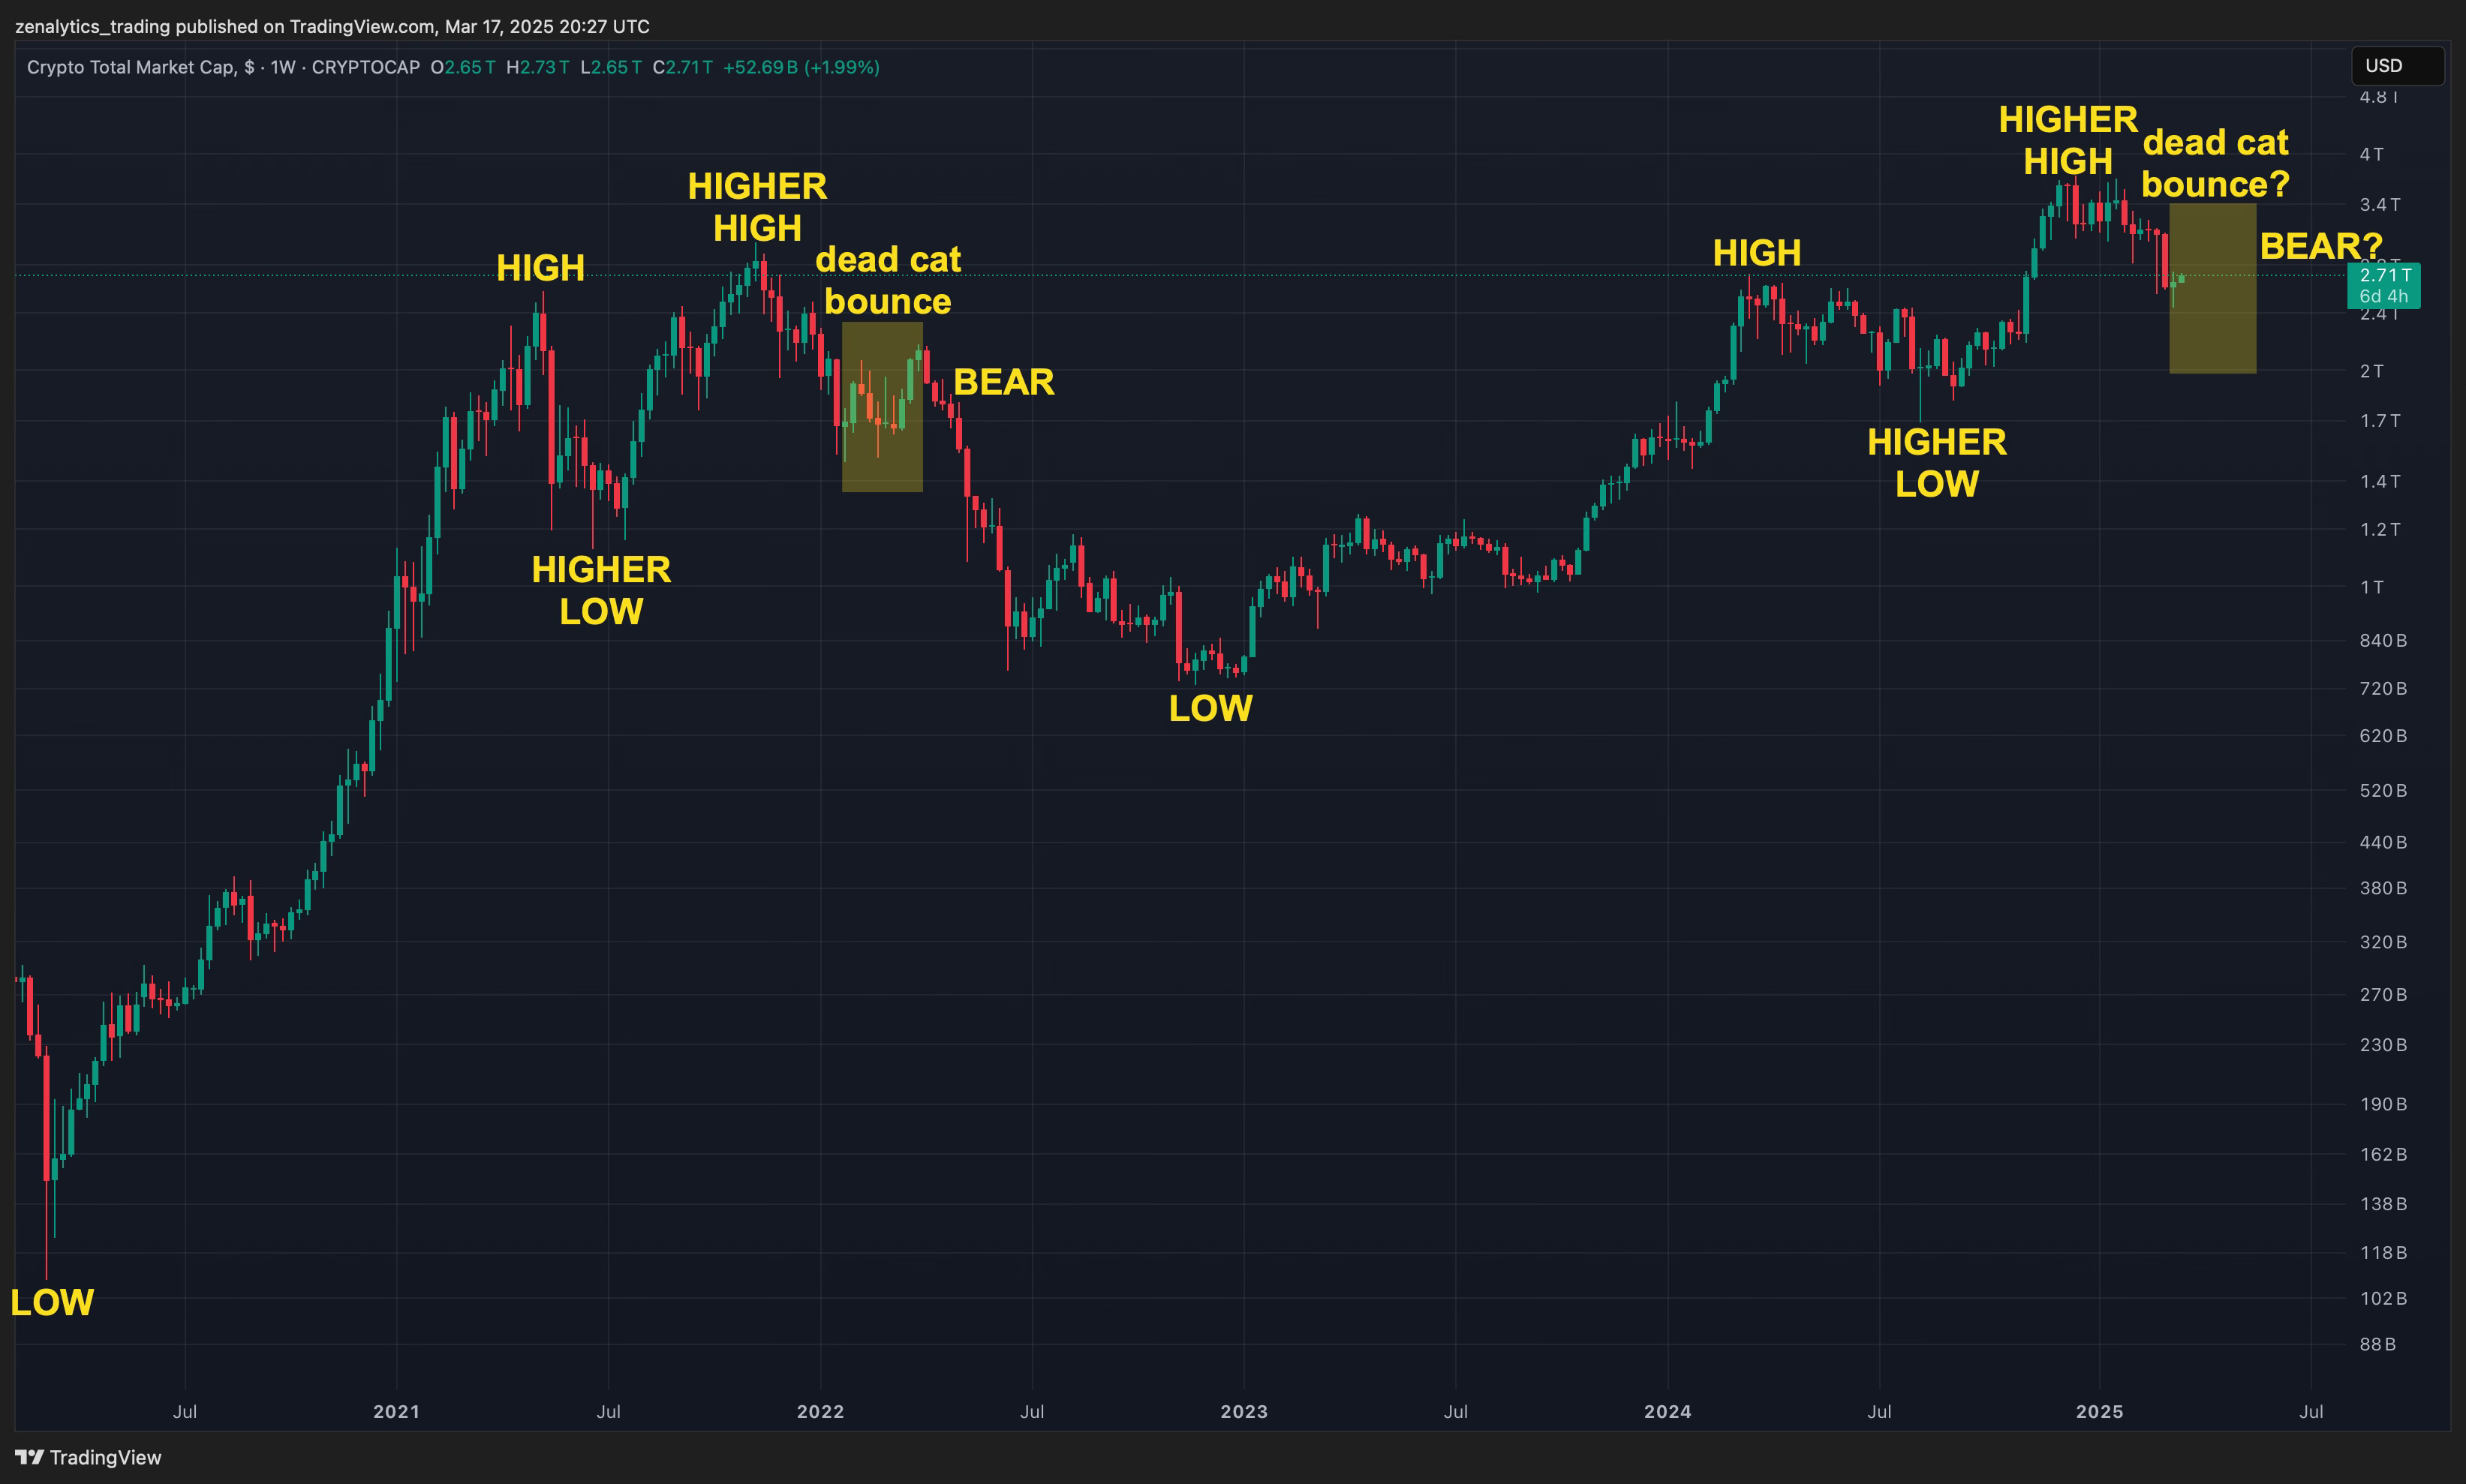
In a perfect mirroring scenario, we would have already hit the lowest low and initiated a rally, only to establish a macro lower high over the next nine weeks before transitioning into a bear market. If bullish divergence trade setups are triggered on the daily timeframe, they will provide clearer insight into the upside potential. It’s important to remember that these divergences are setups—not confirmed triggers—and price stability has yet to be established. It’s not the moment to swing for the fences, yet… :-p

Revisiting my December analysis—where I advised against chasing new monthly high closes—highlights a potential mirror of the last cycle. In the attached chart, I’ve plotted BTC’s drawdown from its ATHs on a monthly timeframe, overlaying a sine wave that captures the rhythmic fluctuations of the drawdowns. Given the extended period of consolidation near the highs of this long-term wave, while the pattern isn’t an exact replica of previous ATH drawdowns, it still suggests that we may complete another rally below the ATH before transitioning into a deeper pullback. This observation reinforces the perspective that, even if not identical, we are still navigating a similar phase of the cycle. I’m all for new “face-melting” rallies, but I’m tempering my expectations based on past trends.
If you like my content, please share it. See you in next week’s market update!
@ThePrivacySmurf
The Substack has been reorganized. You may not be receiving all the content I’m creating. Please read the post below to learn what happened, what to expect, and how to streamline your preferences.
Read a post about what everyone is getting wrong about the Bitcoin Halving and BTC price action.
Below are the TradingView chart links for the images above, which I use daily for my BTC, ETH, and ALT trading.

