


#136: BTC’s Love Language is Max Pain.
It's a heartbreaker.

Took a day and rode the Namsan Cable Car up to the observatory and walked around Namsan Mountain Park. The weather is so nice right now. Seoul is not disappointing.

On our way back from the tower, we passed a mall with a massive video screen outside. While it usually displays ads, this time it was broadcasting a music video, which turned out to be the global premiere of this K-Pop group's comeback song after a brief hiatus. People had stopped all along the sidewalk to watch, with some recording the moment on their phones.
📌 TL;DR / Smurf’s Summary
Bitcoin flashes caution near resistance ($96K-$98K) as bullish momentum wanes and bearish signals emerge, despite a still-bullish daily structure. Support sits at $82K-$85K; a daily close below $74K would invalidate the bullish bias. Ethereum & Altcoins continue to lag, showing similar slowing momentum; approach any potential breakout trades with extreme caution and tight stop-losses, keeping a close eye on overall market dynamics, especially BTC's direction. There is a confluence of topping signals at the moment.
🚦 Trader Traffic Light

BTC Trades: 🟠
Amber Light. The swing from $78K and breakout from $85K and $92K have played out now. Bullish momentum is declining and bearish signals have been confirmed. I’d consider a bearish invalidation breakout trade over $98K.
ETH & ALTs Trades: 🟠
Amber Light. I’m still not looking for dip buys. The stage is set for an ALT rotation but trade considerations come with extreme caution and tight stops due with a close eye on the altcoin market cap here. If Stables continue to outpace ALTs I’m staying out of trades because any downturn on BTC will likely bring the whole market with it.
🔍 Where Are We Now?
Market Structure: Bullish daily structure, yet short-term momentum signals topping.
Retail Sentiment: At the Extreme Greed threshold.
Current Positioning:
BTC spot long at $78K (trimmed profit: 1st @ $91.5K, 2nd @ $95.8K).
Cautiously evaluating ALT breakout trades with tight stops.
What are the Technicals?
Definitions:
Weekly Closing Range: Created with Bayesian statistics and linear regression. More on that here.
RSI (Relative Strength Index): Momentum indicator showing speed and power of price action.
Divergence: When price action is going one way but momentum is going the other, suggesting the current price trend might be losing power.
📈 Technical Deep Dive (BTC)
Price Action: Bullish Bias
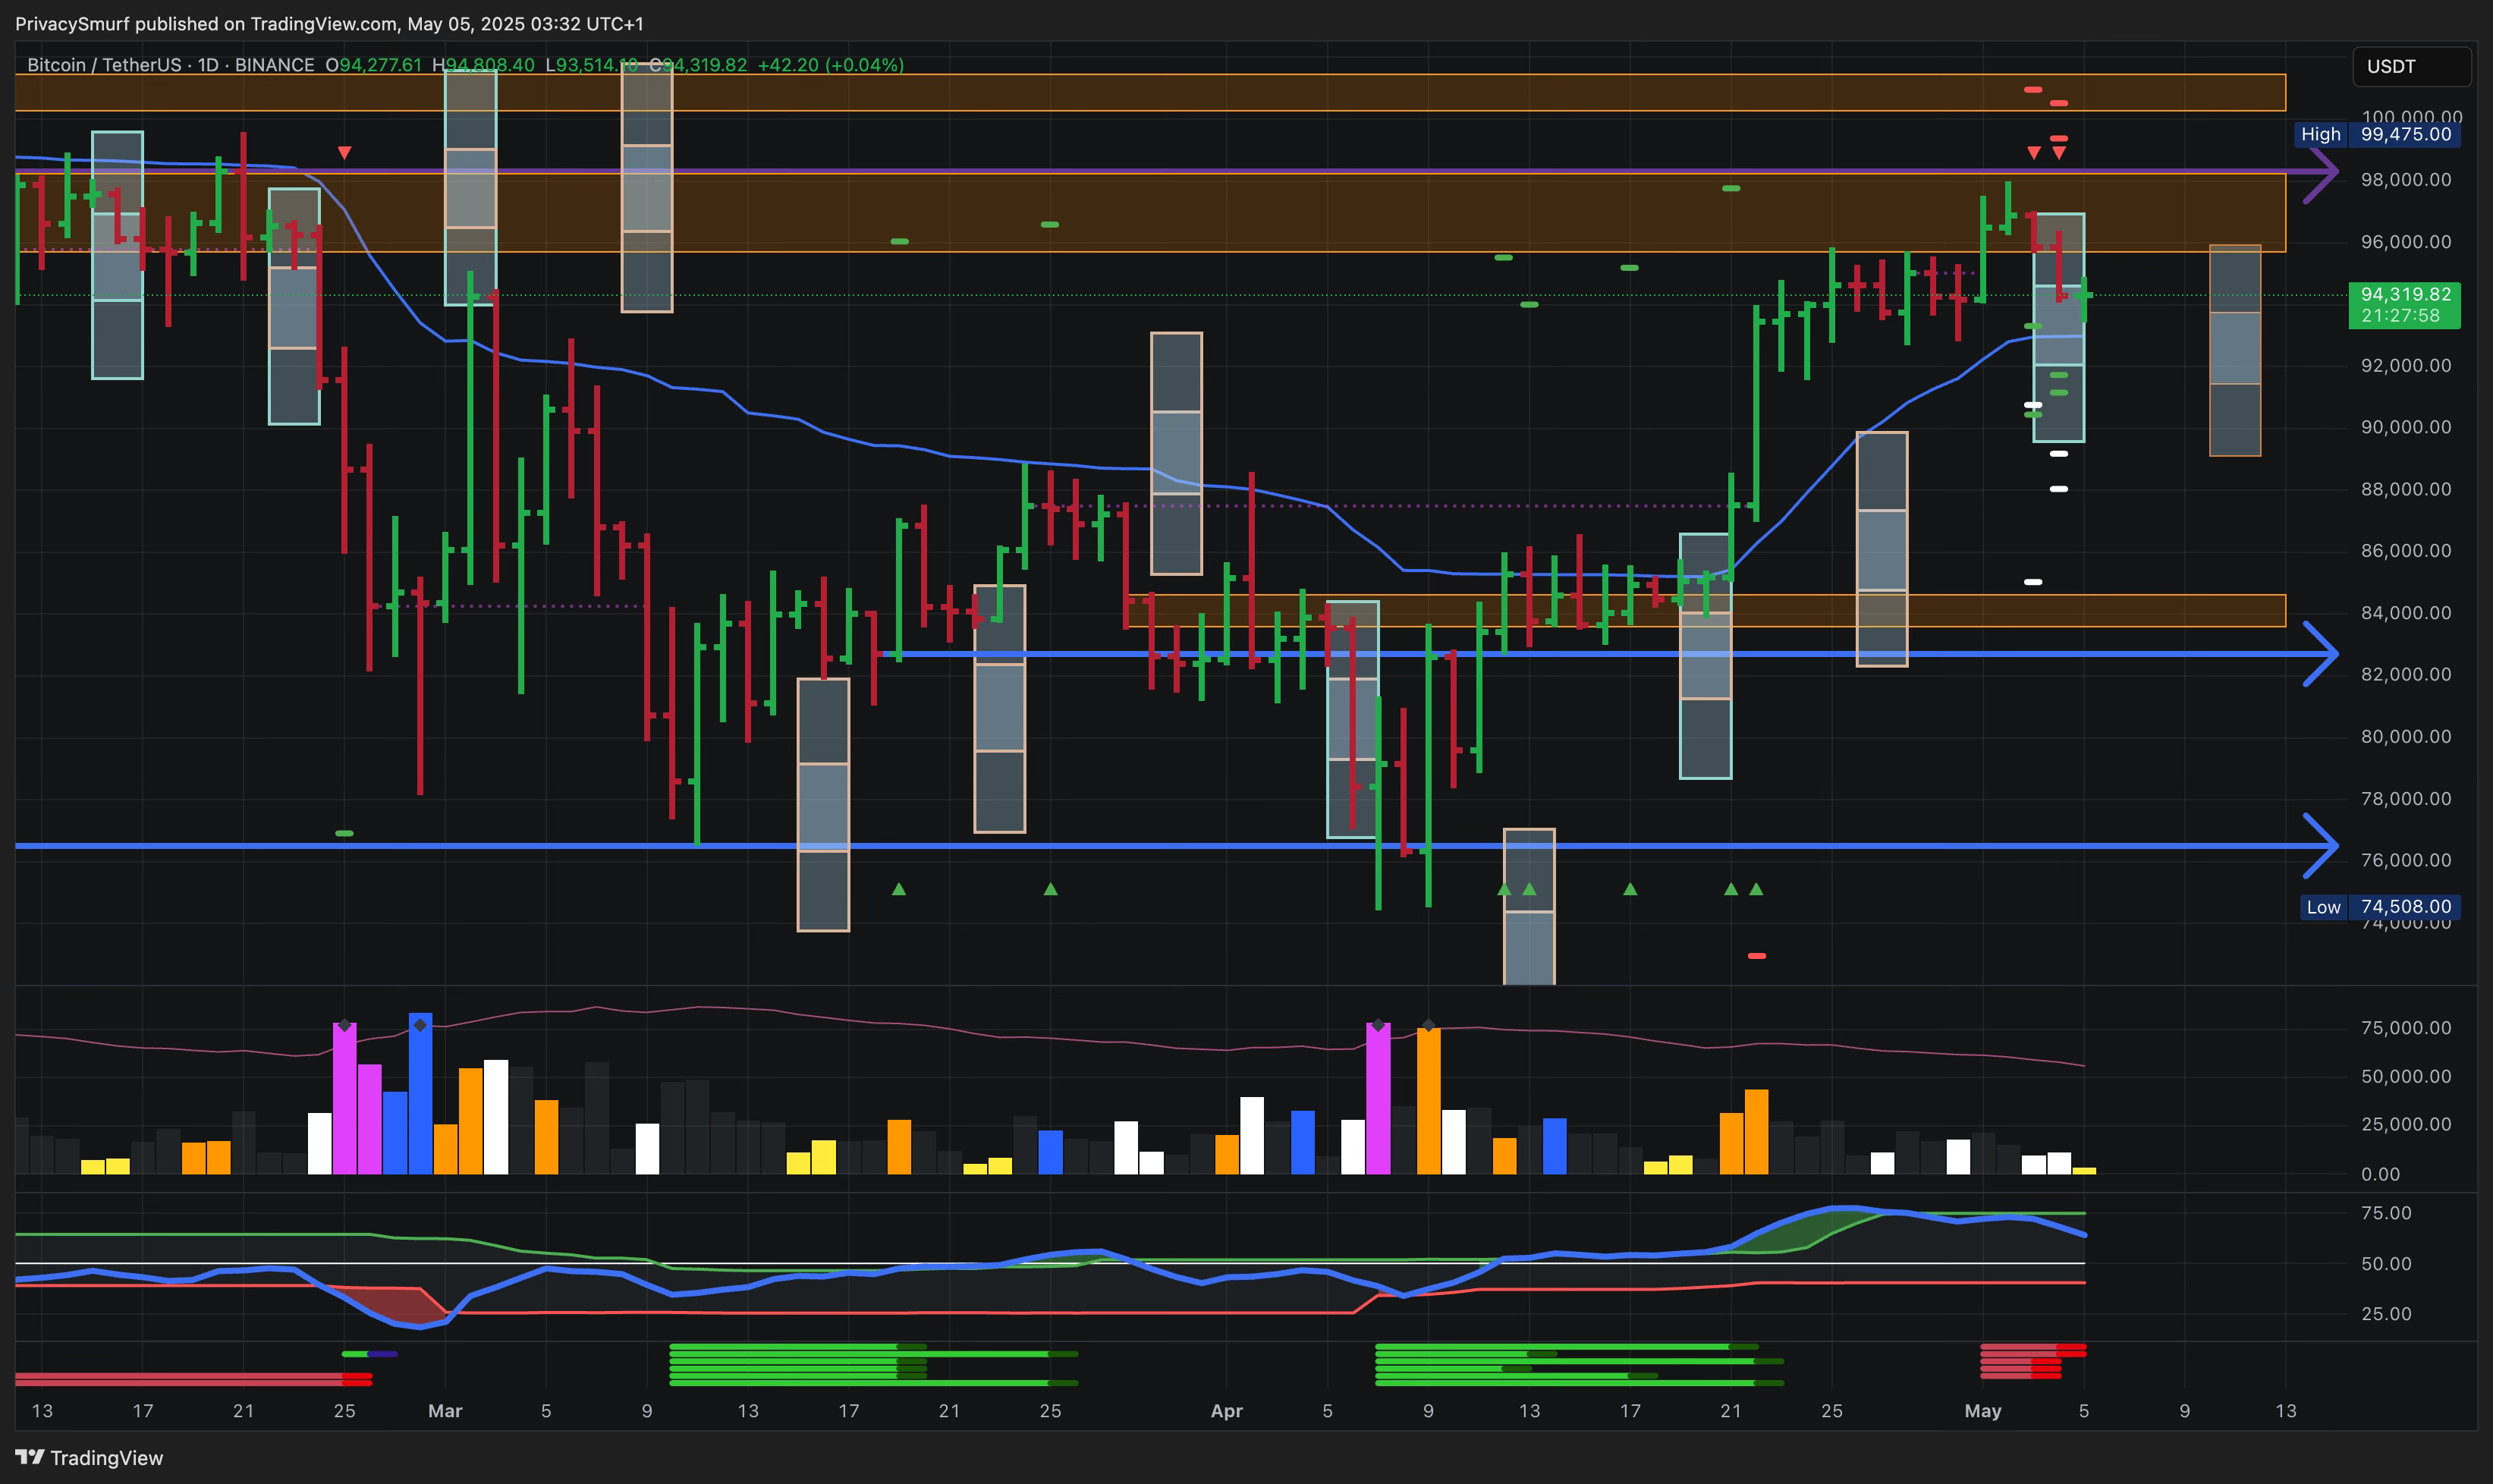
Support zone at $82K-$85K; Resistance zone at $96K-$98K; invalidation of bullish bias if daily prices close below $74K.
Weekly Closing Range is forecasted at $89.1K - $95.9K by Sunday. 14 out of 27 (52% efficiency)
Indicators & Oscillators:
RSI: Suggesting a bullish momentum top and/or price consolidation range formation because measurements are:
Currently above midline - momentum is generally bullish, it’s easier to go up than down.
Closing below adaptive top band - bullish impulsive action has ceased with a failed momentum breakout from the $94.6K ceiling.
Divergence Signals: Confirmed bullish divergence targets at $94K have been hit. Secondary targets remain around $104K. I’m not optimistic about the secondary target more-so now because there are now confirmed bearish divergence targets at $93.3K and $90.8K.
📉 Technical Deep Dive (ETH & ALTs)
Price Action (ETH): Bullish Bias
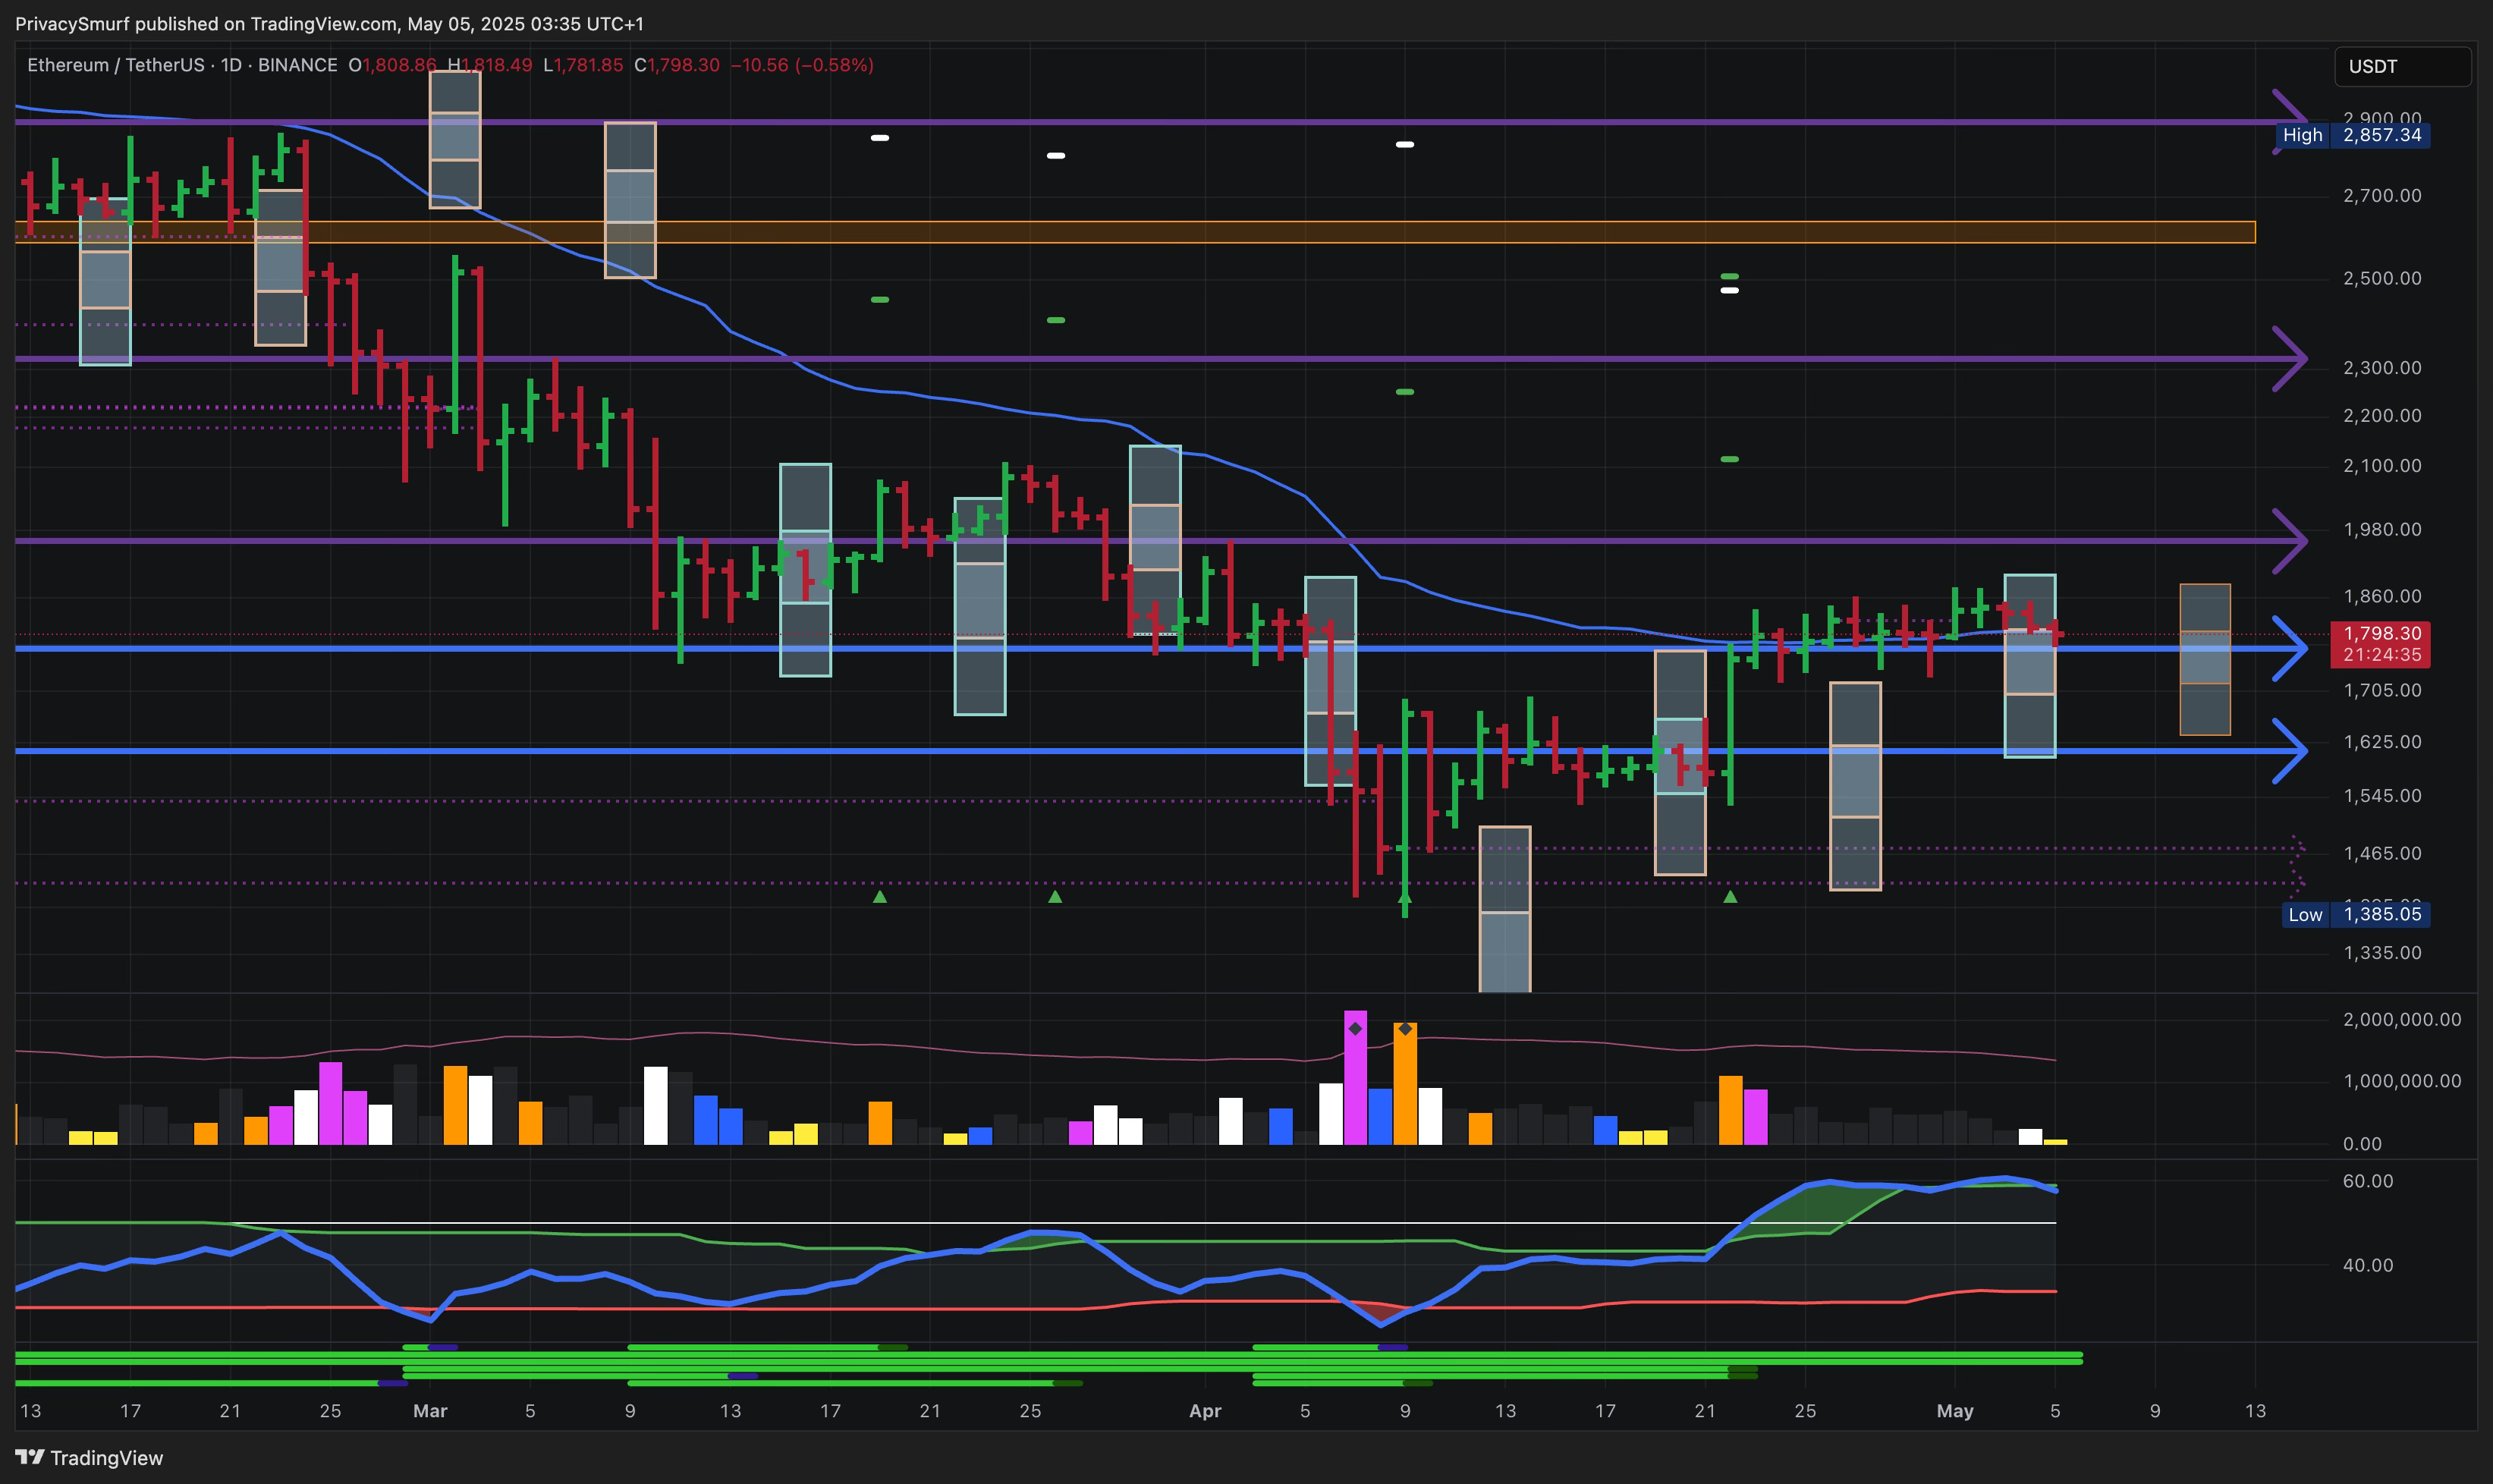
Largest support zone at $1400-$1500 with support additionally at $1612; Resistance at $1960; invalidation of bullish bias if daily prices close below $1400.
Weekly Closing Range is forecasted at $1636 - $1883 by Sunday. 12 out of 24 (50% efficiency)
Indicators & Oscillators (ETH):
RSI: Suggesting ceiling and/or consolidation range formation because measurements are:
Currently above midline - momentum is generally bullish, it’s easier to go up than down.
Pending closure below adaptive top band - bullish impulsive action may cease with a new momentum breakout ceiling at $1842.
Divergence Signals: Confirmed bullish divergence targets are placed around $2250 and $2800. With the RSI pending a bullish momentum ceiling I’m not optimistic about either target in the short term.
ALTs: Still lagging behind the market and now showing similar declining bullish momentum. Opportunities are dwindling in the short term. The focus remains on ALTs that have been up trending and are at critical resistance levels. Wait for breakouts that allow for tight stop losses.

🧭 What’s the Plan?
**🧭 Trading Plan & Scenarios**

*   **Bullish - BTC Breakout Continuation:**
    *   Condition: Close > $98K
    *   Action: Eval. new leveraged longs
*   **Caution - BTC Consolidation:**
    *   Condition: $90K < Daily Closes < $94K & RSI inside bands
    *   Action: Consider short-term range trading, buy support & sell resistnace
*   **Bearish - BTC Bullish Invalidation:**
    *   Condition: Close < $74K
    *   Action: Close short-term spot BTC position
*   **ALT Rotation Confirmed:**
    *   Condition: BTC < $94K, & BTC.D stable or dropping, & OTHERS.D increasing
    *   Action: Eval. ALT breakouts

---

**📌 Risk Management**

*   **Stop-Losses:**
    *   BTC: Daily close < $74K
    *   ALTs: Placement under clear pivot point ideally < 12% below entry
*   **Position Sizing:**
    *   BTC: Small to moderate entries
    *   ALTs: Small entries
🔮 My Long-Term Market Reflection

Macro Cycle Status:
Bull market still intact but in a phase that in the past lead to bear market confirmation.
Historical Comparison:
Similar patterns to the prior bull market suggest caution; historically, failure to breach all-time highs before turning back down signaled bear market onset.
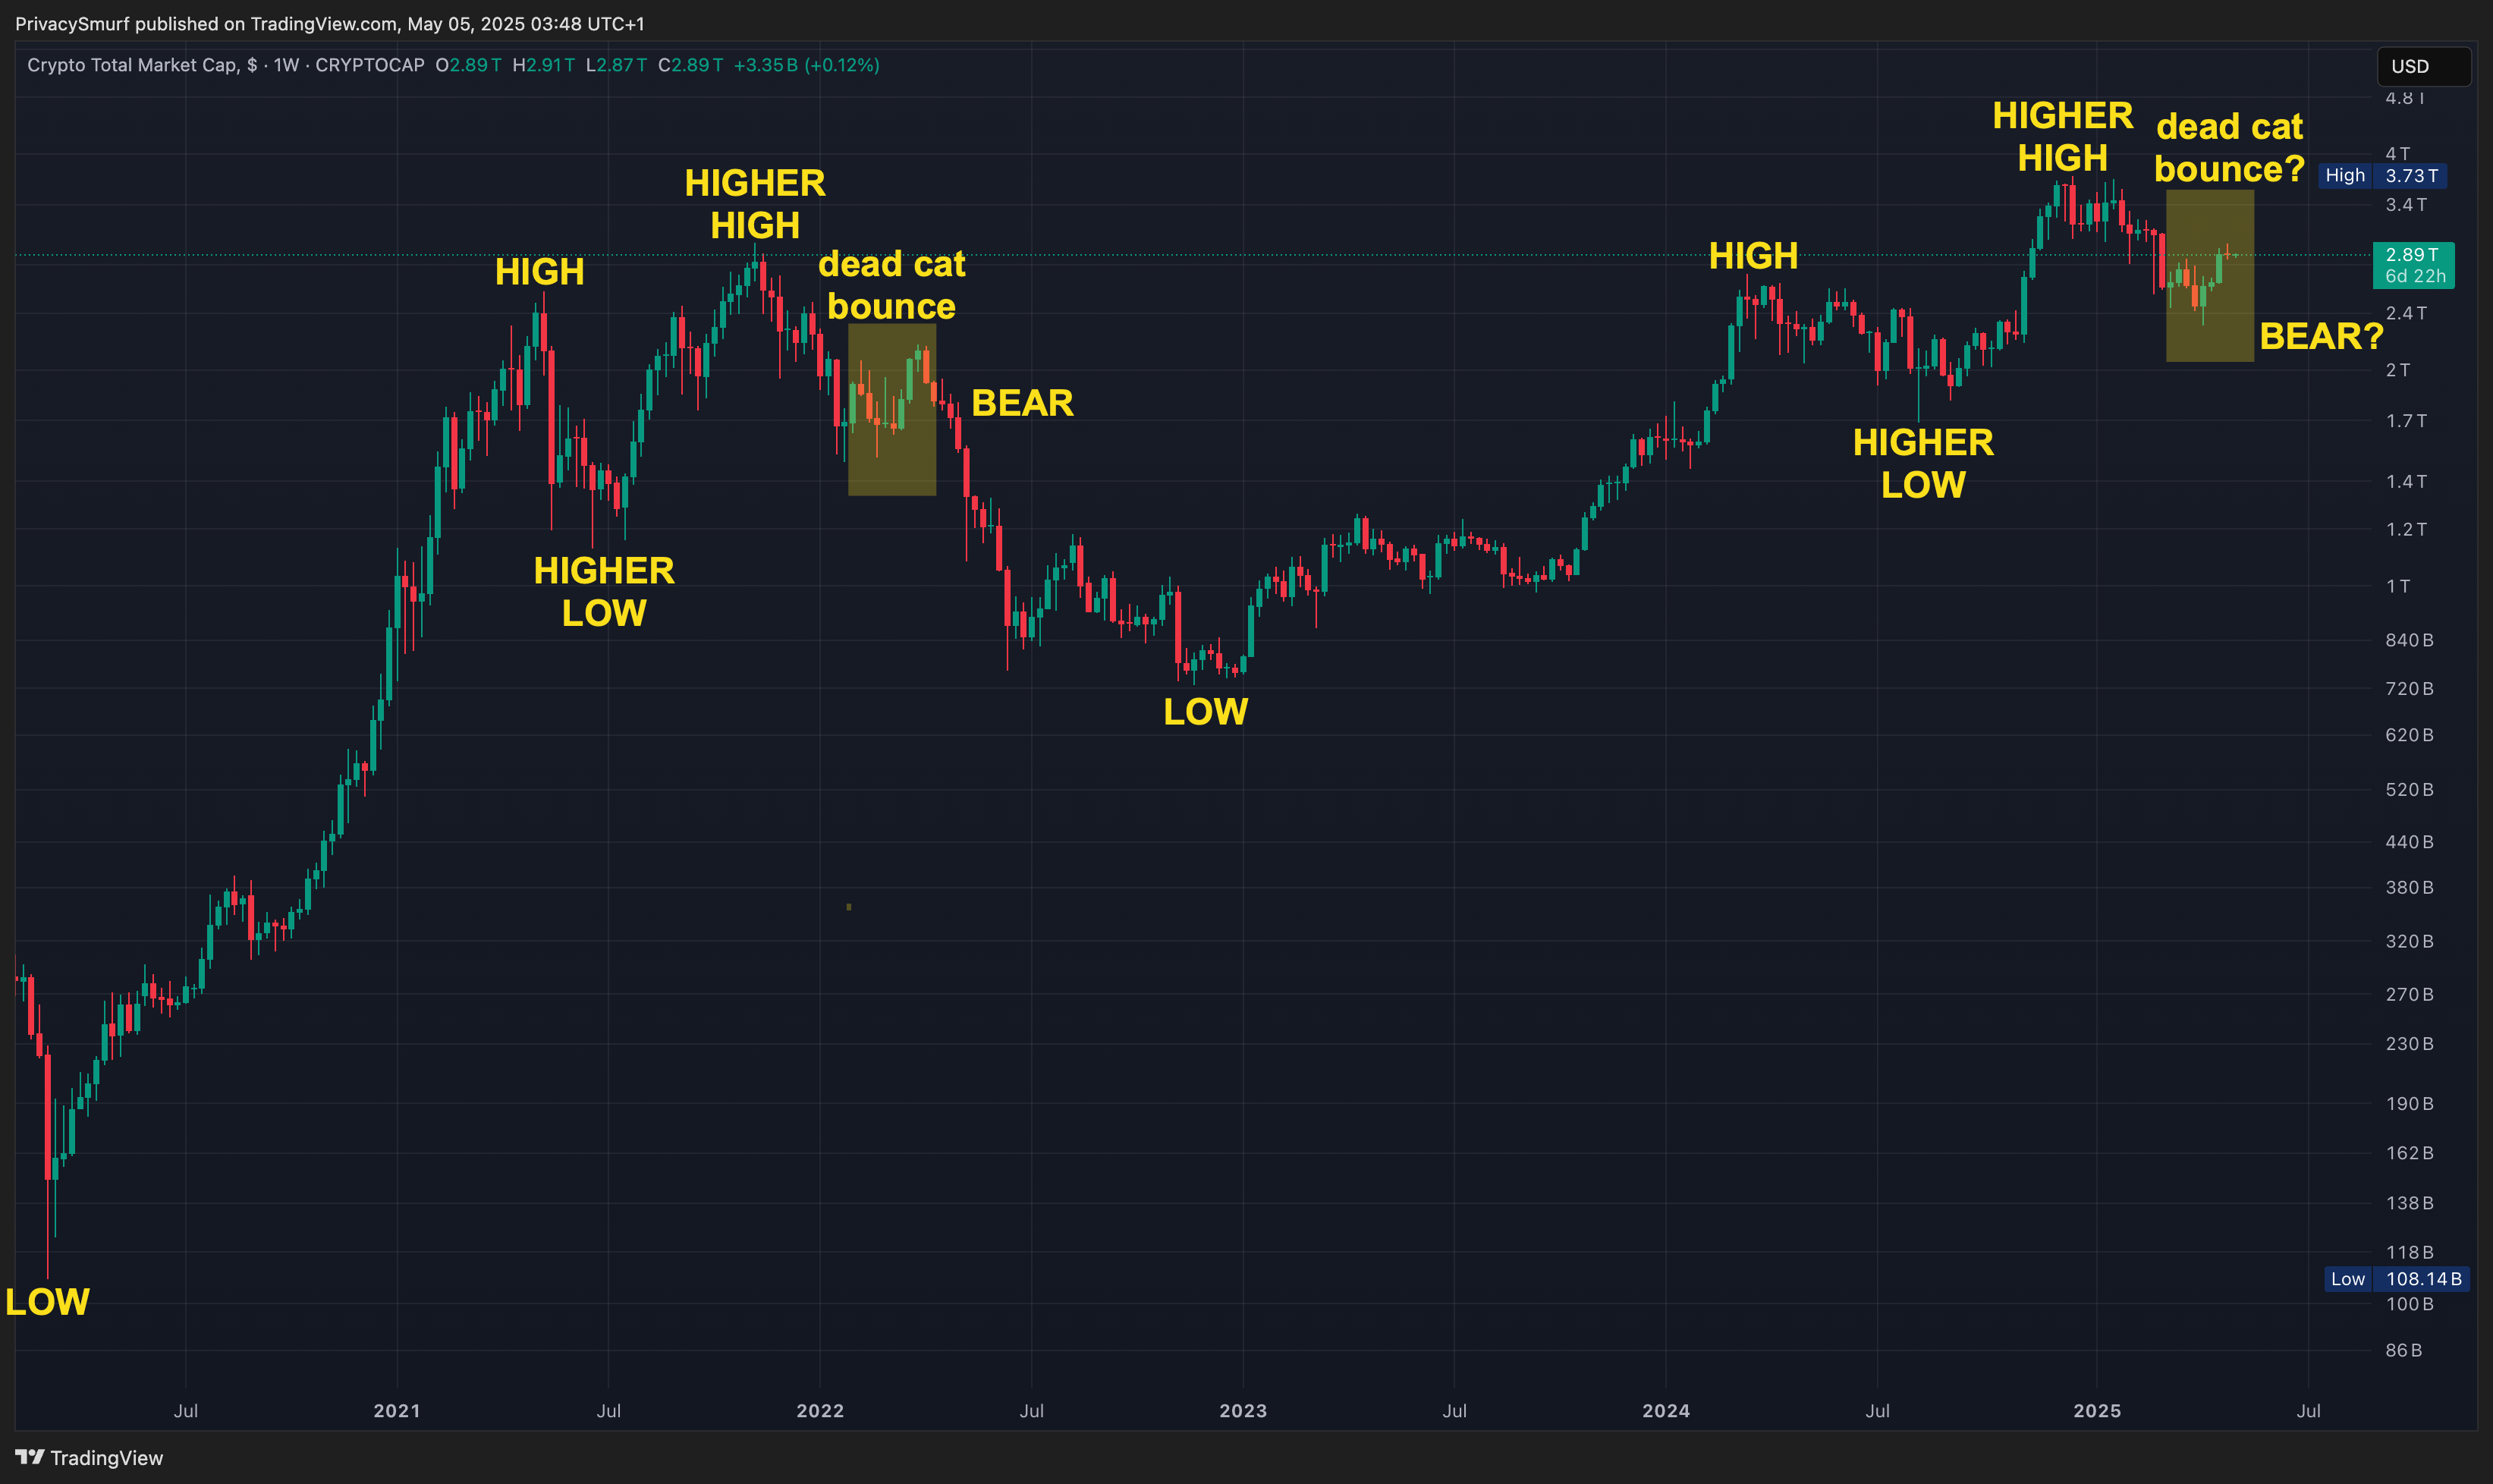
Personal Expectations:
As time progresses without setting new price highs, we continue to shape the market similarly to the last bull market.
In a perfect mirroring scenario, we would have already hit the lowest low and initiated a rally, only to establish a macro lower high over the next 4 weeks before transitioning into a bear market. This timeline matches very well with the current peaking window for the daily chart, according to the quarterly forecast. Read that here if you haven’t yet.
We have met the initial targets for the bullish divergence trade signaled back in March and have failed from the top of the resistance zone. There are no promises on any higher targets and a rollover to new lows from here would not be unprecedented.
We have left the first price peak timing window for BTC. The key thing to note is a topping window does have to mean prices go down. It can also present as a pause in an uptrend. That would appear to be the case so far seen below.
The next bottoming turning point for a bottom is between May 10 - May 15, and the expectation is a daily close below $93457 and ideally above $76276.
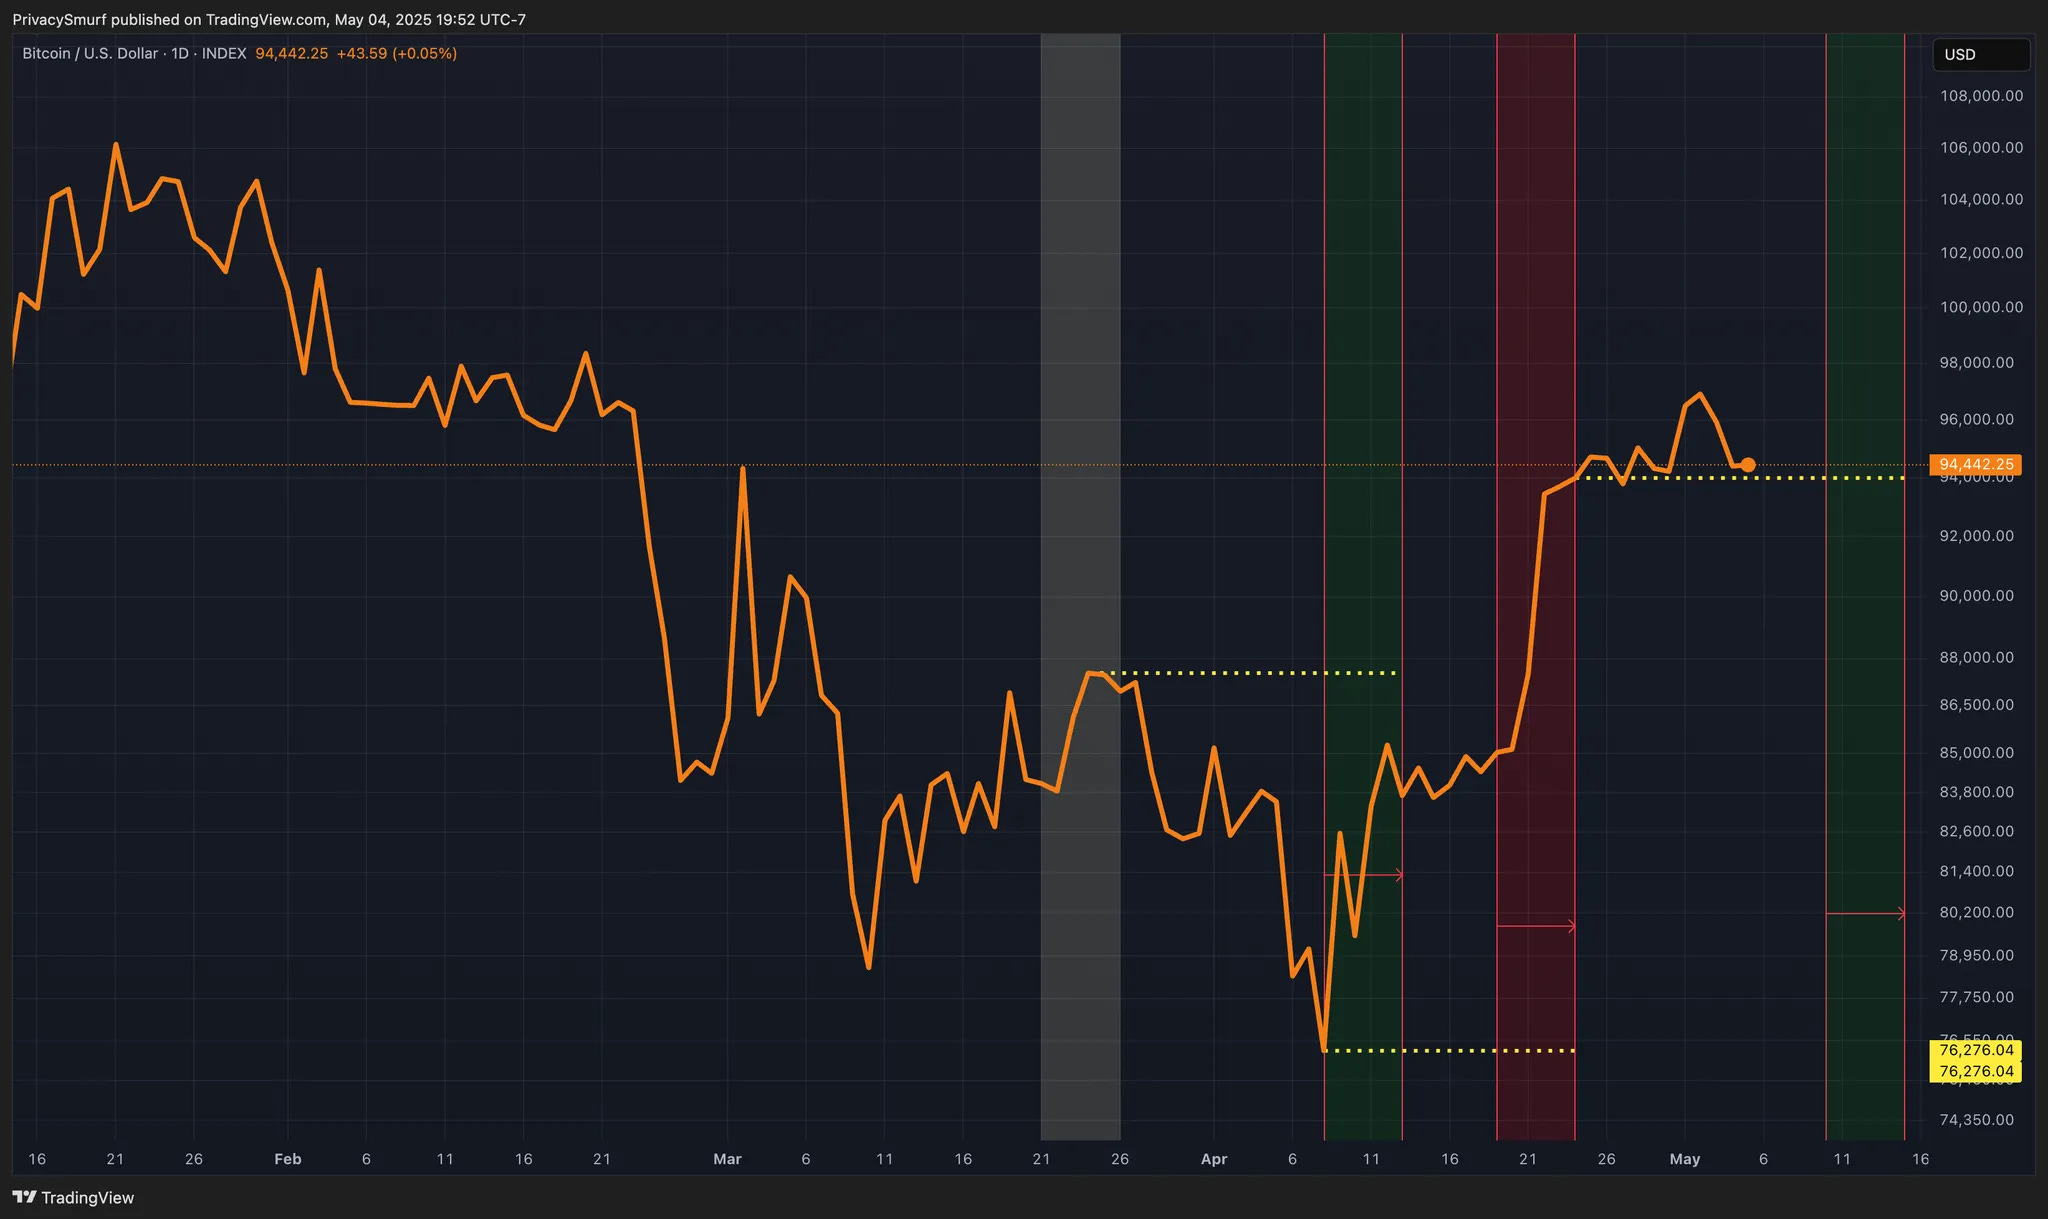
With the confluence of the topping window, the daily bearish divergence signal and retail sentiment being at an extreme I took profits again at $95.8K. Ideally, I’ll have an opportunity in (or before) the early May bottoming window to purchase at a lower price.
🎯 Key Takeaways
BTC: Caution near resistance ($96K-$98K). Momentum waning, bearish signals confirmed. Monitor support ($82K-$85K); below $74K risks bullish invalidation. Consider more profit-taking.
ETH/ALTs: Caution!! Lagging BTC with similar pace slow down. Selective ALT breakouts require extreme care and tight stops.
Strategy: High greed + market structure resembling past tops = elevated risk. Adhere to your plan, manage risk rigorously (stops/sizing).
@ThePrivacySmurf
Thank you as always