


Quarterly Market Synthesis: Q2 2025

Last quarter’s analysis was good. I captured 21 out of 31 turns across all the datasets. If we look at just the majors, I accurately projected 7/8 on the Total Crypto Market Cap and 5/6 on Bitcoin. You can check the full after-action report below.

The key point, if you don’t want to go back and read Q1’s report, was ‘non-trending until mid-February, with potential rallies into March and the market testing lows before rebounding.’ This was the case except for the rebounding part. Upon testing lows in late February, the market rolled over through the rest of March. This pushes me further into believing the bull market is on its last legs. The only true thing is that ‘No One Knows’ what’s next, but maybe I can bring us closer to a certainty.
Before we begin:
As a quick reminder, all of my analysis is available for free. The paid membership for the newsletter is optional and serves as a way to support my work if you find value in it. Additionally, sharing this analysis benefits both me and the entire trading community.
Unfortunately, the market is often inundated with unreliable forecasts and analyses that lack accountability for their inaccuracies. My goal is to cut through the noise by offering thoughtful, data-driven insights that empower traders to make informed decisions.
By sharing this analysis, you’re amplifying a resource rooted in reliability and data integrity. Together, we can build a community of more intelligent, more confident market participants and raise the standard for credible market analysis. Let’s elevate the conversation and create a lasting impact in the trading world.
On with the show…
TL;DR
Market Outlook: The crypto market is expected to show signs of consolidation through April, with potential upward movement (but below all-time highs) before facing downward pressure in late May. Market capitalization is likely to experience growth in the first half of the quarter, likely followed by a decline through the remainder of the quarter.
Key Insights:
Monthly and weekly patterns indicate a bearish outlook, but a temporary upward movement is anticipated.
Bond prices, which are trading inversely to Bitcoin, are expected to rise in late April and then decline later in the quarter, which may be reflected in Bitcoin as a retrace to establish a higher low before a bullish May.
The Zenalytics Stress Composite shows increased financial stress, potentially impacting risk assets; however, periods of easing conditions may create buying opportunities.
Actionable Strategies:
Monitor for possible breakout signals, such as BTC surpassing $87,000 and the total market capitalization breaking above $2.75 trillion before late April.
Look for a higher low formation in BTC and altcoins around early May.
Stay cautious with altcoin investments while watching for breakouts above resistance levels.
Prepare for potential shifts in market conditions around the end of May and be ready to adjust positions based on macroeconomic influences.
This quarter hinges on market dynamics between April and May, with the interplay of various datasets providing insights into possible future movements in the crypto market.
Overall Crypto Market Analysis
Understanding Market Capitalization
To comprehend the current state of the cryptocurrency market, we need to look at the overall market capitalization of the top 125 cryptocurrencies.
https://www.tradingview.com/chart/q1FGcIlr/
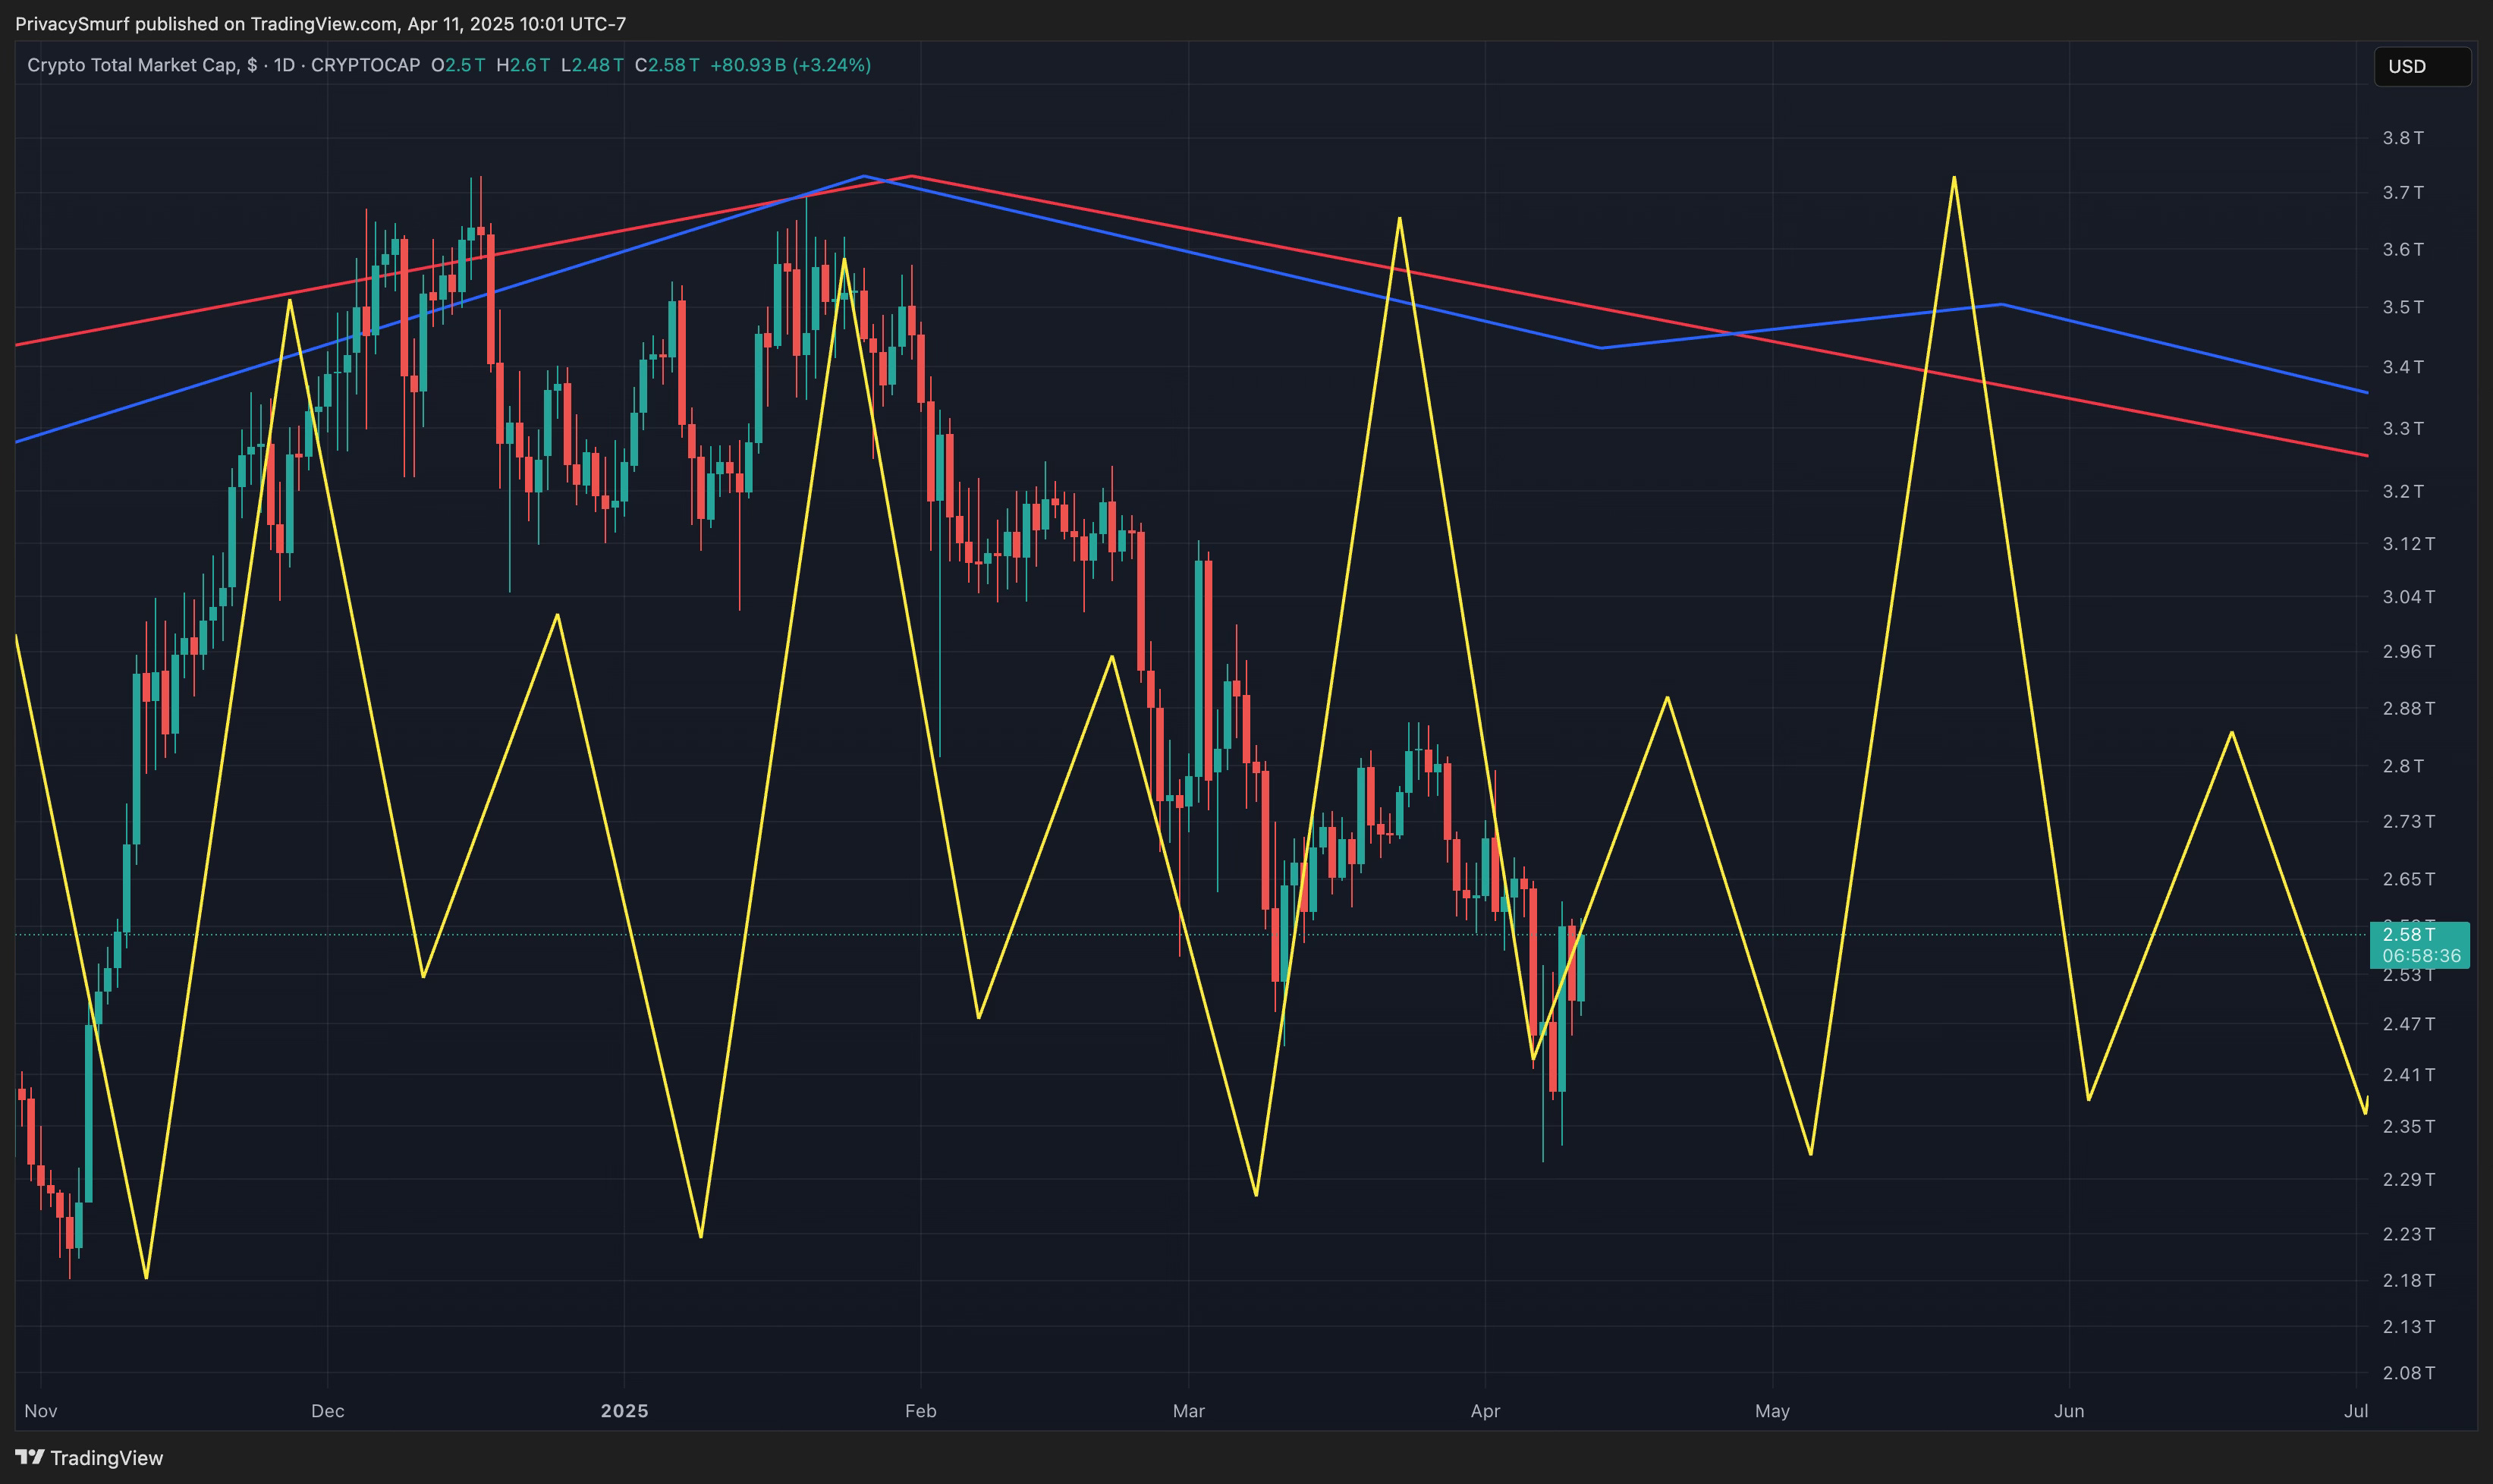
What’s on the Chart:
The monthly (red) and weekly (blue) patterns demonstrate a downward trajectory. However, there's been a momentary shift: as we head from April into late May, we observe a brief upward movement.
The daily data (yellow) reveals some fluctuation with no consistent underlying trend throughout the quarter.
I would estimate a 60% likelihood that future price action will reflect alignment with the daily (yellow) turning points.
What This Means for Traders:
I anticipate that the total market capitalization will likely grow throughout the quarter's first half. At the very least, we can expect a halt to the current decline. To identify potential buying signals, watch for:
Breakout Alert: A breakout above $2.75 trillion before April 17th.
Higher Low Formation: A higher low forming above $2.4 trillion around May 5th would likely be a positive sign.
Conversely, I’ll look for selling signals as we approach the end of May.
Analyzing Total Crypto Market Price Action
Examining market capitalization offers only part of the story. Price action is crucial for completing our analysis. While I'm developing a customized index, I’ve utilized a well-regarded open-source index that I shared last quarter. Check it out here: MarketVector Digital Assets 100.
https://www.tradingview.com/chart/PKbbITpS/
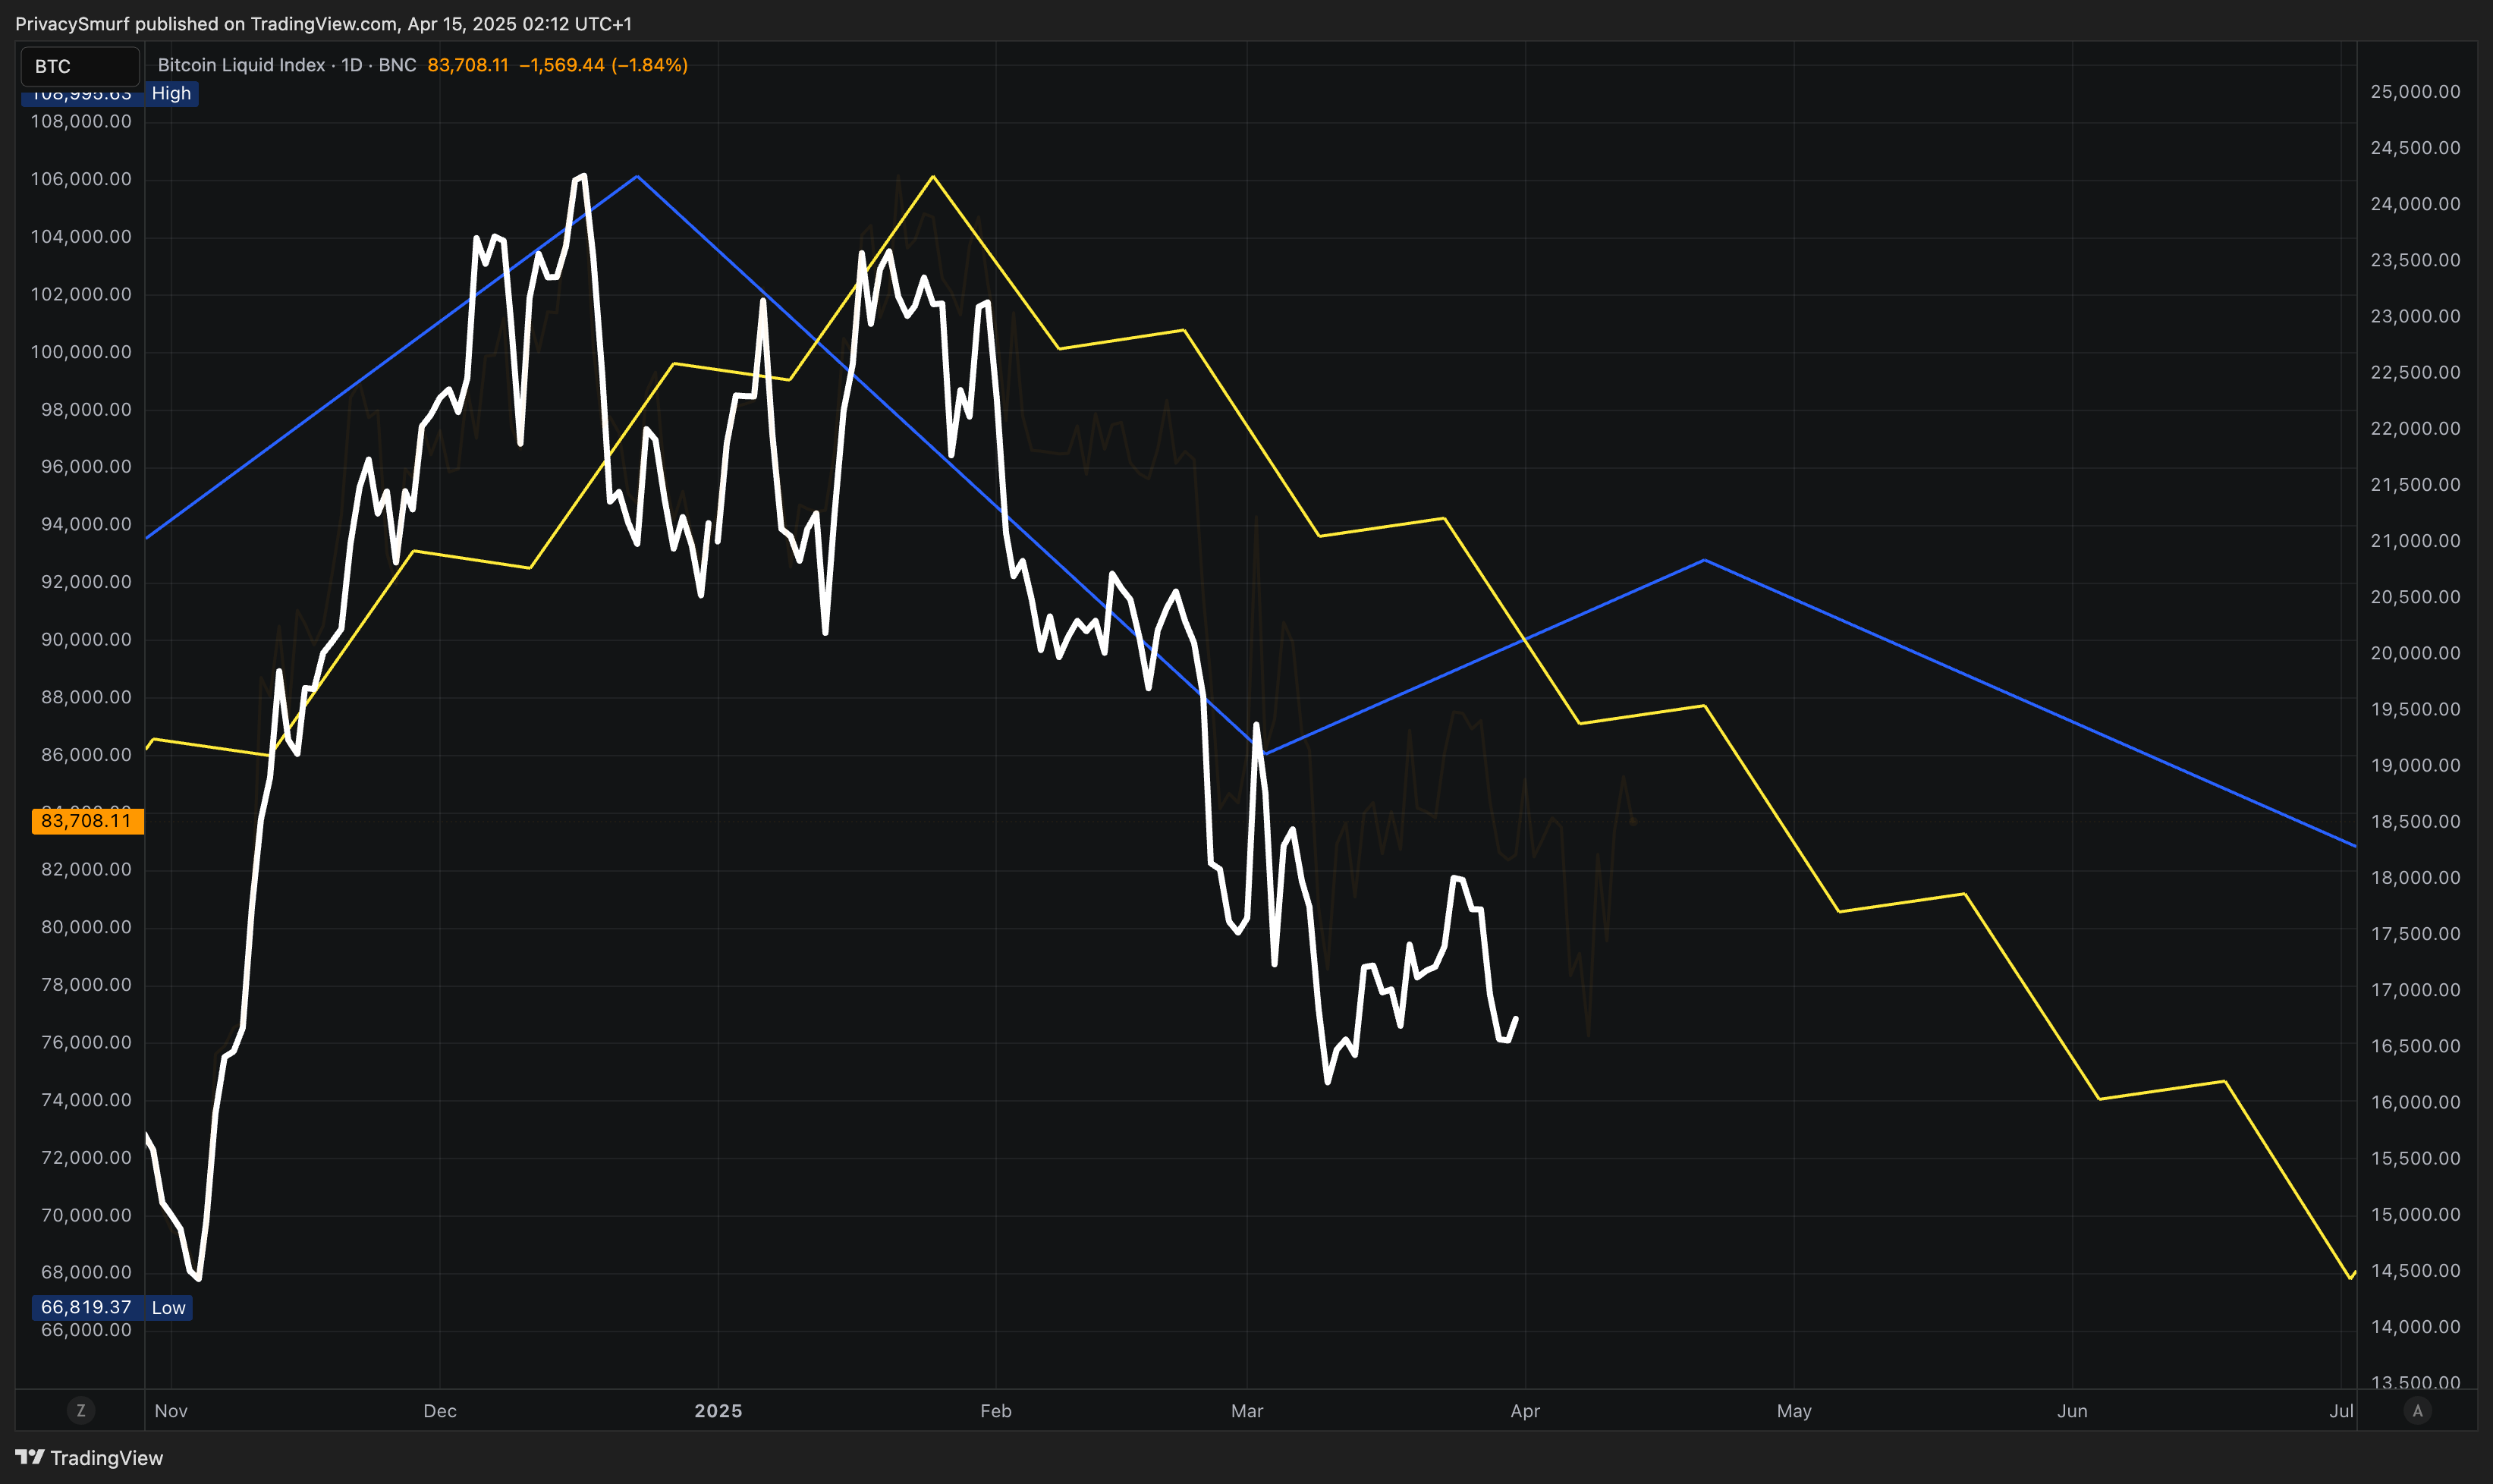
What’s on the Chart:
Since the data is too young, there are no monthly patterns yet.
The weekly (blue) and daily (yellow) patterns reveal mixed alignment. However, the overall direction indicates downward pressure towards the end of April.
The daily (yellow) pattern showcases a typical downtrend characterized by lower highs and lower lows, timing in line with the weekly peak.
I would estimate a 60% likelihood that the price action will align with the daily (yellow) turning points.
What This Means for Traders:
I expect collective price action in the crypto market resembling a relief rally before continuing on a downtrend. To identify potential buying signals, watch for:
Breakout Alert: A breakout above $18,000 sometime before April 17th.
Higher Low Formation: A formation of a higher low above $17,000 around May 5th.
As for selling signals, I’ll closely monitor the market towards the end of May.
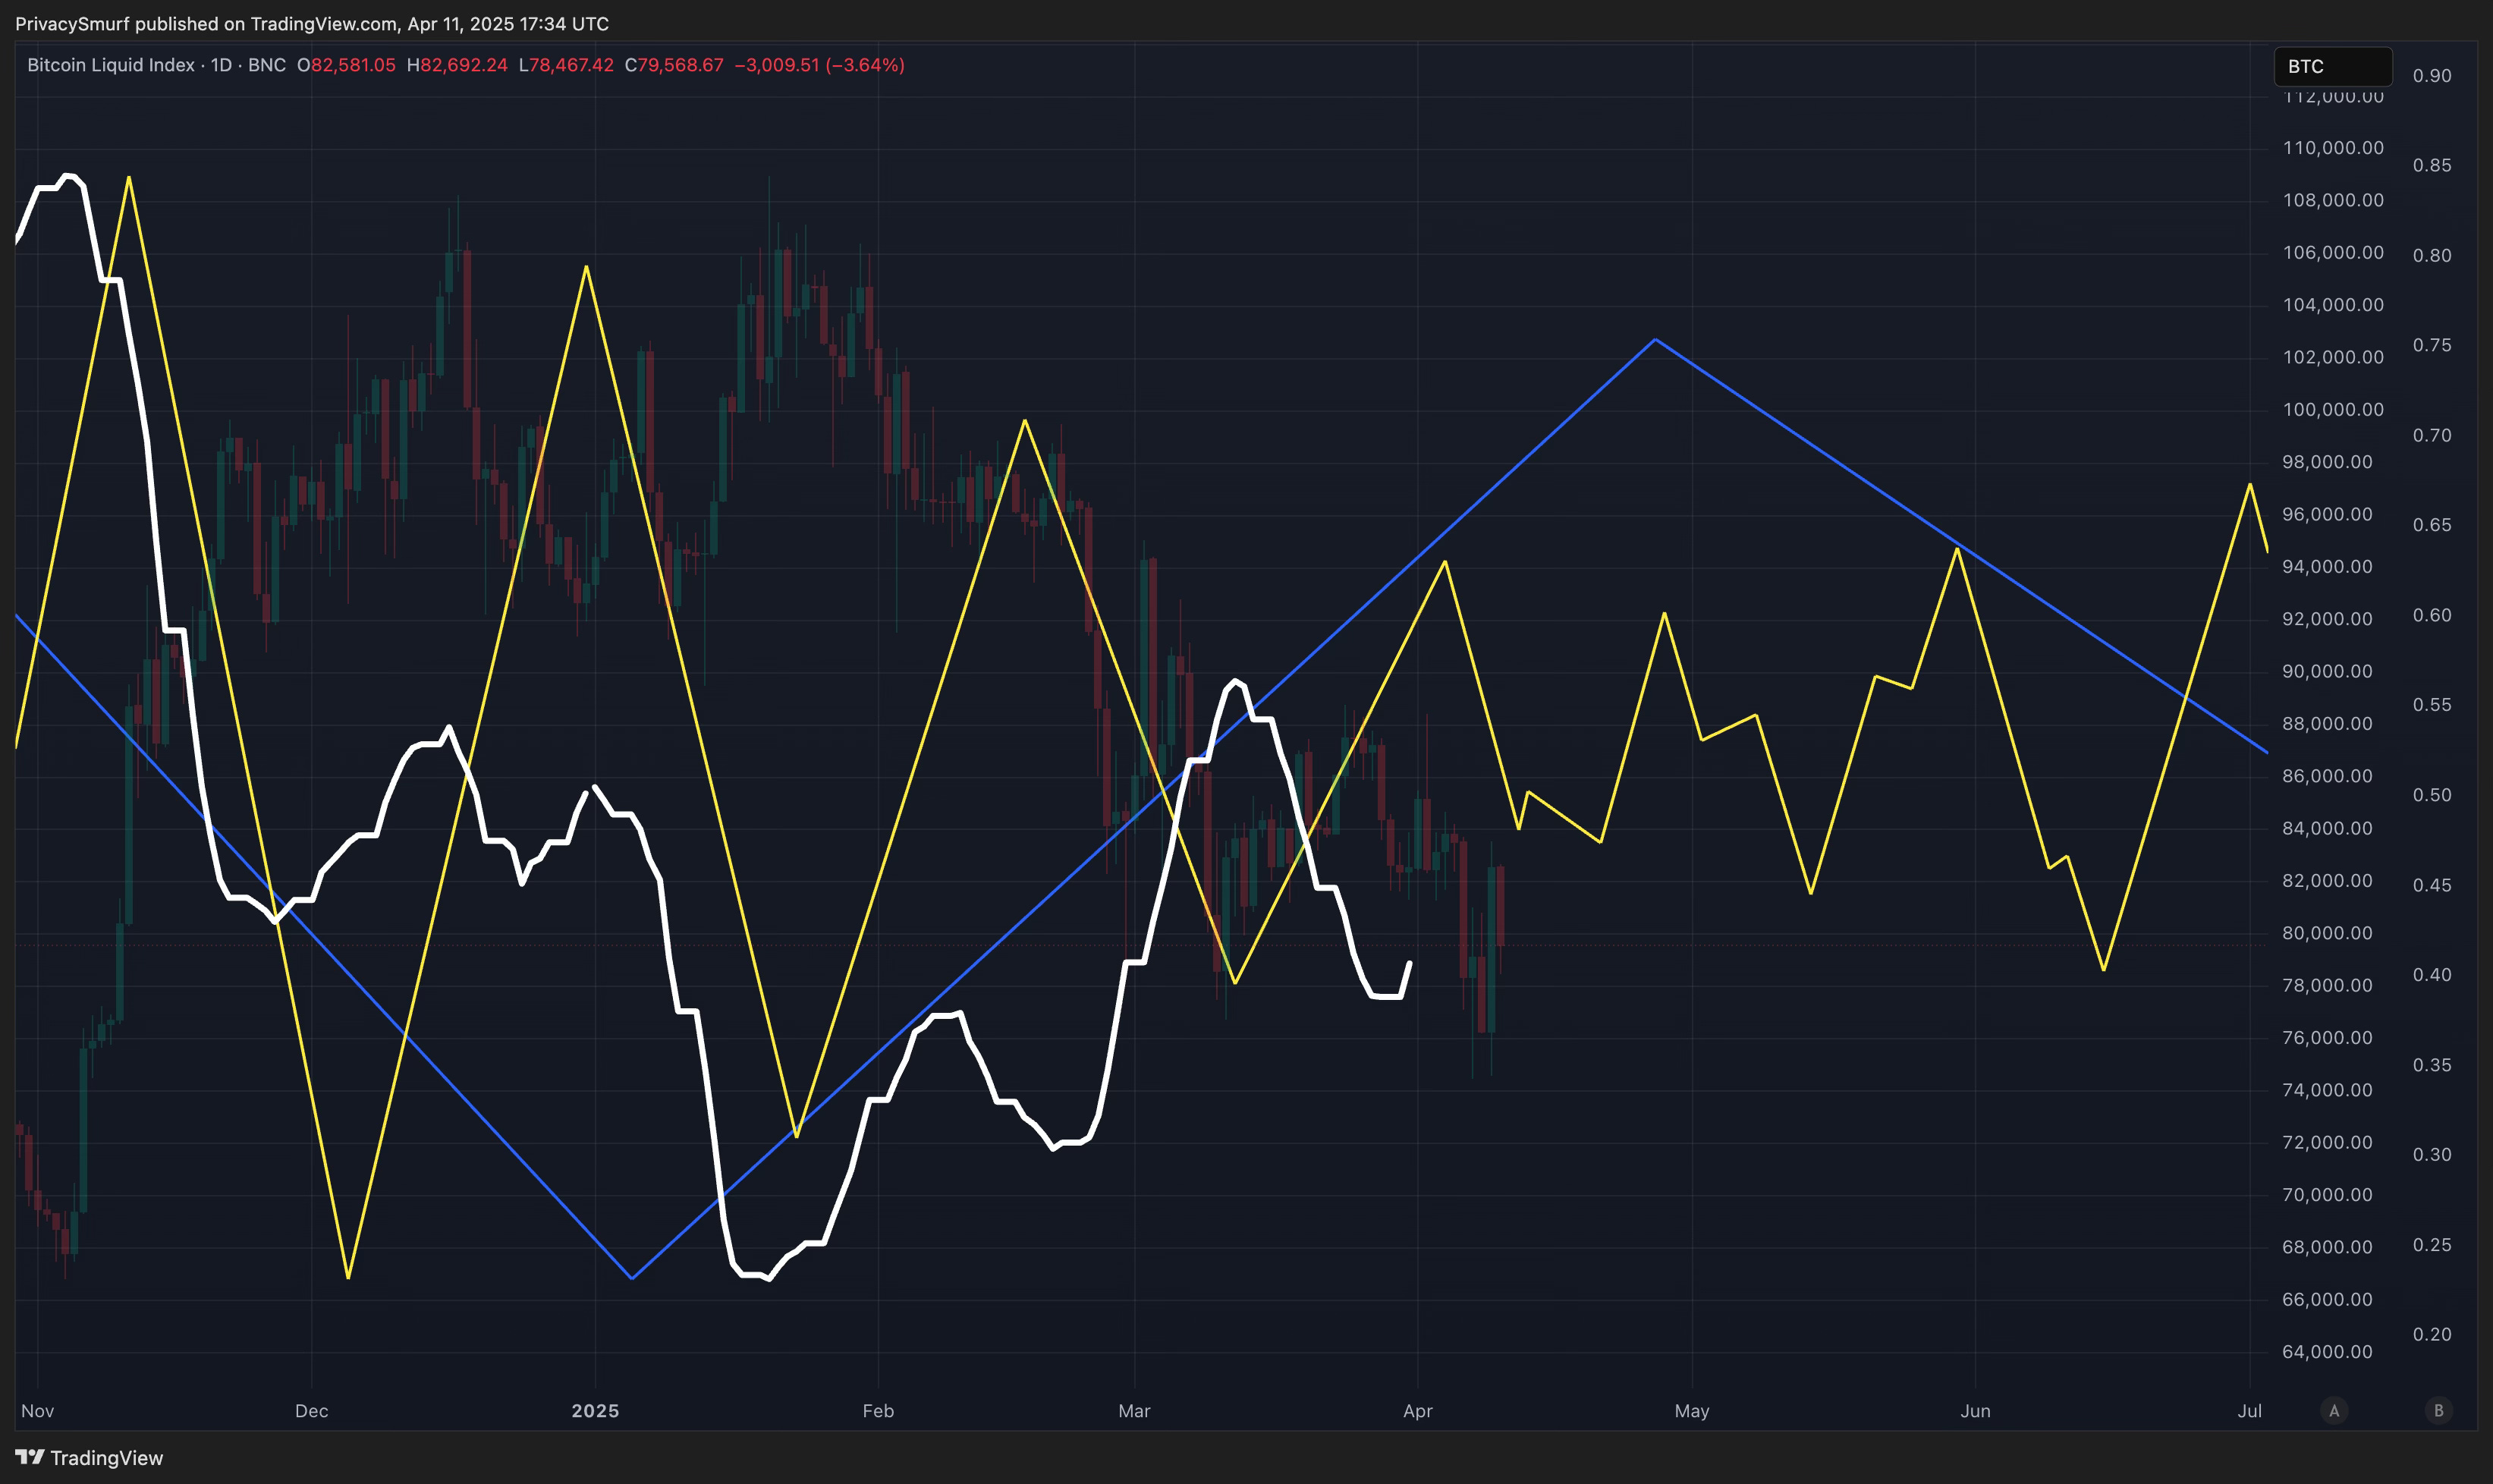
BTC/USD
https://www.tradingview.com/chart/D9Fit7dv/
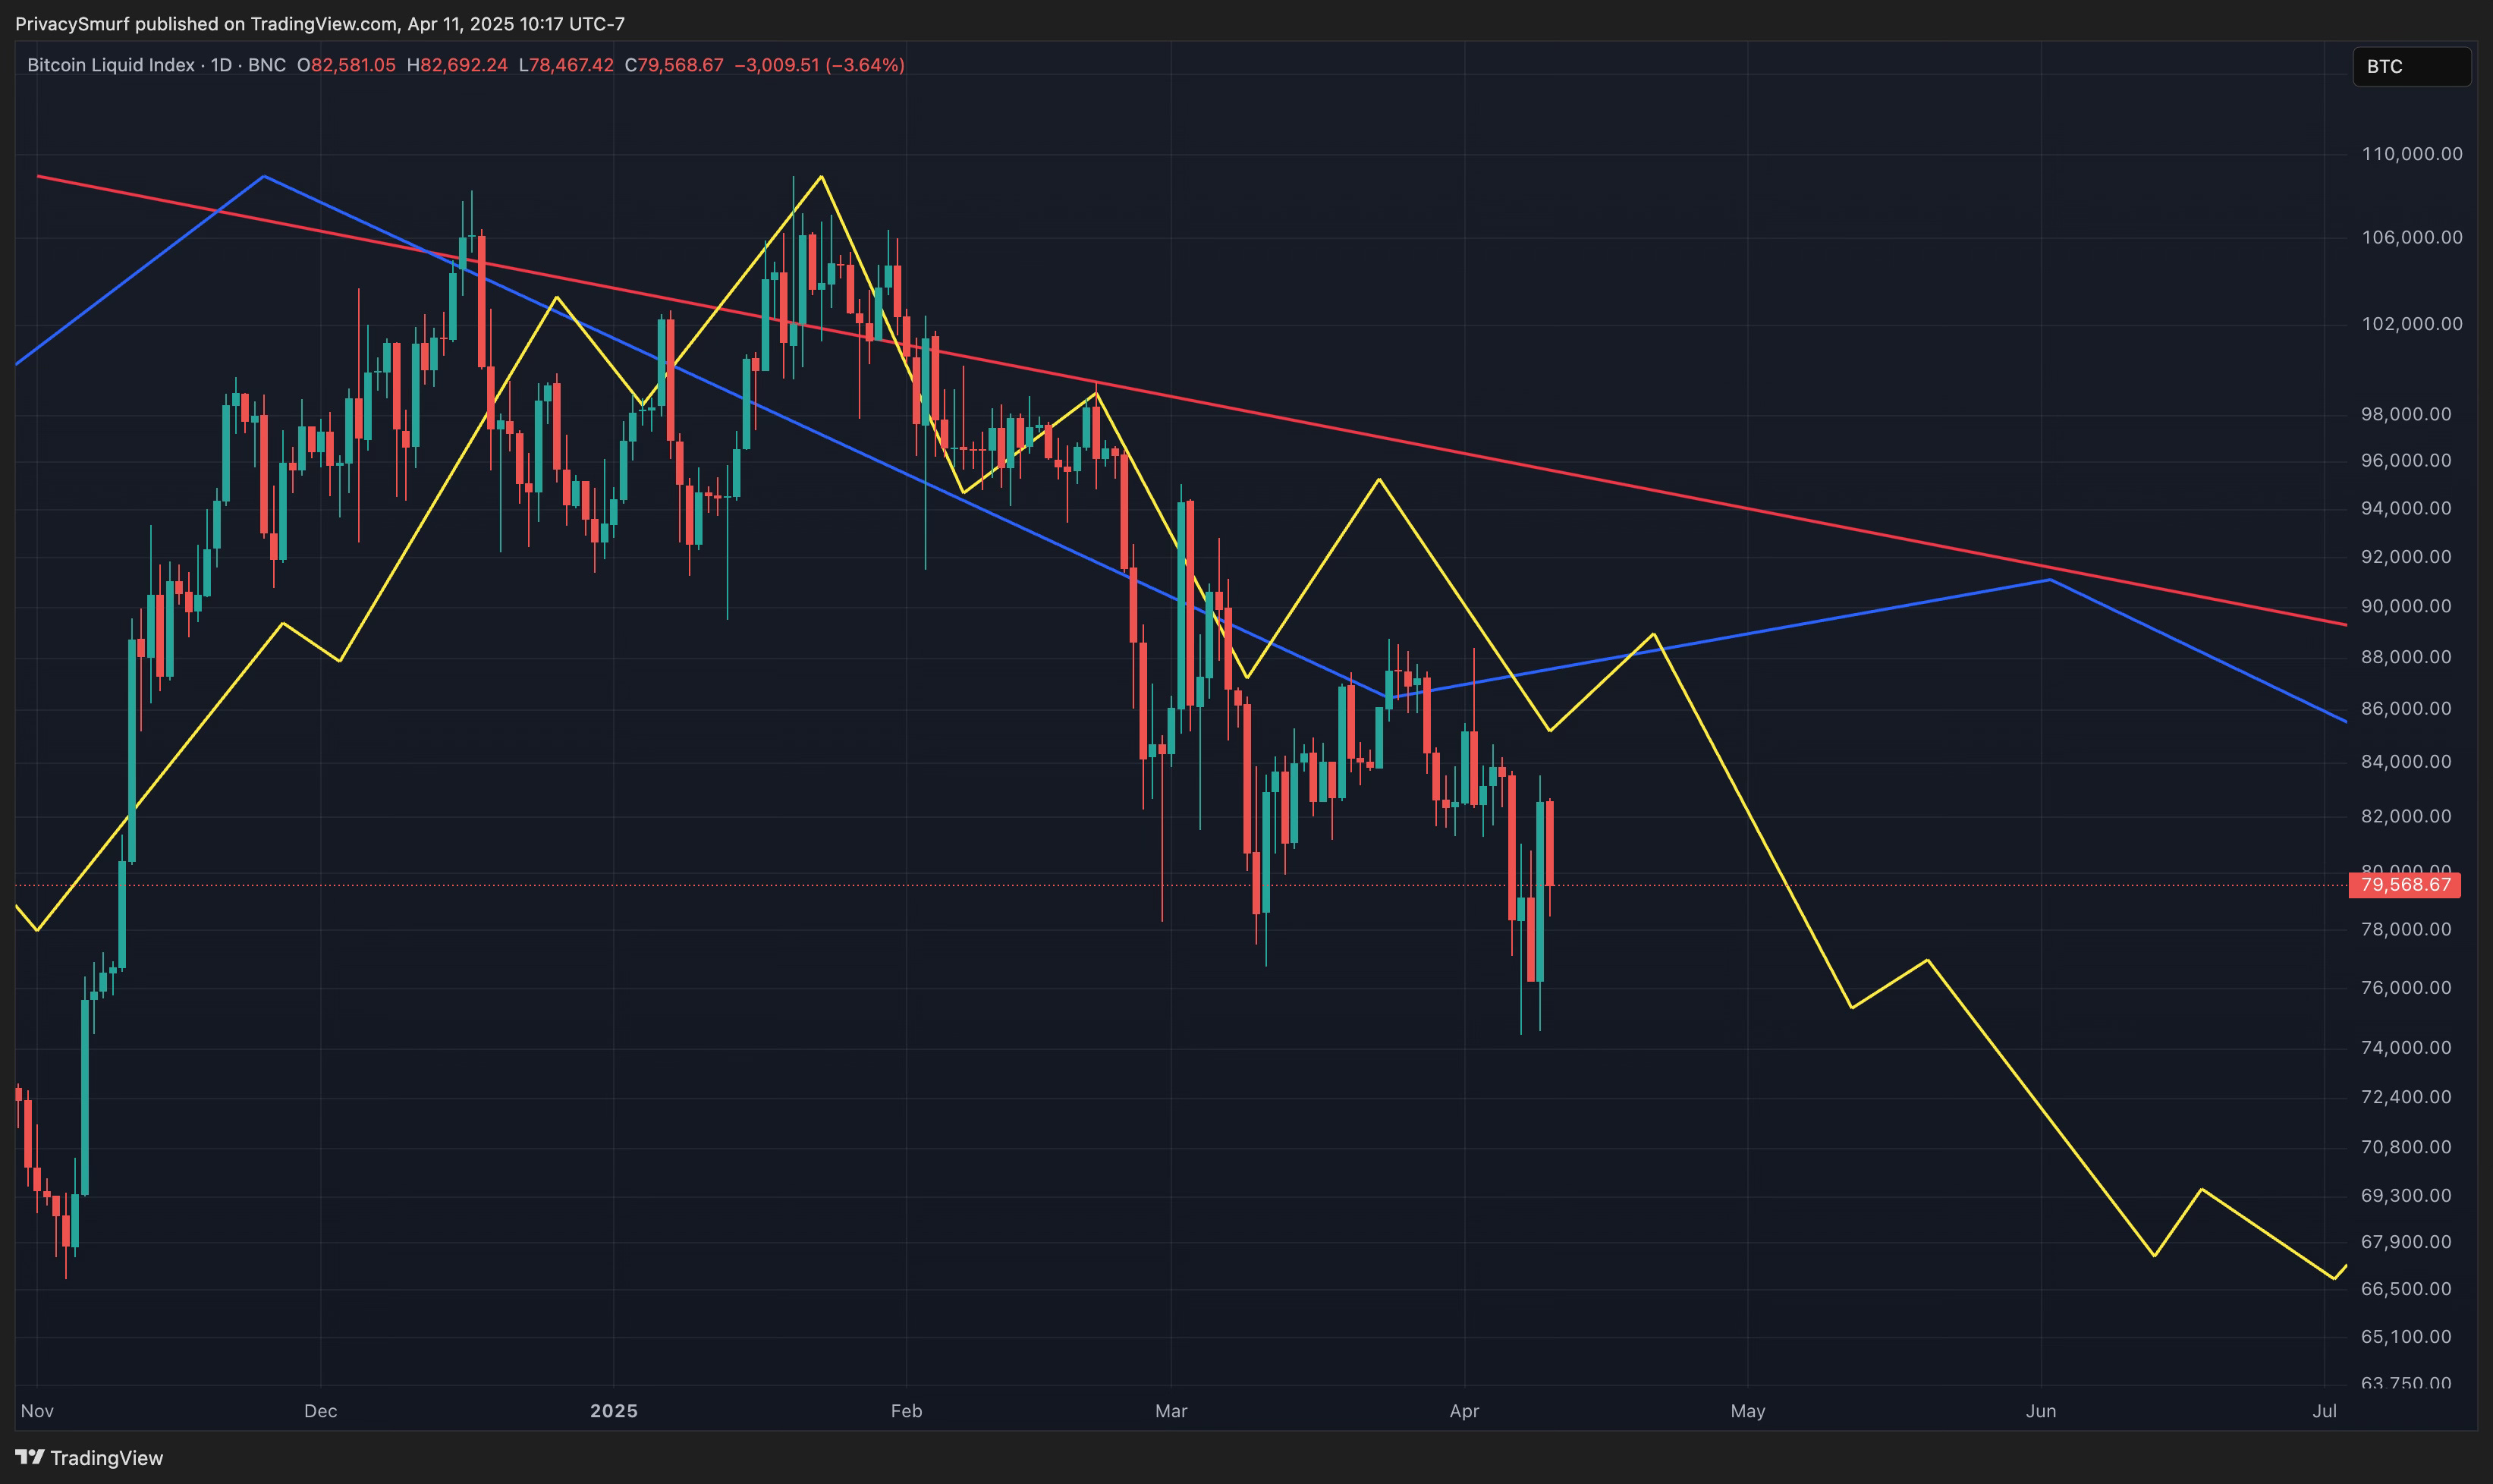
What’s on the Chart:
The monthly (red) and weekly (blue) patterns reveal mixed alignment. However, the overall direction indicates downward pressure towards the end of May.
The daily pattern (yellow) showcases a typical downtrend characterized by lower highs and lower lows.
I would estimate a 67% likelihood that the price action will align with the daily (yellow) turning points.
What This Means for Traders:
BTC will likely remain in consolidation, building a base and probably pulling back to make a higher low in early May. A higher low could move prices towards $94000. To identify potential buying signals, watch for:
Breakout Alert: A breakout above $87,000 sometime before April 17th.
Higher Low Formation: A formation of a higher low above $76,000 around May 12th.
Synthesis with the Earlier Sections:
Given prevailing trends in market capitalization and BTC chart patterns that indicate a downward trajectory later in the quarter, I’m not anticipating a rally that leads to a new bullish trend or new all-time highs (ATHs). Current higher timeframe patterns imply that the long-term bullish momentum is temporarily paused. Any potential bullish movements must navigate against the overall market tide.
If any bullish moves emerge for BTC, they will likely occur before they do for the broader range of crypto assets. However, the market charts are expected to react to BTC simultaneously, as BTC commands a significant portion of the market capitalization.
Spent Output Profit Ratio
The Spent Output Profit Ratio (SOPR) shows whether Bitcoin holders are selling for a profit or a loss. If the SOPR is green, most sellers are making money. If it’s red, most sellers are losing money.
https://www.tradingview.com/chart/nj2ro18x/
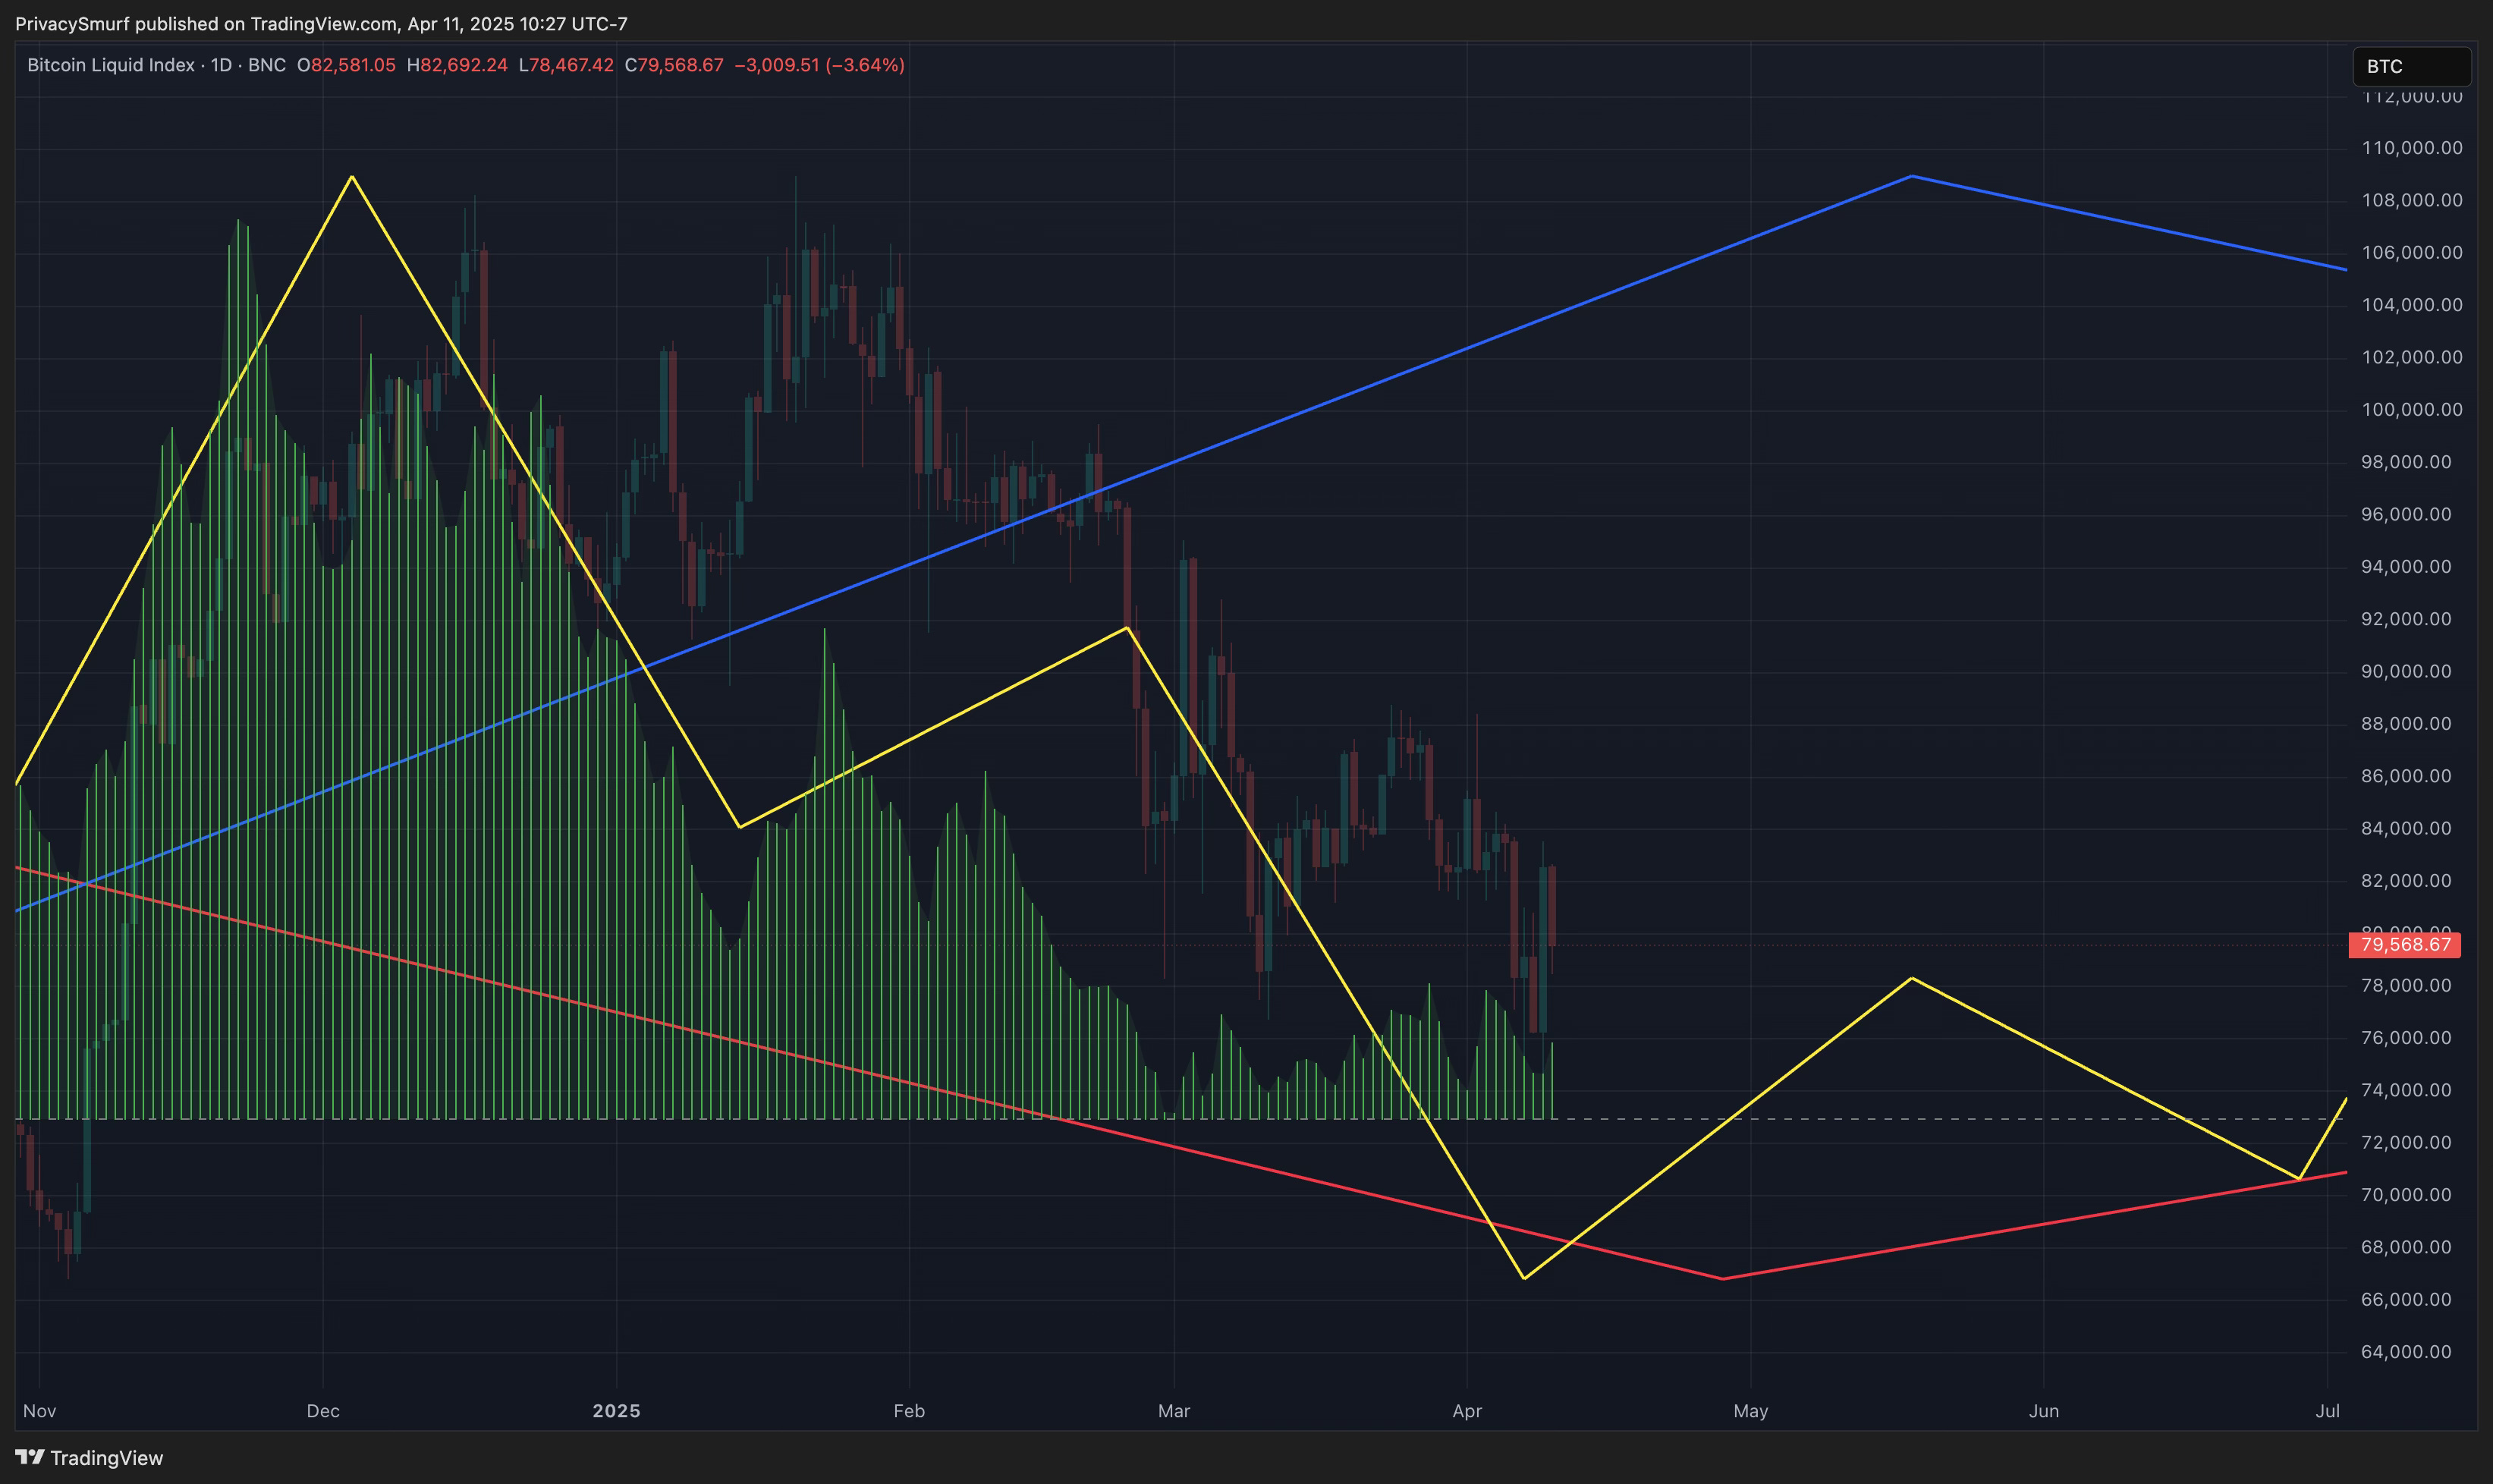
What’s on the Chart:
There are mixed alignments across timeframes.
The monthly (red) pattern indicates a potential bottom forming near the end of April.
The weekly (blue) pattern is expected to peak around mid-May.
The daily (yellow) pattern demonstrates a current bottoming pattern, projecting a peak in mid-to-late May followed by a higher low at the end of June.
I would estimate a 56% likelihood that the price action will align with the daily (yellow) turning points.
What This Means for Traders:
This analysis indicates that Bitcoin (BTC) transactions will likely show an overall increase in profitability over this quarter, hinting that the short-term lowest point for BTC may already be behind us.
Synthesis with the Earlier Sections:
The insights derived from this on-chain metric support the analysis presented across all other charts. Specifically, the data suggests base-building for BTC prices during the early part of the quarter, with a decline expected towards the end. Since BTC makes up most of the crypto market cap, this analysis will also be carried over to TOTAL charts.
Additionally, speculating on the monthly pattern, the observed bottoming could suggest that we are on the brink of a potential blow-off top. If this scenario plays out, it might mean that the SOPR lows from earlier this year could remain out of reach moving forward.
However, it’s essential to acknowledge that while this scenario is intriguing, it feels unlikely. The longer-term patterns detected might be too weak to be accurate. That said, it’s still not an impossible scenario.
ALTCOINS/BTC
https://www.tradingview.com/chart/I3c2arZQ/
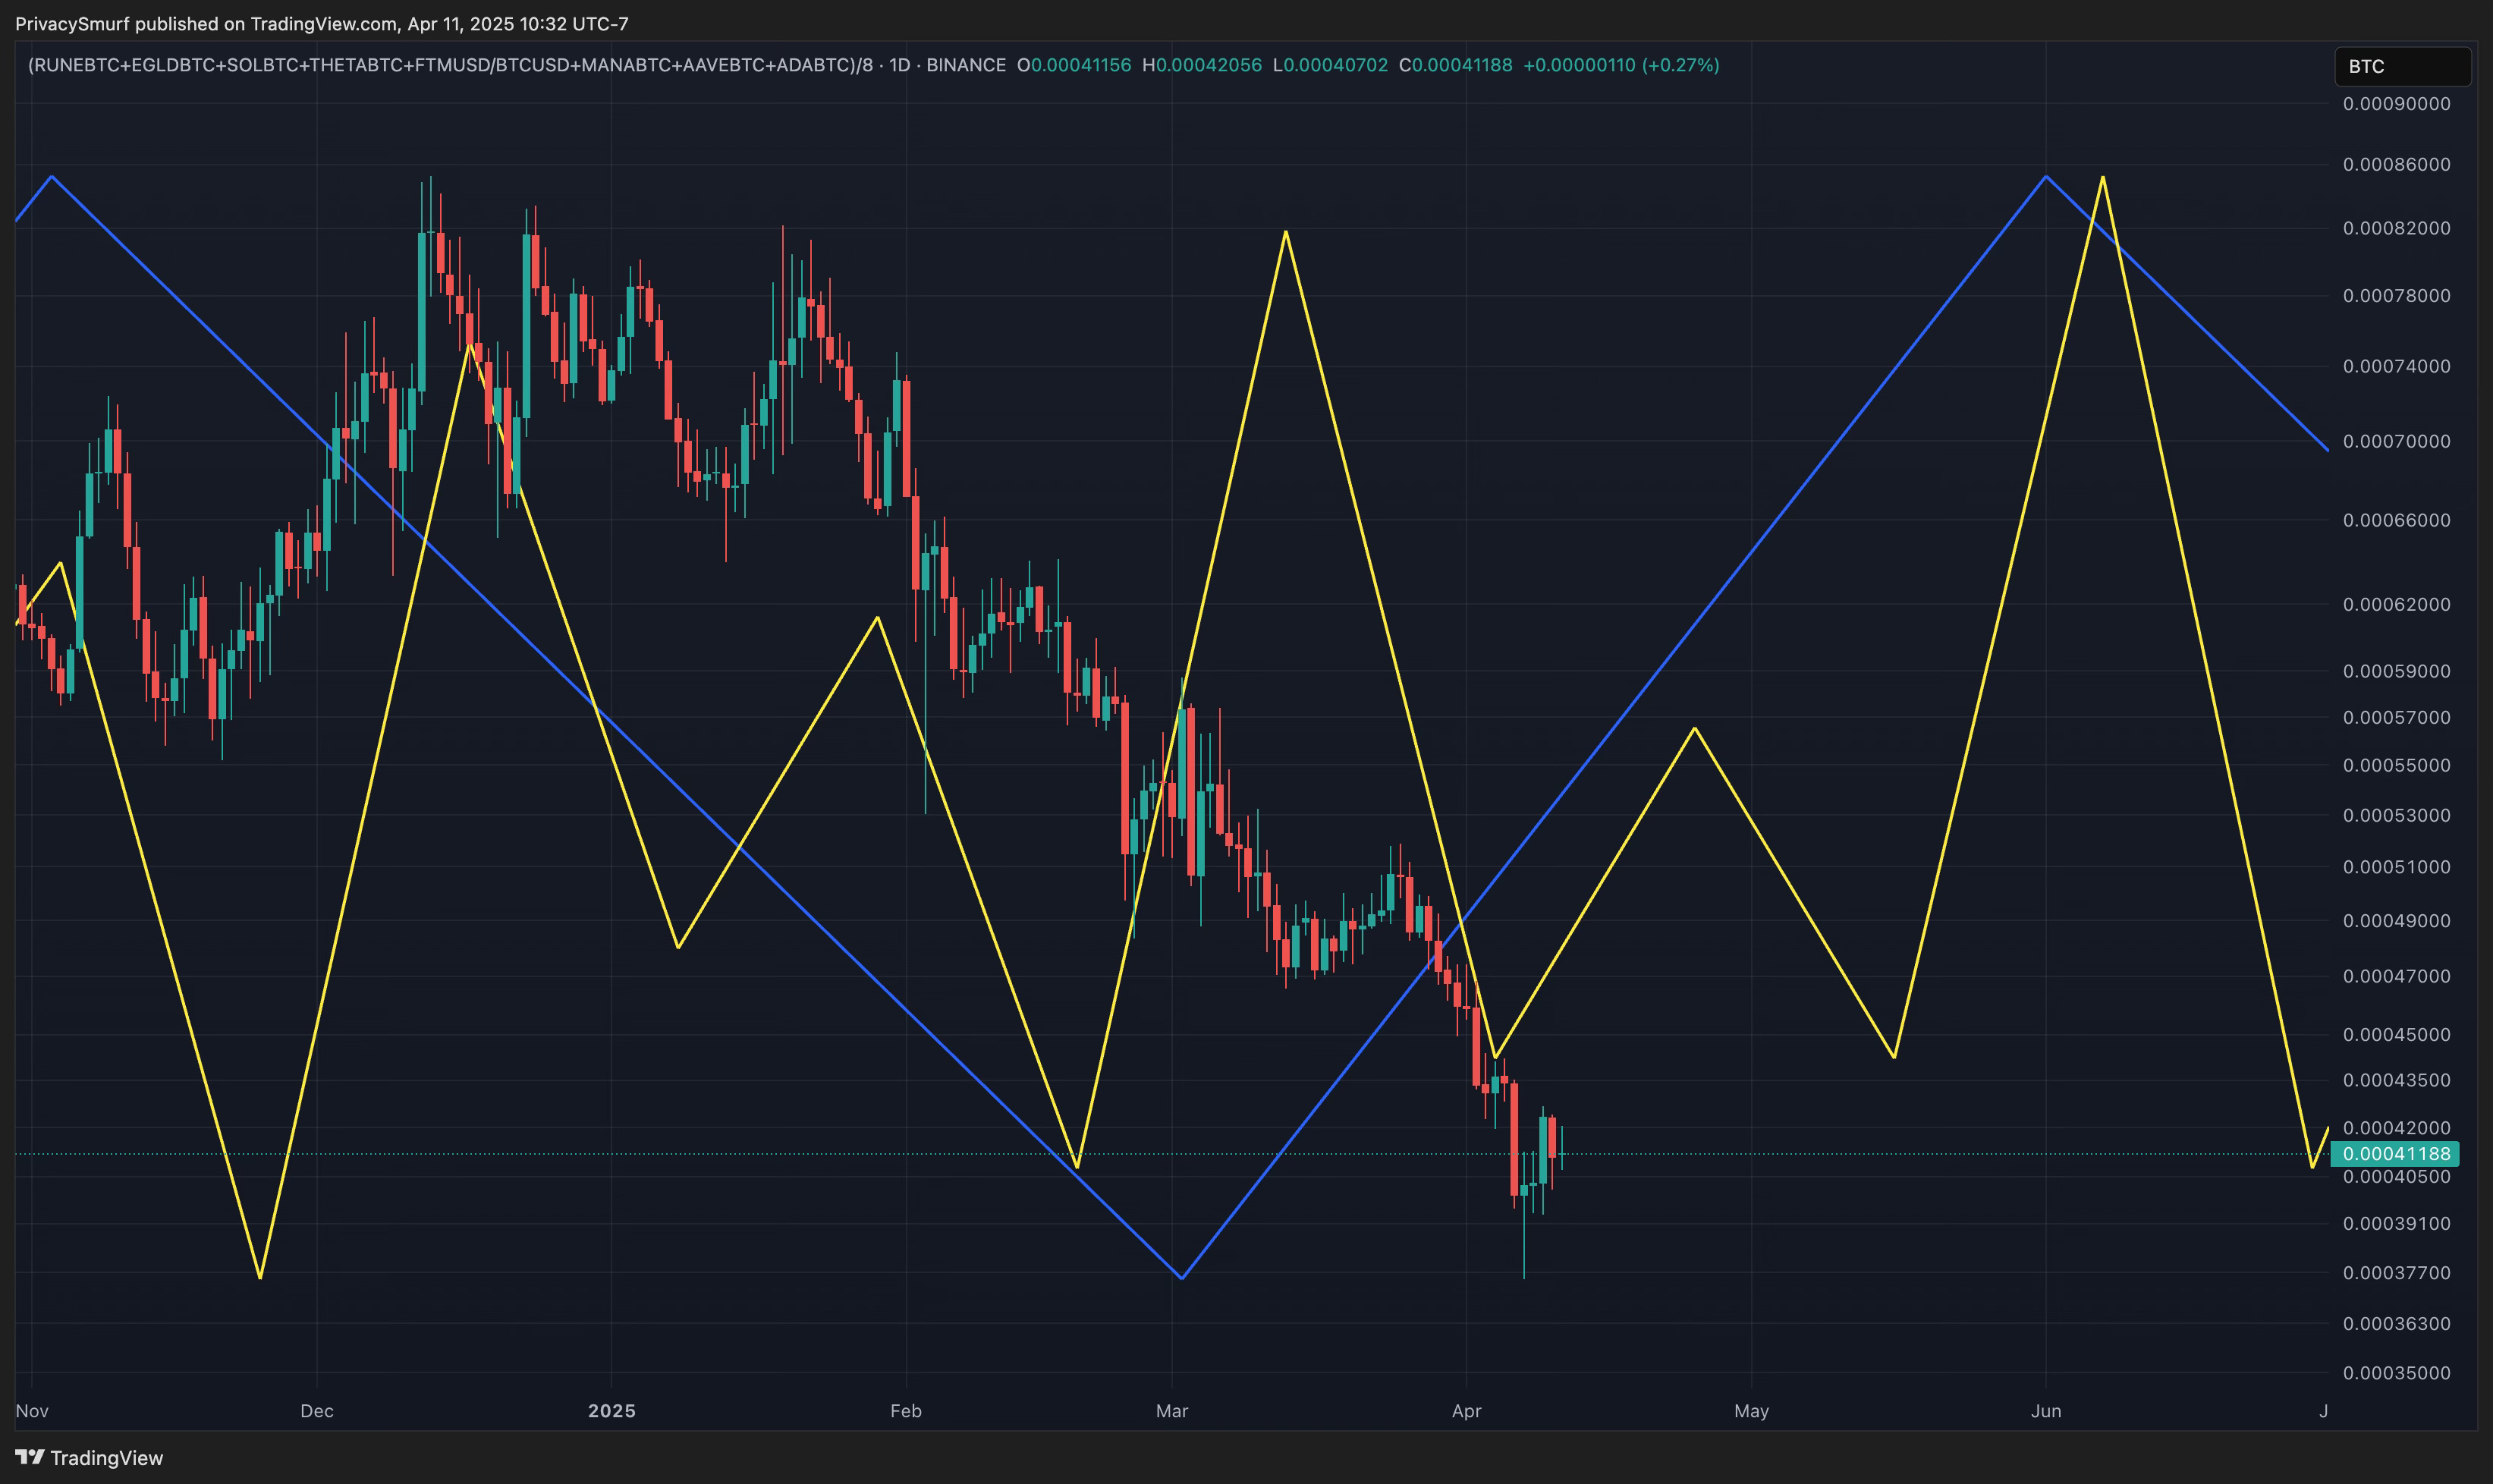
What’s on the Chart:
Since the data is too young, there are no monthly patterns yet.
The weekly (blue) pattern is expected to peak around late May.
The daily pattern (yellow) reveals some fluctuation with no consistent underlying trend throughout the quarter but peaks very near the weekly (blue) pattern.
I would estimate a 52% likelihood that the price action will align with the daily (yellow) turning points.
What This Means for Traders:
ALTs may see a brief rally in late April, being carried along with BTC. Also, there is an even chance of a higher low with BTC in mid to late May before a final rally for the quarter. To identify potential buying signals, watch for:
Breakout Alert: A breakout on an ALT chart above resistance sometime before April 20th. Below are examples of breakouts I’d entertain.
Red Arrows are resistances.
Green Arrows are supports.
The Blue Squiggly Lines are the price shape I’d want to see.
Yellow Arrows show higher price lows over time.
Blue Arrows are the price breakouts to buy.

Higher Low Formation: A formation of a higher low on an ALT chart above early April lows around mid-May. This formation would align with the more favorable “GOOD” or “OKAY” scenarios illustrated above.

Synthesis with the Earlier Sections:
This analysis aligns with familiar patterns of market rotations emerging from a bottoming phase. The adage “a rising tide lifts all ships” comes into play here. If BTC is bottoming and beginning a relief rally early, ALTs are expected to follow, albeit slightly lagging.
However, it is essential to note the increased risk associated with ALT trades, as BTC represents a significant portion of market capitalization. The anticipated downturn across all charts in May could disproportionately impact ALTs. Thus, focusing on the charts labeled with “IDEAL” can help minimize risk exposure, as these patterns indicate heightened interest from traders.
Zenalytics Stress Composite
This index measures overall financial conditions by aggregating various financial metrics.
Decreasing Values: A decline in the index typically indicates easing financial conditions, suggesting lower risk perceptions and encouraging investment in risk assets like stocks and cryptocurrencies.
Increasing Values: Conversely, rising values signal increased financial stress, often leading investors to retreat from risk assets in favor of safer investments. This reflects tighter market conditions and elevated volatility.
https://www.tradingview.com/chart/4NPvszYo/
What’s on the Chart:
Since the data is too young, there are no monthly patterns yet.
The weekly (blue) pattern is expected to peak around late April.
The daily pattern (yellow) reveals some fluctuation with no consistent underlying trend throughout the quarter but shows a peak very near the weekly (blue) pattern.
I would estimate a 57% likelihood that the price action will align with the daily (yellow) turning points.
There is significant noise in this dataset. The regular daily (yellow) pattern on the left side of the chart transitions to chaotic, shorter fluctuations. This may reflect the uncertainty stemming from various factors, such as global trade dynamics, inflation concerns, geopolitical tensions, and shifting U.S. monetary policies.
What This Means for Traders:
Unfortunately, uncertainty is the new normal, but there are periods in the latter half of the quarter where decreasing financial stress may provide opportunities for traders.
Synthesis with the Earlier Sections:
This macro stress indicator primarily reflects the availability of spendable capital, market sentiments, and broader financial conditions rather than directly targeting the crypto market moves. Generally, the downward phases in this chart suggest that market participants may allocate more funds to riskier assets, including cryptocurrencies. These downward phases align loosely with projected bullish periods in the crypto market, as highlighted in previous sections.
30Y Treasury Bonds
I’m still uncertain about the continued relevance of this study. While the 30-year Treasury Bonds have maintained their forecasting accuracy, they are not providing an accurate substitute signal when Bitcoin (BTC) lacks one. Also, over time, it’s becoming less correlated. Numerous macroeconomic factors may be influencing this asset, making it increasingly challenging to detect reliable signals and diminishing its role as a proxy for crypto market behavior.
https://www.tradingview.com/chart/X6afdZsr/
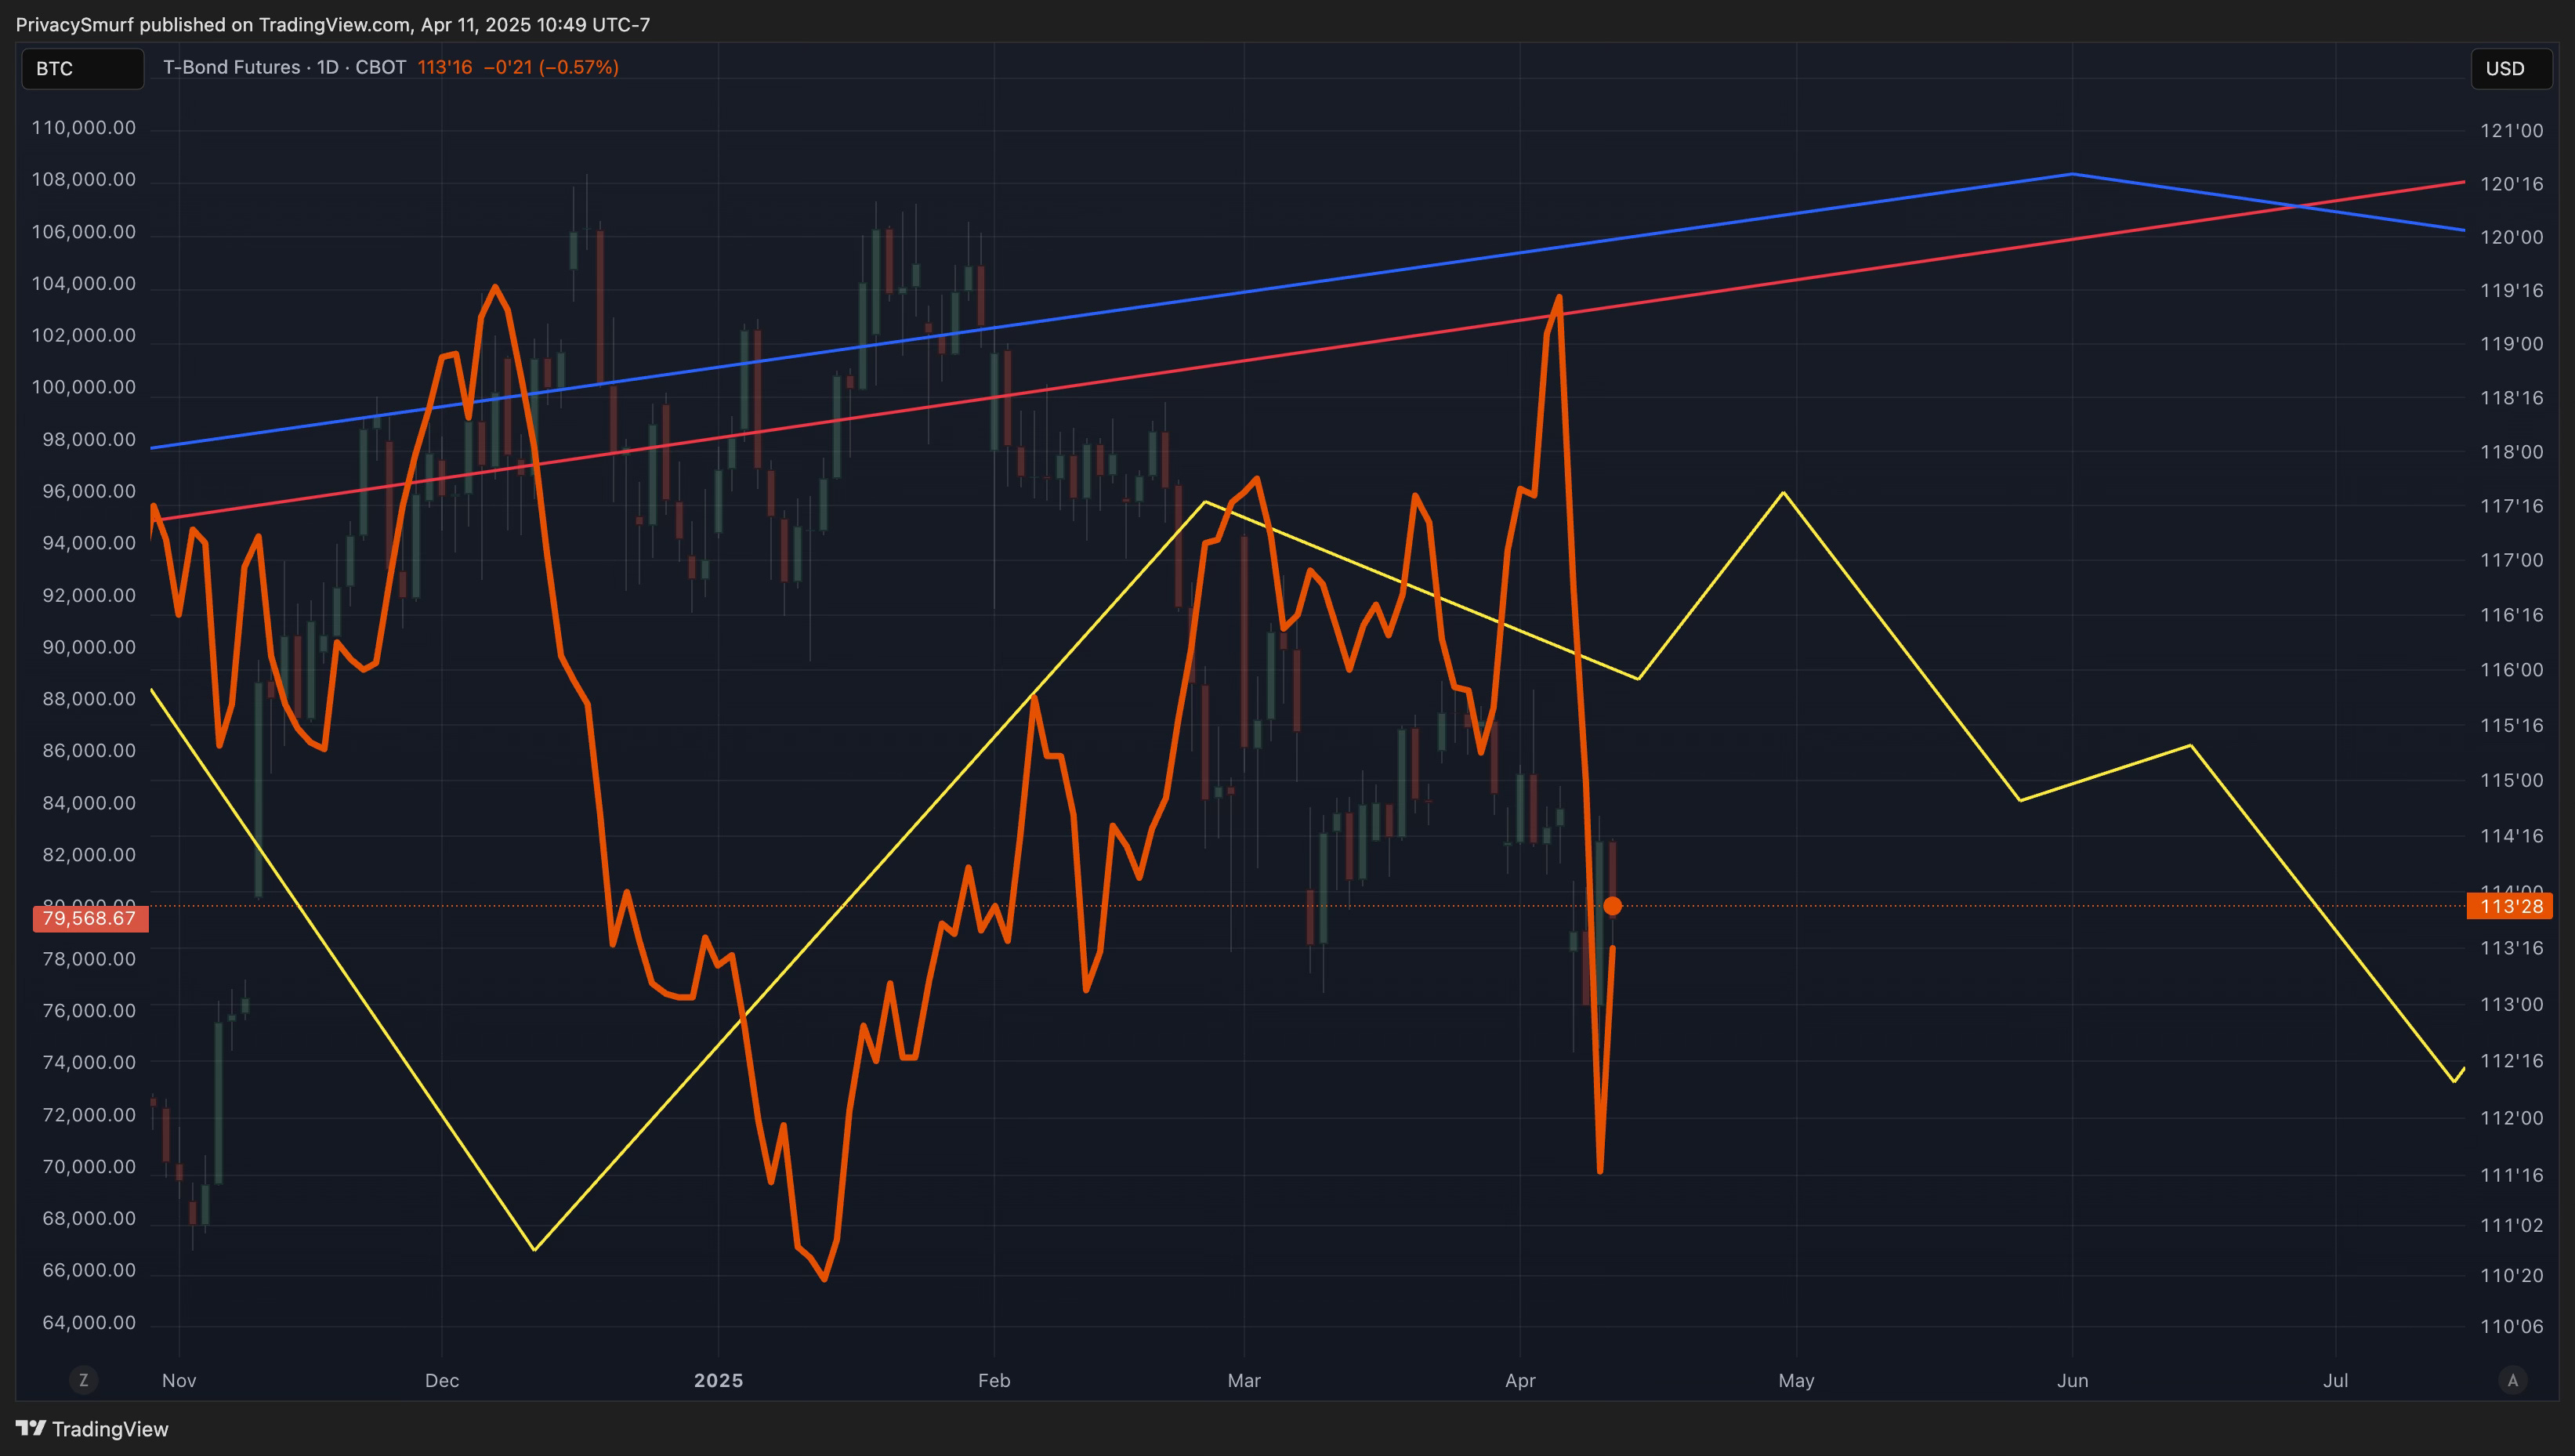
What’s on the Chart:
The monthly (red) and weekly (blue) patterns are aligned with bullish behavior through May. Then, the weekly (blue) patterns peak and turn down through the remainder of the quarter.
The daily pattern (yellow) showcases a typical downtrend characterized by lower highs and lower lows starting at an early May peak.
I would estimate a 69% likelihood that the price action will align with the daily (yellow) turning points.
What This Means for Traders:
Bond prices are likely to rise through April, followed by a decline throughout the remainder of the quarter
Synthesis with the Earlier Sections:
Historically, the bond and crypto markets have exhibited similar trends; however, recent macro events have led to an inverse correlation between bond prices and BTC price action. If this trend continues, it would support the analysis presented in previous sections. As bond prices are projected to decline in May, these downward phases may loosely align with anticipated bullish periods in the crypto market.
Beyond the Quarter:
As mentioned in my earlier analysis linked below, the insights shared continue to hold true. To date, there has been no invalidation of my thesis that the topping phase of the 2023-2025 bull market is currently underway. It’s very possible we are in our final rally before the bear market.
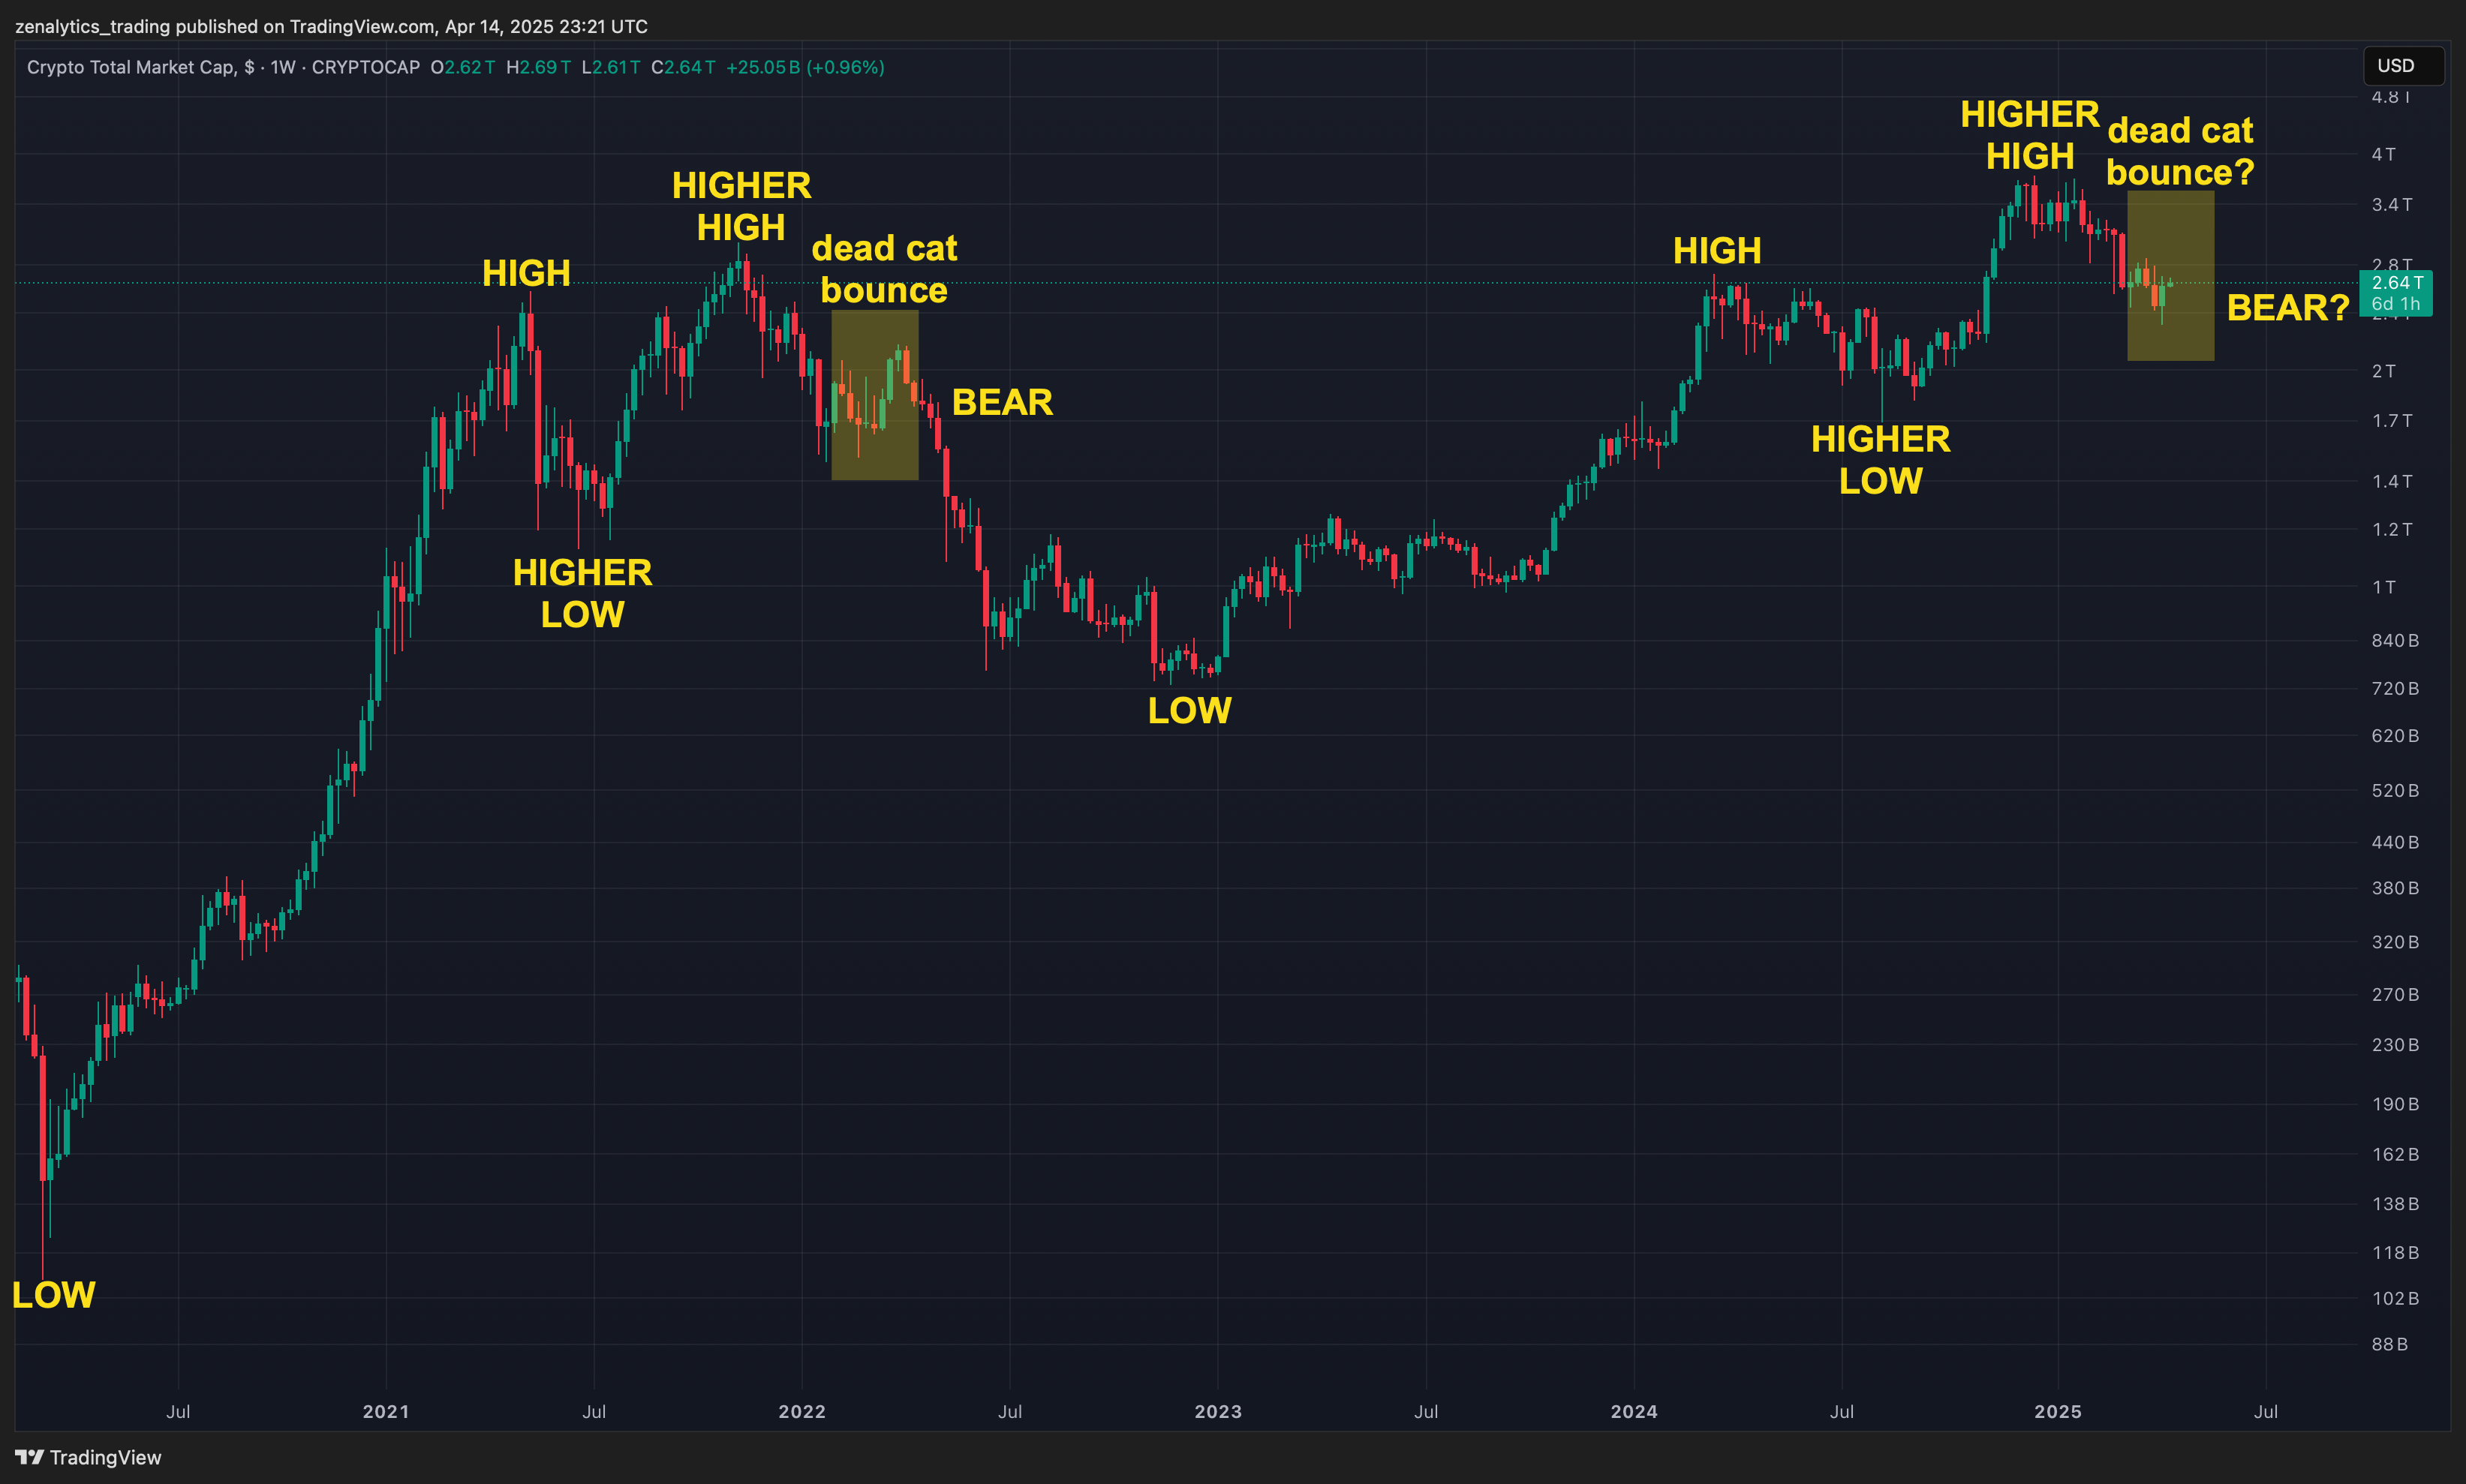
I’m working on an updated piece on this thesis, but you can read the older analysis below. They are still very relevant.


Bonus S&P 500 Chart
https://www.tradingview.com/chart/OspZ8C71/
Please check out this post if you haven’t done so before. It’s got all the relevant information you need to ensure you get all the posts from me that you want. The default setting for my newsletter is NOT to spam you with everything I put out.

Thanks for your time!
@ThePrivacySmurf
Another killer quarterly review 👏 Always appreciate the insights. Now… any chance you feel like blessing us mortals with an “IDEAL” alt coin chart? Asking for a friend 😇