


#139: Bull Market's Last Gasp?
I have a tendency to wear my mind on my sleeve.

In a perfect world, we’ve got “one week” then things look bad.
📌 TL;DR / Smurf’s Summary
Bitcoin's bullish momentum has decreased despite reaching a new ATH, suggesting the bull run may be losing steam. The daily structure remains bullish. A potential ALT rotation may be brewing. The market is at a critical juncture with historical patterns and we either follow past patterns or blaze a new trail after this week.
🚦 Trader Traffic Light
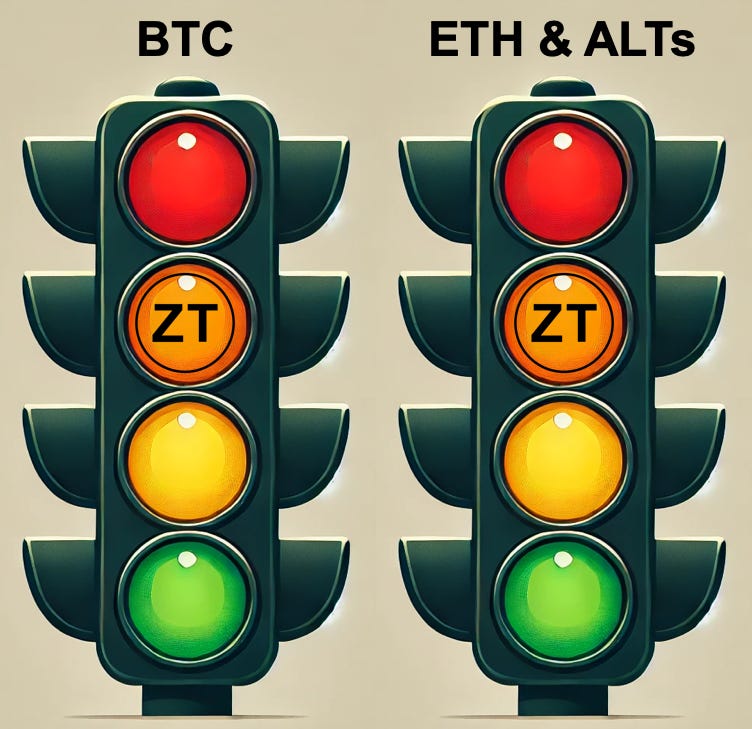
BTC Trades: 🟠
Amber Light. Bullish momentum has decreased from last week despite a new All-Time High (ATH), the bullish gas tank is emptying. Was able to eek out 2R on a smaller leveraged position. I’d consider another trade on a breakout of $112K.
ETH & ALTs Trades: 🟠
Amber Light. I’m still not looking for dip buys. We may be on the brink of another ALT rotation. I’m only focusing on “ideal” setups and not chasing plays. I’m still keeping a close eye on the altcoin market cap here. Ideally, these setups are coming into play when the the BTC and Stables lines are going down.
🔍 Where Are We Now?
Market Structure: Bullish daily structure, short-term bearish momentum.
Retail Sentiment: Highly Bullish, on decline from Extreme Greed.
Current Positioning:
BTC spot long at $78K, mostly scaled out with 33% remaining on trailing stop (trimmed profit: 1st @ $91.5K, 2nd @ $95.8K, 3rd @ $103.5K). Trailing stop active on leveraged BTC breakout trade from $105K.
Lingering remaining ALTopen positions on trailing stops. Evaluating ALT breakout trades with tight stops, but only ideal setup.
What are the Technicals?
Definitions you may not know:
Weekly Closing Range: Created with Bayesian statistics and linear regression. More on that here.
RSI (Relative Strength Index): Momentum indicator showing speed and power of price action.
Divergence: When price action is going one way but momentum is going the other, suggesting the current price trend might be losing power.
📈 Technical Deep Dive (BTC)

Price Action: Bullish Bias, yet stalling.
Support at $103.7K; Resistance around ATH @ $112K.
Weekly Closing Range is forecasted at $108.2 - $115K by Sunday.
Correctly projected 16 out of 30 (53.3% efficiency)
Indicators & Oscillators:
RSI: Suggesting a bullish momentum peak and/or price consolidation range formation because measurements are:
Currently above midline - momentum is generally bullish, it’s easier to go up than down.
Closed below adaptive top band - bullish impulsive action has ceased with a momentum breakout ceiling at $112K.
Divergence Signals: Updated bearish divergence trades have targets around $103.7K and $98.1K. The initial target has confluence with the current closest support level. This may present as a swing low buy opportunity but monitoring momentum will be critical in the moment as market cycle timing would suggest the potential upside is limited and we are going to be working against underlying bearish forces.
📉 Technical Deep Dive (ETH & ALTs)
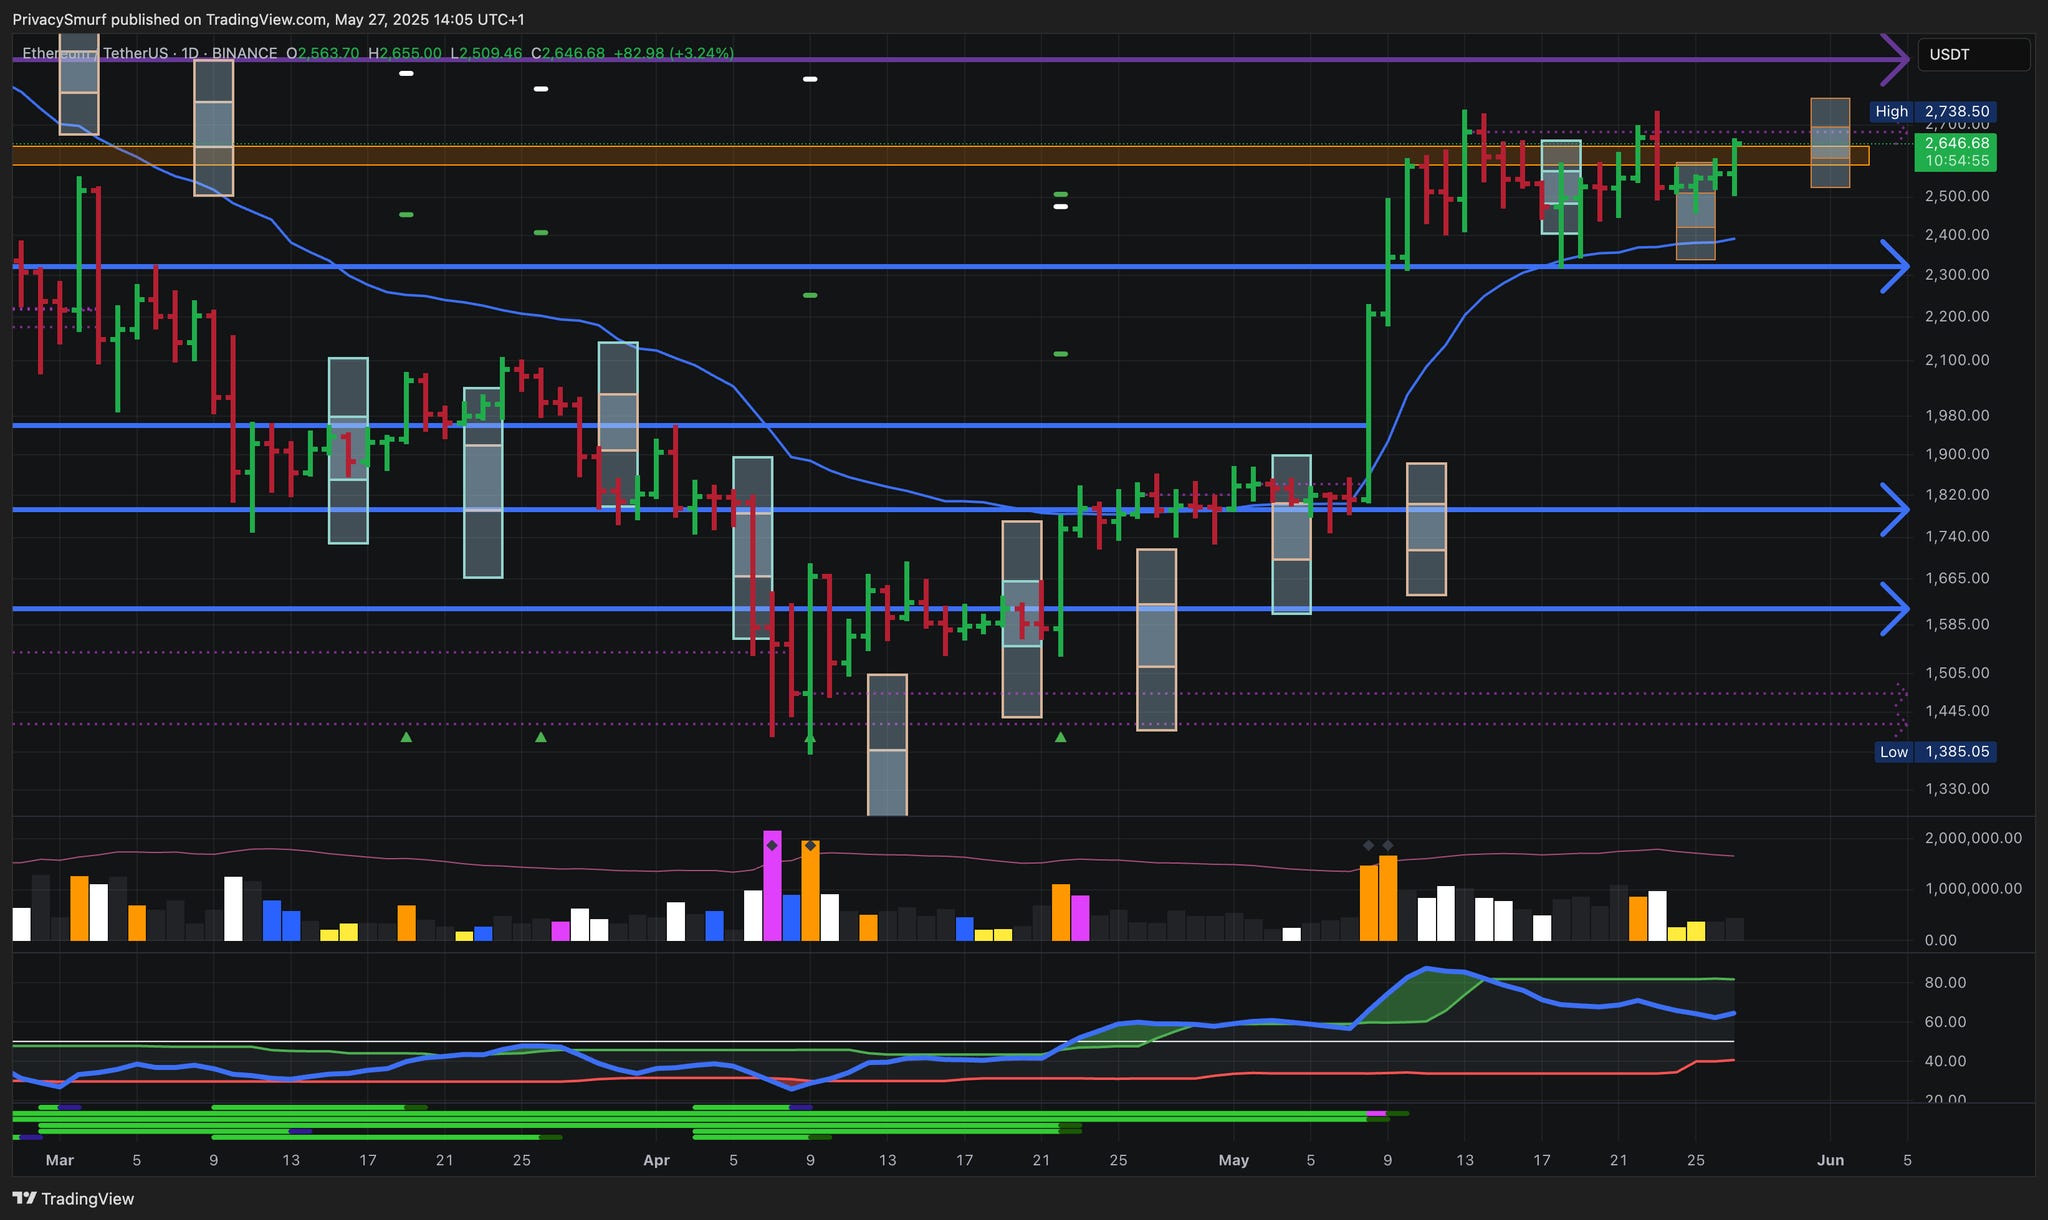
Price Action (ETH): Bullish Bias, yet stalling.
Support at $2320. Resistance zone currently holding at $2585 - $2640 and higher resistance at $2895.
Weekly Closing Range is forecasted at $2525 - $2780 by Sunday.
Correctly projected 14 out of 26 (53.8% efficiency)
Indicators & Oscillators (ETH):
RSI: Suggesting a bullish momentum peak and/or price consolidation range formation because measurements are:
Currently above midline - momentum is generally bullish, it’s easier to go up than down.
Closed below adaptive top band - bullish impulsive action has ceased with a momentum breakout ceiling at $2680.
Divergence Signals: The secondary bullish divergence trade target remains around $2800. The RSI at the time of writing is still declining but price is testing a breakout above the momentum ceiling. This may lead to an unsustained breakout, but with enough impulsiveness to hit that secondary target.
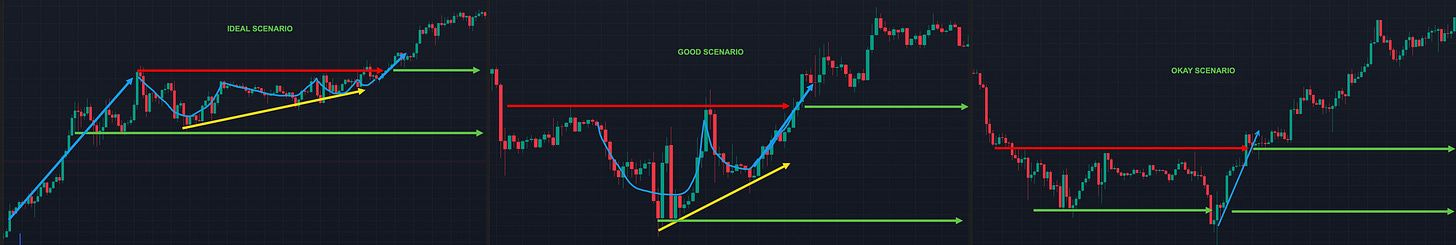
ALTs: The pending Altcoin (ALT) rotation as evidenced in my supplemental post here suggests we should keep our eyes open for bullish plays. The opportunities are still risky as momentum metrics do not support the idea of sustained bullishness and only short term rotations. The focus for breakouts remains on ALTs that have been up trending and are at critical resistance levels. Wait for breakouts that allow for tight stop losses. I’m only considering the “IDEAL” scenarios below given the current market conditions.
🧭 What’s the Plan?
**🧭 Trading Plan & Scenarios**

*   **Bullish - BTC Breakout Continuation:**
    *   Condition: Close > ATH
    *   Action: Eval. new leveraged longs. TP @ 1R to 4R from Stop Loss
*   **Caution - BTC Consolidation:**
    *   Condition: $103K < Daily Closes < $113K & RSI inside bands
    *   Action: Consider short-term range trading, buy support & sell resistnace
*   **Bearish - BTC Bullish Invalidation:**
    *   Condition: Close < $92K
    *   Action: Close short-term spot BTC position
*   **New ALT Rotation:**
    *   Condition: BTC $$ flat or down, BTC.D & Stables cap down, ALT Driver up      *   Action: Evaluate ALT breakouts

---

**📌 Spot Risk Management**

*   **Stop-Losses:**
    *   BTC: Daily close < $90K
    *   ALTs: Placement under clear pivot point ideally < 12% below entry
*   **Position Sizing:**
    *   BTC: Small to moderate entries
    *   ALTs: Small to moderate entries
🔮 My Long-Term Market Reflection

Macro Cycle Status:
Bull market still intact but in a phase that in the past lead to bear market confirmation unless we have daily closes above the all-time high, then things get tricky and not so clear-cut. Interestingly we’ve set a new BTC high close, though that’s also where we fell from last cycle.
Historical Comparison:
Similar patterns to the prior bull market suggest caution; historically, failure to breach all-time highs before turning back down signaled bear market onset.

Personal Expectations:
As time progresses without setting new highs, we continue to shape the market similarly to the last bull market.
In a perfect mirroring scenario, we would have already hit the lowest low (✅) and initiated a rally (✅), only to establish a macro lower high this week (!!!) before transitioning into a bear market. This timeline matches very well with the current peaking window for the daily chart, according to the quarterly forecast. Read that here if you haven’t yet.
https://zenalyticstrading.substack.com/p/quarterly-market-synthesis-q2-2025
We are have passed through the topping timing window for BTC which spans from May 18 - May 23. In a perfect world the next bottoming timing window from June 11 - June 16 will have closes under the highest close at $111.7K from our topping window.

While BTC did hit a new ATH last week and I’m speculating on an ALT rotation There is still a lot of confluence suggesting that the short term will more than likely not experience impulsive growth that extends into a new bull trend. We are only a sharp drop away from confirming a big picture lower high for this bull market.
Historically BTC doesn’t come back from it before the bear. The new BTC ATH complicates the easy top picture, but doesn’t invalidate it. If the total marketcap chart can be brought up to new highs with this potential new rotation the arguments for a top get harder to make as momentum will be making a comeback.
🎯 Key Takeaways
BTC: Consider new leveraged longs only on close above ATH ($112K); exit positions on
daily close < $92KALTs: Avoid dip-buying; focus only on ideal breakout setups with tight stops (< 12% risk)
Range Trading: Consider short-term range trading between $103K-$113K
@ThePrivacySmurf