


#140: 'Some will die in hot pursuit' of the bull
Lyrics are fun sometimes.

To me, it looks like everyone “is drinking from a fountain that is pouring like an avalanche that’s coming down a mountain…”
I do mind the sun sometimes.. It’s so hot right now in Taiwan. Sweating like crazy. Here’s Fort Zeelandia in Tainan.
📌 TL;DR / Smurf’s Summary
Bitcoin is defining a consolidation range under the all-time high (ATH) of $112K within a bullish daily structure, but with short-term bearish momentum. ETH and ALTs are at risk of underperforming or experiencing a decline during this period. The market has shifted towards confirming future bearishness. Bulls need to step in.
🚦 Trader Traffic Light
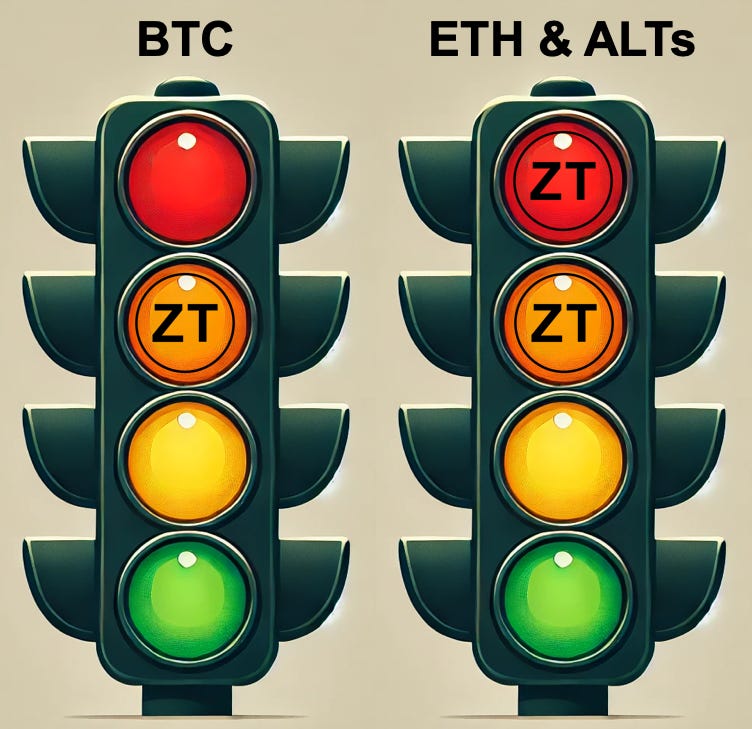
BTC Trades: 🟠
Amber Light. Initial bearish targets have been hit and we sit at a confluence of supports. I’d consider a range trade from here to the ATH with tight stops under the recent low. Ideally the RSI validates floor formation. Risk is medium to high here but reward is greater.
ETH & ALTs Trades: 🟠 → 🔴
Amber to Red Light. I’m not looking for any plays atm. It’s possible a few “ideal” setupsexist but I’m on pause for the moment while prices stabilize. I’m still keeping a close eye on the altcoin market cap here. I will start looking for trades when the ETH and ALT lines breakout from a resistance.
🔍 Where Are We Now?
Market Structure: Bullish daily structure, short-term bearish momentum.
Retail Sentiment: Highly Bullish, on decline from Extreme Greed.
Current Positioning:
BTC spot long at $78K, mostly scaled out with 33% remaining on trailing stop (trimmed profit: 1st @ $91.5K, 2nd @ $95.8K, 3rd @ $103.5K). Trailing stop triggered on leveraged BTC $105K breakout trade.
Only a few ALT open positions left on trailing stops. Not considering new trades at the moment.
What are the Technicals?
Definitions you may not know:
Weekly Closing Range: Created with Bayesian statistics and linear regression. More on that here.
RSI (Relative Strength Index): Momentum indicator showing speed and power of price action.
Divergence: When price action is going one way but momentum is going the other, suggesting the current price trend might be losing power.
📈 Technical Deep Dive (BTC)
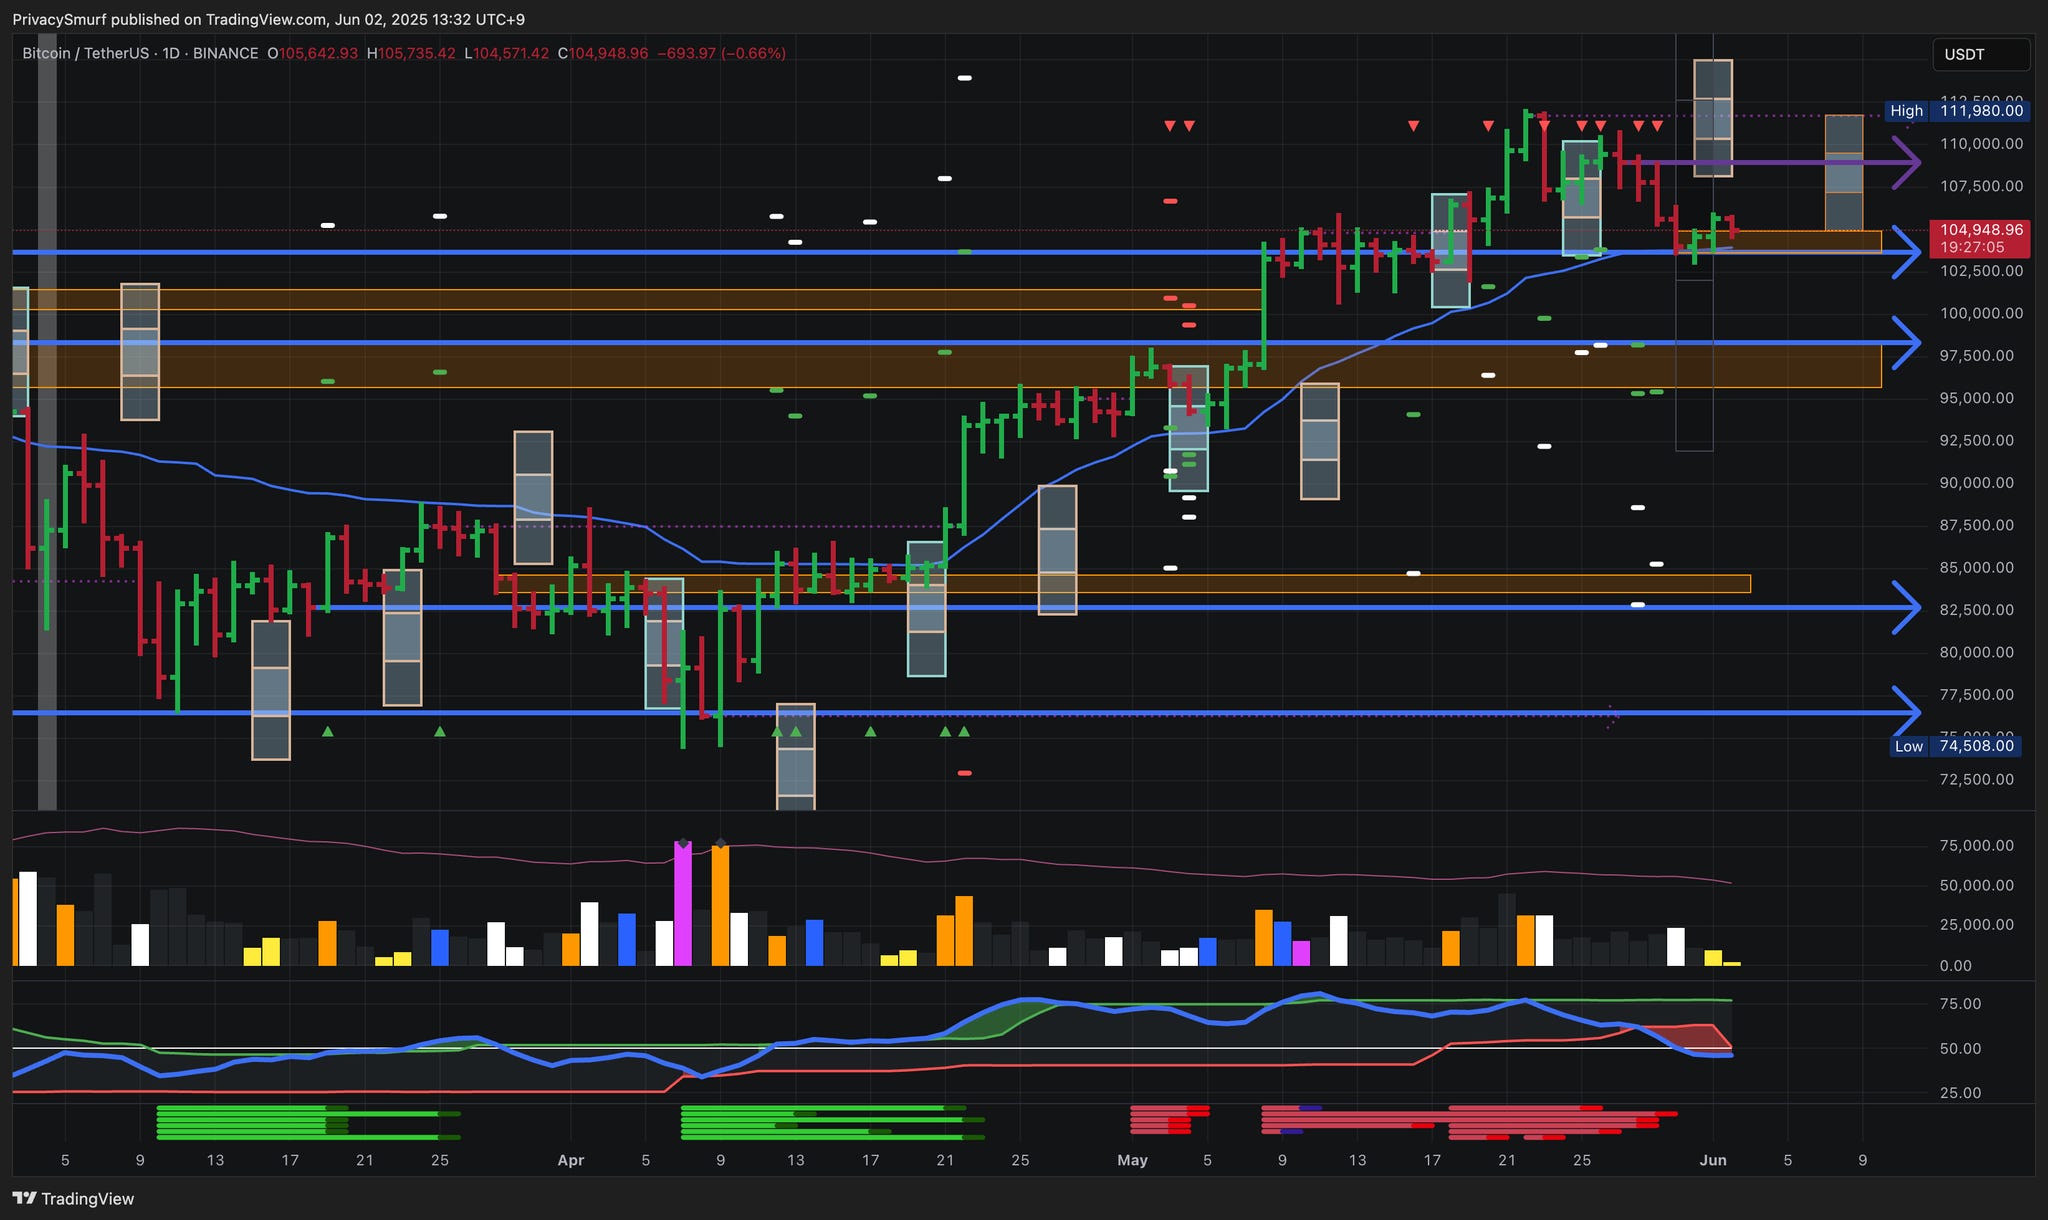
Price Action: Bullish Bias, finding consolidation range.
Support at $103.7K and $98.3K; Resistance around $108.9K and ATH @ $112K.
Weekly Closing Range is forecasted at $105K - $111.8K by Sunday.
Correctly projected 16 out of 31 (51.6%)
Monthly Closing Range is forecasted at $66.8K - $99.4K by Sunday.
Correctly projected 1 out of 1 (100%)
On a side note, I’ve completed a backtest of this methodology for around the past 120 weeks. Out of 400,000 simulations the average accuracy was around 47%. At the moment, I’m outperforming the baseline, but this is slightly problematic. At some point my performance will likely skew down towards the average. This leads me to the realization that the assumptions I’m making to define these ranges are in need of some fundamental changes to improve accuracy. I want my baseline assumptions produce results greater than 50% or else this process is worse than me just picking some random prices out of thin air. Basically, I’m just getting lucky right now with this. I do think this process has merit but not with my original calculations. In the interim, I will still provide these ranges while I make adjustments, but in the interest of full transparency, it’s important for you to know the percentages to inform your opinions on my analysis.
Indicators & Oscillators:
RSI: Suggesting continued impulsive bearish price action because measurements are:
Currently below midline - momentum is generally bearish, it’s easier for price to go down than up
Currently below adaptive top band - price action is on a momentum breakdown to define a new floor.
Closing above the adaptive bottom band would mean bearish impulsive price action has ceased and a new floor may be established around the lowest close ~$104K.
Divergence Signals: The initial bearish divergence trade target at $103.7K has been hit. A secondary target remains at $98.1K although price is sitting at a confluence of supports just under that initial target. This presents as a swing low buy opportunity. Risk is higher on a buy right now. A more cautions approach would be to wait for the RSI to close back inside the bands that may come at a higher price. There is no guarantee on the secondary target hitting. It still exists as a higher possibility, in my opinion, until the RSI is back inside the bands. At that point, the lower target loses favor and a resistance or ATH test becomes the higher probability. The secondary target also would present as a low buy opportunity but would be less appealing to me as the market structure would be in much worse shape and be nearing bearish confirmation.
📉 Technical Deep Dive (ETH & ALTs)

Price Action (ETH): Bullish Bias, yet stalling.
Support at $2320. Resistance zone currently holding at $2585 - $2640 and higher resistance at $2895.
Weekly Closing Range is forecasted at $2470 - $2715 by Sunday.
Correctly projected 15 out of 27 (55.6% efficiency)
Indicators & Oscillators (ETH):
RSI: Suggesting a bullish momentum peak and/or price consolidation range formation because measurements are:
Currently above midline - momentum is generally bullish, it’s easier to go up than down.
Closed below adaptive top band - bullish impulsive action has ceased. The momentum breakout ceiling at $2680 has been invalidated but I still will keep that in mind as price trades up to that level as there has been a failed breakout from that price.
Divergence Signals: Below was my commentary from last week.
The secondary bullish divergence trade target remains around $2800. The RSI at the time of writing is still declining but price is testing a breakout above the momentum ceiling. This may lead to an unsustained breakout, but with enough impulsiveness to hit that secondary target.
There was an unsustained breakout and price failed to hit the target by around $17 (0.61%). The secondary bullish target is technically invalidated now as there are new bearish signals with targets at around $2300 and $2065. It is not a great sign for the market that now ETH is following suit with BTC.
ALTs: The Altcoin (ALT) rotation as evidenced in my supplemental post here is over for now. Any breakouts now are likely market outliers. They are viable plays but carry a greater risk. I’m not interested in buying dips since the market appears to be losing it’s bullish momentum. I will wait for some stabilizing prices before entertaining buys. I’ll leave this image of which ones to focus on up for now but I imagine there are very few of them out there that still look like this. The ALT market is down or consolidating right now. Caution is warranted.
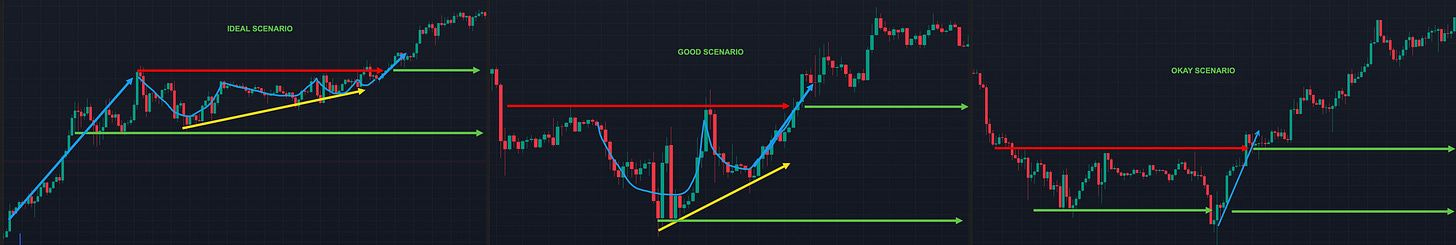
🧭 What’s the Plan?
**🧭 Trading Plan & Scenarios**

*   **Bullish - BTC Swing Low to Breakout Continuation:**
    *   Condition: Closes above $103K -> Close > ATH
    *   Action: Leveraged long $103-$104K, partial TP ~ATH, Stop Loss under $102K
*   **Caution - BTC Consolidation:**
    *   Condition: $103K < Daily Closes < $113K
    *   Action: Consider short-term range trading, buy support & sell resistnace
*   **Bearish - BTC Bullish Invalidation:**
    *   Condition: Close < $92K
    *   Action: Close short-term spot BTC position
*   **Next ALT Rotation - (not this week?)**
    *   Condition: BTC $$ flat/down, BTC.D & Stable cap down, Mrkt Driver down     *   Action: Evaluate ALT breakouts
---

**📌 Spot Risk Management**

*   **Stop-Losses:**
    *   BTC: Daily close < $90K
    *   ALTs: Placement under clear pivot point ideally < 12% below entry
*   **Position Sizing:**
    *   BTC: Small to moderate entries
    *   ALTs: Small entries
🔮 My Long-Term Market Reflection

Macro Cycle Status:
Bull market still intact but in a phase that in the past lead to bear market confirmation unless we have daily closes above the all-time high, then things get tricky and not so clear-cut. Interestingly we’ve set a new BTC high close, though that’s also where we fell from last cycle.
Historical Comparison:
Similar patterns to the prior bull market suggest caution; historically, failure to breach all-time highs before turning back down signaled bear market onset.

Personal Expectations:
As time progresses without setting new highs, we continue to shape the market similarly to the last bull market.
In a perfect mirroring scenario, we keep trending down eventually transitioning into a bear market. It’s wild to me how similar this is to the past top yet most of the content I see out there is framing the market as warming up for a fresh new bullish phase. I recognize that’s not impossible and I have a post I’m writing with all these thoughts but to be frank, little beyond hypotheticals and fundamentals are presenting as evidence for a bullish argument.
https://zenalyticstrading.substack.com/p/quarterly-market-synthesis-q2-2025
Taken from the post above, so far the latest top timing window for BTC is valid. In a perfect world the next bottom timing window from June 11 - June 16 will have closing prices under the highest close at $111.7K from our topping window and ideally be above the $102K level from the prior bottom or else the market loses it’s textbook bullish shape.
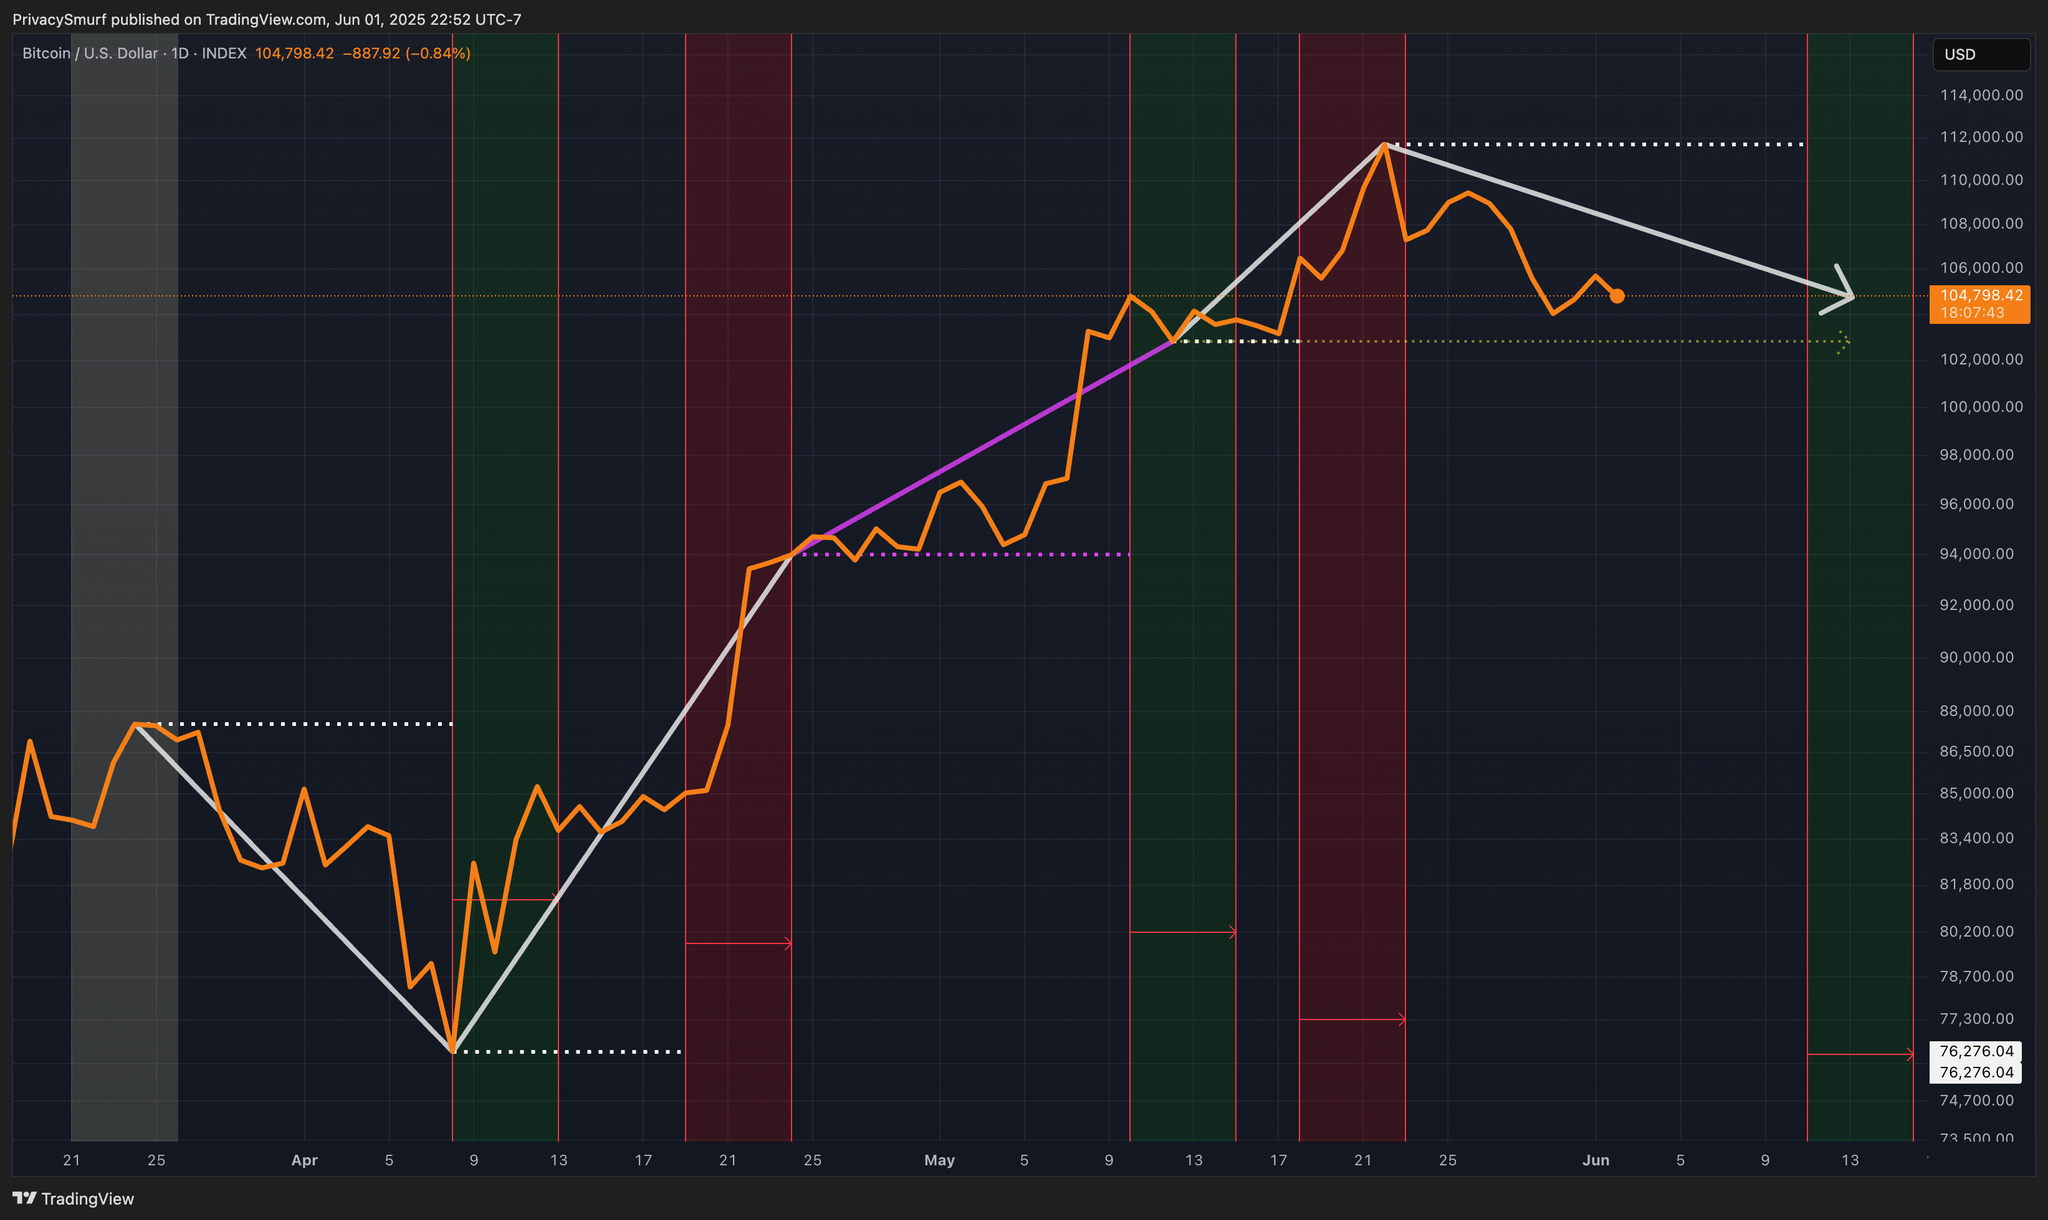
Losing the $102K to $103K level on daily closes will significantly alter what is possible in the short to medium term for the market. We are only one drop away from confirming a big picture lower high for this bull market.
Historically, BTC doesn’t come back from it before the bear. The latest BTC ATH complicates the easy top picture, but doesn’t invalidate it. The latest market rotation failed to achieve new highs for the total market cap chart. Instead, it has set a new 3-week low and a new lower close. Crypto has been on this road before. It was pretty rough for a while. There’s still time to change direction, but we are almost out of exits before we are on a one-way street to Bearsville.
🎯 Key Takeaways
BTC: Hope for the best (ATH), plan for the worst (breakdown). Buy near support levels, sell near resistance levels.
OTHERS: Stand aside until the dust settles and things are clearer.
@ThePrivacySmurf
we are on a one-way street to Bearsville. LMAO