


#141: Busted Bromance Can't Beatdown Bulls...
and it takes some ego to think the market cares what you do.

OOFT…
If you're a trader and missed this on your crypto timeline, watch this.
James Wynn thought he was something special and gave a masterclass on how not to think, act, or trade.
Sometimes you just need to step back, sit on the side of some tranquil waters, and calm the mind. Like maybe here in the Beitou District in Taipei.
📌 TL;DR / Smurf’s Summary
Despite a sharp selloff, while a Trump and Musk catfight, Bitcoin is still defining in a consolidation range under the ATH of $112K. ETH and ALTs are at risk for underperforming or falling during this period. The market has shifted towards the direction of confirming future bearishness, but bulls are putting up a fight when prices dip.
🚦 Trader Traffic Light
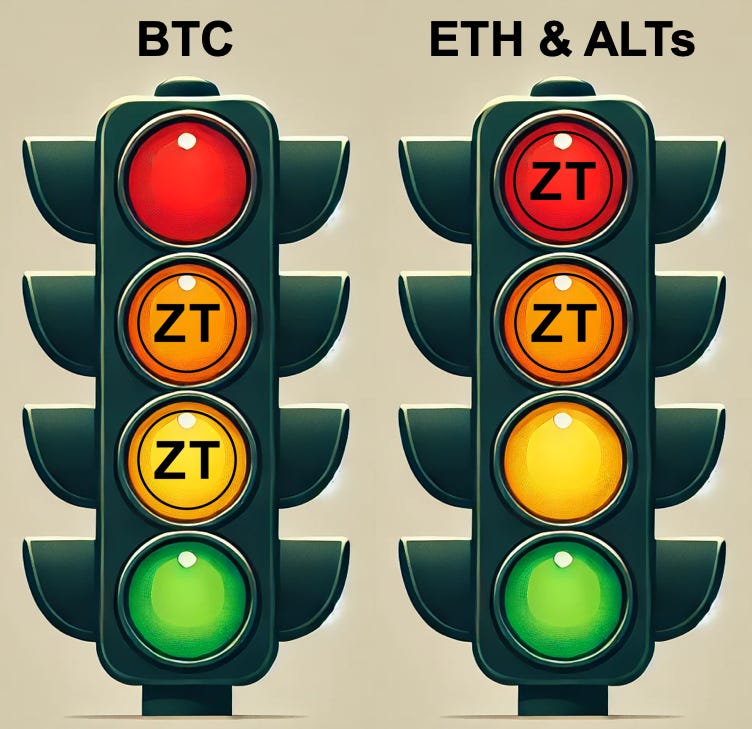
BTC Trades: 🟠 → 🟡
Amber to Yellow Light. I’d consider a range trade from recent support to the ATH with tight stops under the recent low. The risk of downside is between medium and high, but leans more towards medium.
ETH & ALTs Trades: 🔴→ 🟠
Red to Amber Light. I’m not looking for any plays at the moment. A few “ideal” setups may exist, but I’m on pause for the moment while prices stabilize. I’m still keeping a close eye on the altcoin market cap here. I will start looking for trades if BTC can manage to close over $107K.
🔍 Where Are We Now?
Market Structure: Bullish daily structure, short-term bearish momentum.
Retail Sentiment: Highly Bullish.
Current Positioning:
BTC spot long at $78K, mostly scaled out with 33% remaining on trailing stop (trimmed profit: 1st @ $91.5K, 2nd @ $95.8K, 3rd @ $103.5K). No open leveraged position.
Only a couple ALT open positions left on trailing stops. Not considering new trades at the moment.
What are the Technicals?
Definitions you may not know:
Weekly Closing Range: Created with Bayesian statistics and linear regression. More on that here.
RSI (Relative Strength Index): Momentum indicator showing speed and power of price action.
Divergence: When price action is going one way but momentum is going the other, suggesting the current price trend might be losing power.
📈 Technical Deep Dive (BTC)

Price Action: Bullish Bias, defined consolidation range.
Support at $103.7K and $98.3K; Resistance around $108.9K and ATH @ $112K.
Weekly Closing Range is forecasted at $103.2K - $108.8K by Sunday.
Correctly projected 17 out of 32 (53.1%)
Monthly Closing Range is forecasted at $66.8K - $99.4K by Sunday.
Correctly projected 1 out of 1 (100%)
Indicators & Oscillators:
RSI: Suggesting price consolidation and/or bullish momentum because measurements are:
Currently above midline - momentum is generally bullish, it’s easier for prices to go up than down.
Closed above adaptive bottom band - bearish impulsive action has ceased with a momentum breakdown floor at $101.5K.
Divergence Signals: The remaining secondary target is at $98.1K. This presents as a swing low buy opportunity though, with the RSI back inside the bands this is a less likely target in the short term. The secondary target would present as a low buying opportunity but would be less appealing to me as the market structure would be in much worse shape and be nearing bearish confirmation.
📉 Technical Deep Dive (ETH & ALTs)

Price Action (ETH): Bullish Bias, yet stalled.
Support at $2320. Resistance zone at $2585 - $2640 and higher resistance at $2895.
Weekly Closing Range is forecasted at $2400 - $2620 by Sunday.
Correctly projected 16 out of 28 (57.1% efficiency)
Indicators & Oscillators (ETH):
RSI: Lacking definitive guidance, wavering back and forth between the midline and bottom band. Slight bearish momentum bias.
Divergence Signals: The latest bearish signals with targets at around $2300 and $2065 remain active, though may not be hit in the short term as a bullish shift is pending with momentum.
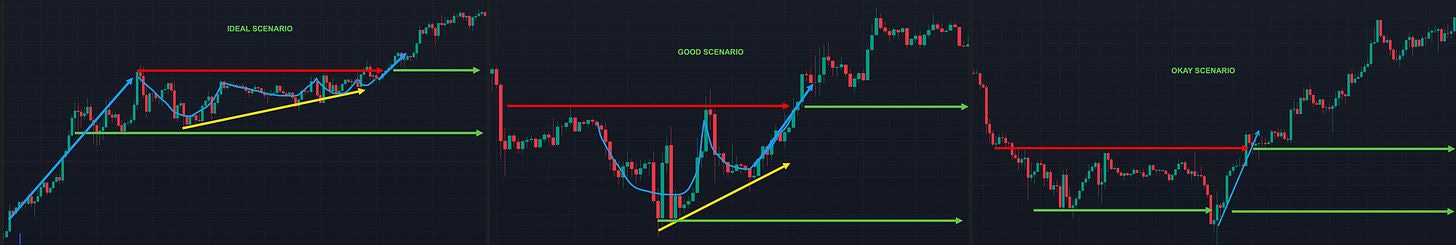
ALTs: I’m not interested in dip buying right now but an opportunity for a breakout may present itself if the bulls bring BTC back up to a resistance again. Another short term rotation play could occur if that were to happen. I’ll leave this image of which chart pictures to focus on up for now but I imagine there are very few of them out there that still look like this. The ALT charts are mostly either down or consolidating right now. Caution is warranted, but keeping an eye out instead of shutting down the screen may present some rewarding tardes.
🧭 What’s the Plan?
**🧭 Trading Plan & Scenarios**

*   **Bullish - Momentum Breakout:**
    *   Condition: Close above $109K, RSI + 50, Vol > last 7 day's Vol
    *   Action: Leveraged long, Stop Loss under $104K
*   **Caution - BTC Consolidation:**
    *   Condition: $103K < Daily Closes < $113K
    *   Action: Consider short-term range trading, buy support & sell resistnace
*   **Bearish - BTC Bullish Invalidation:**
    *   Condition: Close < $92K
    *   Action: Close short-term spot BTC position
*   **Next ALT Rotation - (not this week?)**
    *   Condition: BTC $$ flat/down, BTC.D & Stable cap down, Mrkt Driver down     *   Action: Evaluate ALT breakouts
---

**📌 Spot Risk Management**

*   **Stop-Losses:**
    *   BTC: Daily close < $90K
    *   ALTs: Placement under clear pivot point ideally < 12% below entry
*   **Position Sizing:**
    *   BTC: Moderate to small entries
    *   ALTs: Small entries
🔮 My Long-Term Market Reflection

Macro Cycle Status:
Bull market still intact but in a phase that in the past lead to bear market confirmation unless we have daily closes for BTC above the all-time high, then things get tricky and not so clear-cut.
Historical Comparison:
Similar patterns to the prior bull market suggest caution; historically, failure to breach all-time highs before turning back down signaled bear market onset.

Personal Expectations:
As time progresses without setting new highs, we continue to shape the market similarly to the last bull market. In a perfect mirroring scenario, we keep trending down eventually transitioning into a bear market.
From this moment on, the first cracks in this scenario will show it we get a daily close higher than the June 3rd high. Since we’ve yet to have a significant drop in marketcap this is increasing in likelyhood. Invalidation would come with a new all time high close on the Total chart.
https://zenalyticstrading.substack.com/p/quarterly-market-synthesis-q2-2025
Taken from the post above, so far the latest top timing window for BTC is valid. and we are nearing the next bottom timing window from June 11 - June 16. Ideally our lowest close in this window will be above the $102K level from the prior bottom or else the market turns lose the textbook bullish shape (low, high, higher low, higher high).

While we lost the $102K level for a day I’m willing to subjectively ignore that because of all the tweeter madness. Since the market rallied immediately back the next day the metrics on all the technical indicators effectively were unchanged as if it never happened. Maintaining above this level for the next week would be a promising step towards the idea of another new high and leg up in the market.
Big picture, we are still moving in the wrong direction, but little picture, we are trying to turn it around. The bulls put in a lot of work when Trump and Elon knocked the market down.
🎯 Key Takeaways
BTC: Hope for best (ATH) and consider breakout of 108K, otherwise buy near supports, sell near resistances and play the range
OTHERS: Stand aside until BTC lags at resistance and consider risky alt rotations.
@ThePrivacySmurf