


#118: Cruel Summer
Don't be the last one to know BTC is bleeding.

One more week off from dropping discord teasers, but you should hop in any way. There’s a lot of real-time commentary that you are missing out on.
Join using the link below. Don’t forget to complete the user verification, or you will be booted automatically in a couple of days.
https://discord.gg/vtSUR2JQ7M
Now, on to the important stuff
ANALYSIS TL: DR
The market retains a bullish weekly and daily structure with continued extremely greedy sentiment. The Market Validity Score and Crypto Money flow show bullish ALT behavior stalling. BTC and stablecoins found support and are rallying towards resistance, suggesting another ALT weakness and a possible bearish market move. It’s a week of caution and waiting to see how things shake out.
As a side note, I wrote an extensive post countering some narratives and highlighting current market details. If you missed it, you can check it out here. I think people forget we were in a years-long bull market after that cruel summer…

Where are we now?
The bull market is still on, with most assets bullish on daily and weekly timeframes. BTC finally broke the $100K mark but with somewhat little fanfare. Many ALTs have come back to life from long-dead states (I’m looking at you XYO… FTT… XRP… Come at me XRP army, :-p ), and others continue impulsive rallies. The retail sentiment is at greedy extremes. The current (maybe final) market rotation is still in play but has failed to capture recent highs, showing weakness. It is a support break away from market-wide bearishness.
What happened to get us here?
Expectations from last week's analysis were on point for BTC, again too bearish for ETH, and on track for ALTs. Overall, it was still in line with my trade executions of letting the market run up to wherever it wanted for BTC and taking breakout trades on ALTs.
What is the plan?
SHORT TERM BTC
A big relief valve may have been triggered with BTC finally passing the $100K mark. It’s been the most anticipated number since before last cycle’s top over 4 years ago.
Integrating mathematical principles with the art of technical analysis, stats suggest that BTC's closing prices for the week will range between $100K and $105.6K.
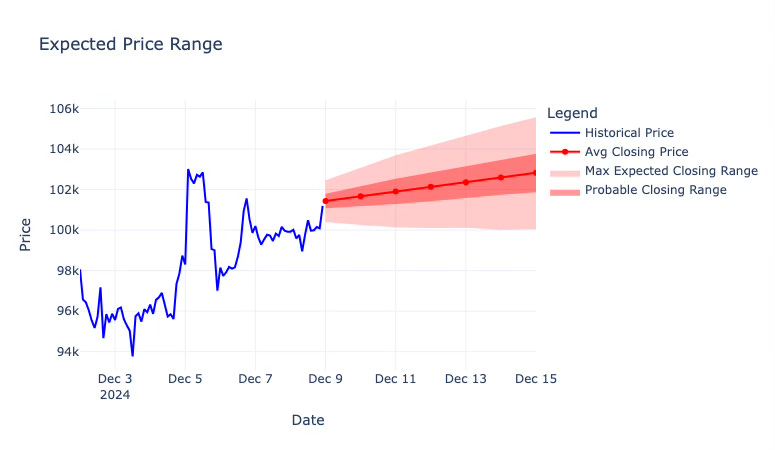
The Closing price for the week landed inside the Max Expected Range on Sunday. This brings the count to three of eight being correct on the price ranges. As observed last week, the directionality (bullish or bearish) from close to close still hasn’t been off.
My thoughts on the range are that it seems optimistic, even though it was confirmed last week. As charted below, there’s a pending (unconfirmed) bearish trade signal. If price action doesn’t pull off some bullish action today, there will be a second indicator of the daily chart weakness.
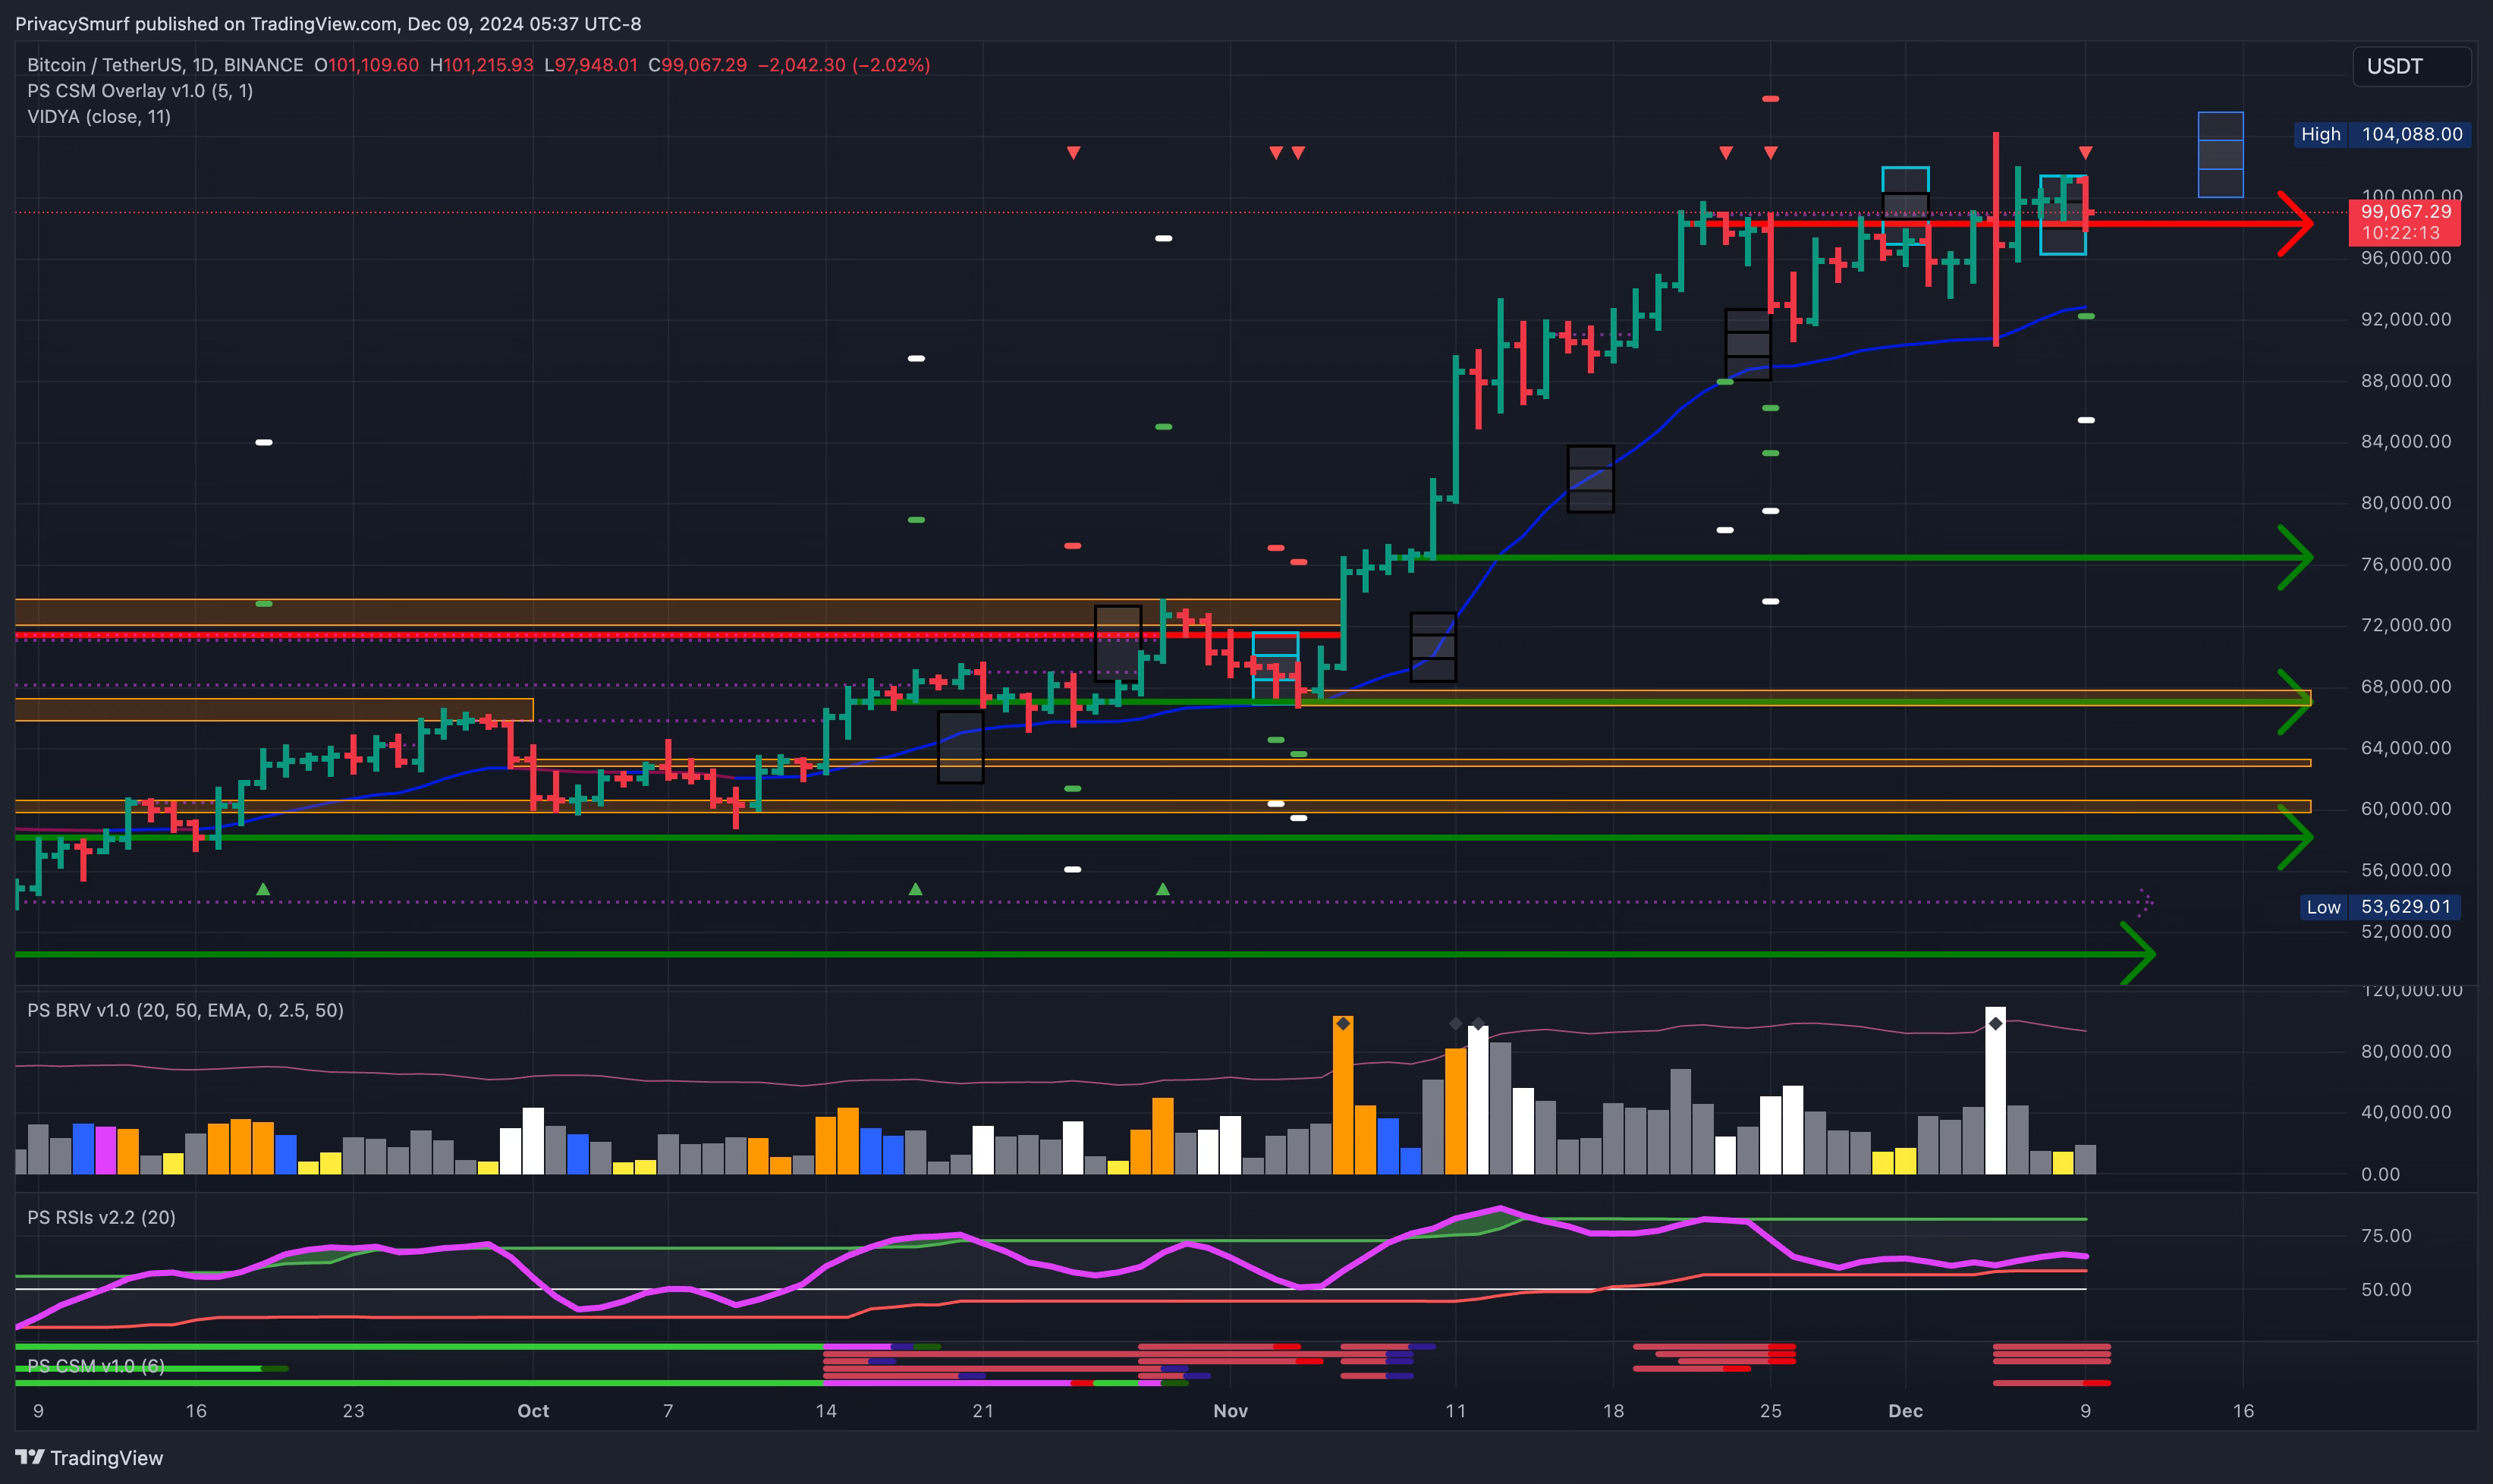
Buying any dip right now is out of the picture for me, especially if the daily bearish signal is confirmed today. I don’t want to risk buying the top. I don’t want to go short just yet because no higher timeframe indicates the party is over. I’ll either evaluate a swing entry from lower or bite the bullet and add more higher if my thesis is invalidated and we blow through the top.
SHORT TERM ETH & ALTs
Statistics would put closing prices between $3945 and $4195 this week for ETH.
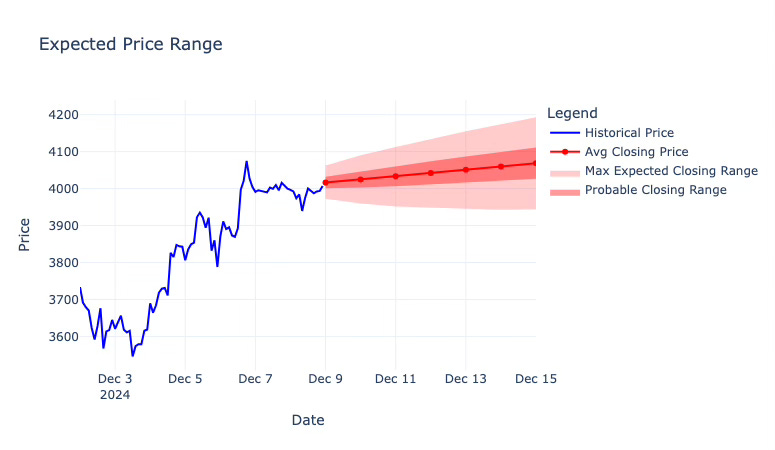
This is the same situation as the last few weeks. I think it’s plausible that ETH can land inside the expected ranges. There’s lots of resistance (shown in the linked ETH chart at the bottom) that could keep ETH in check and prevent sustained bullish runs. This has been the case for the past few weeks. We’ve seen ETH push for a single day and then consolidate around the charted resistances. If BTC declines this week, I expect ETH and ALTs to take a more significant hit. More details on this are in the supplemental post linked below.
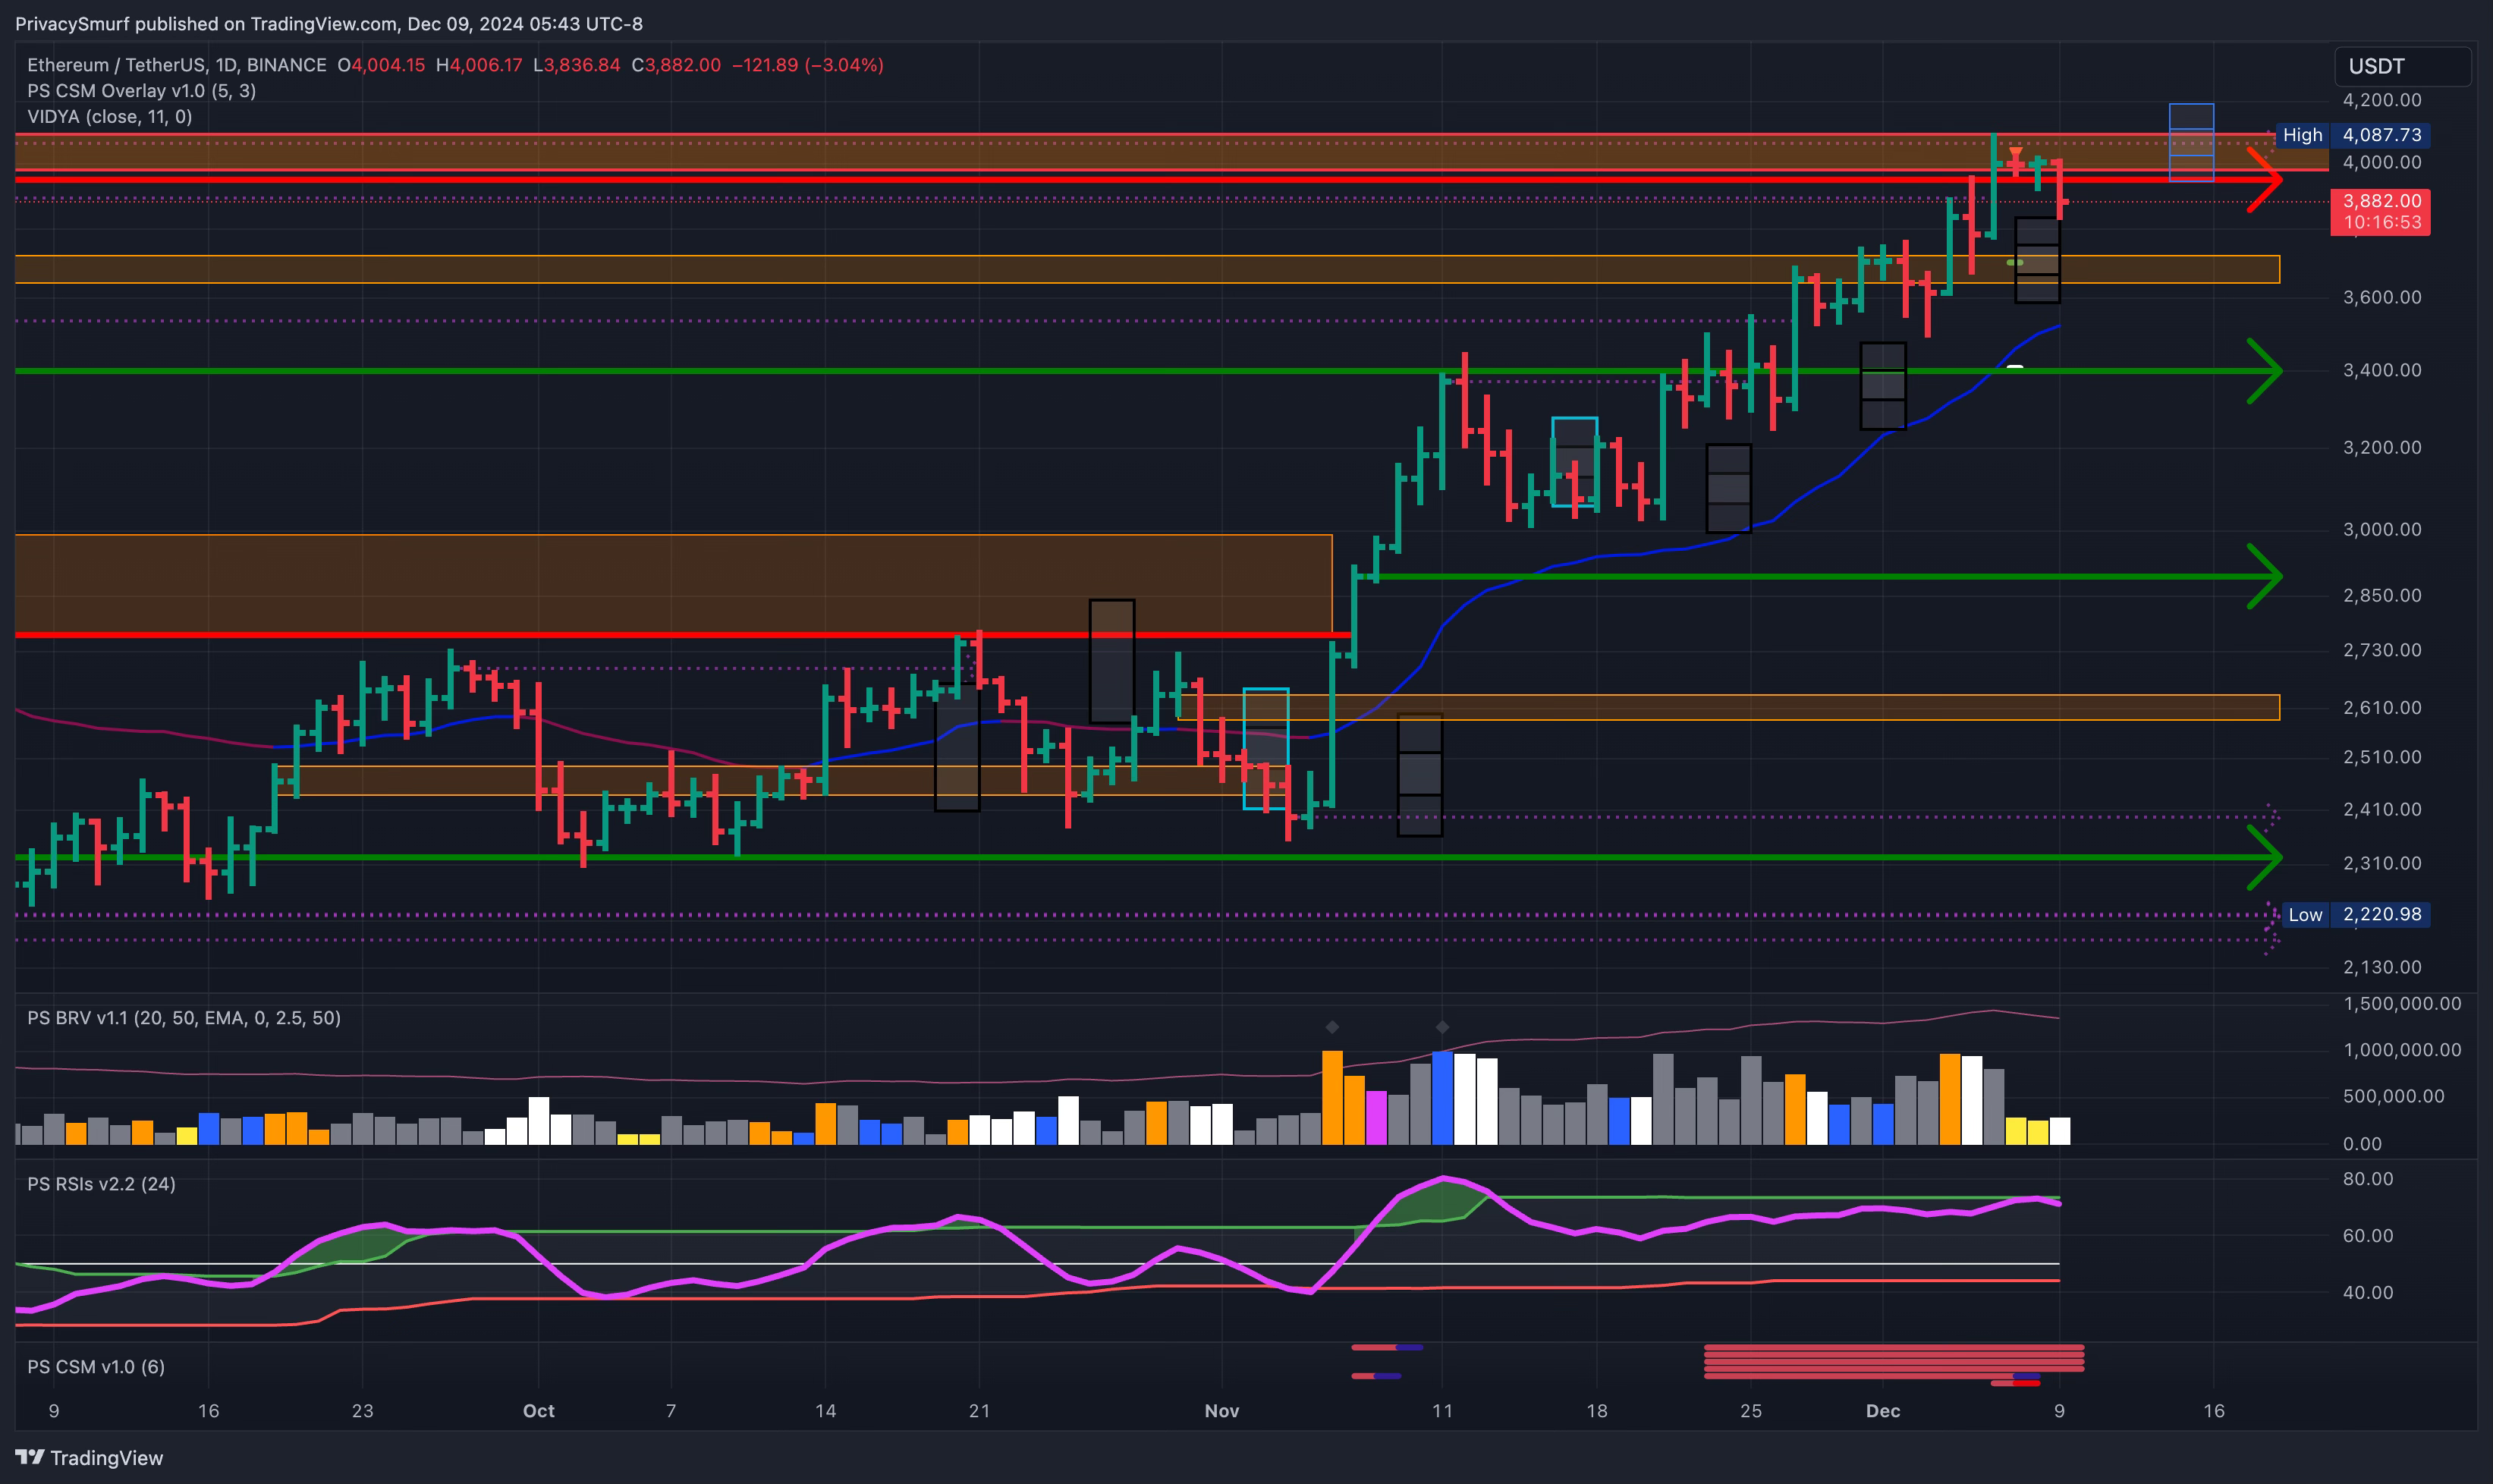
An interesting observation on the methodology I’m using to create the range expectations pops out on the ETH chart. It’s doing well to estimate the trend but missing the turns. Perhaps I’ll need to include some mean reversion criteria in my calculations.
Moving on, the analysis of ALTs last week was excellent. ALT exposure is still the focus, but don’t forget to lock in profit and/or use trailing stops. I’m not considering dip buys right now because of the possible end of this current market rotation. I still want to focus on charts going up that have strength and momentum. I believe we are closer to the end of this short-run for the short term.
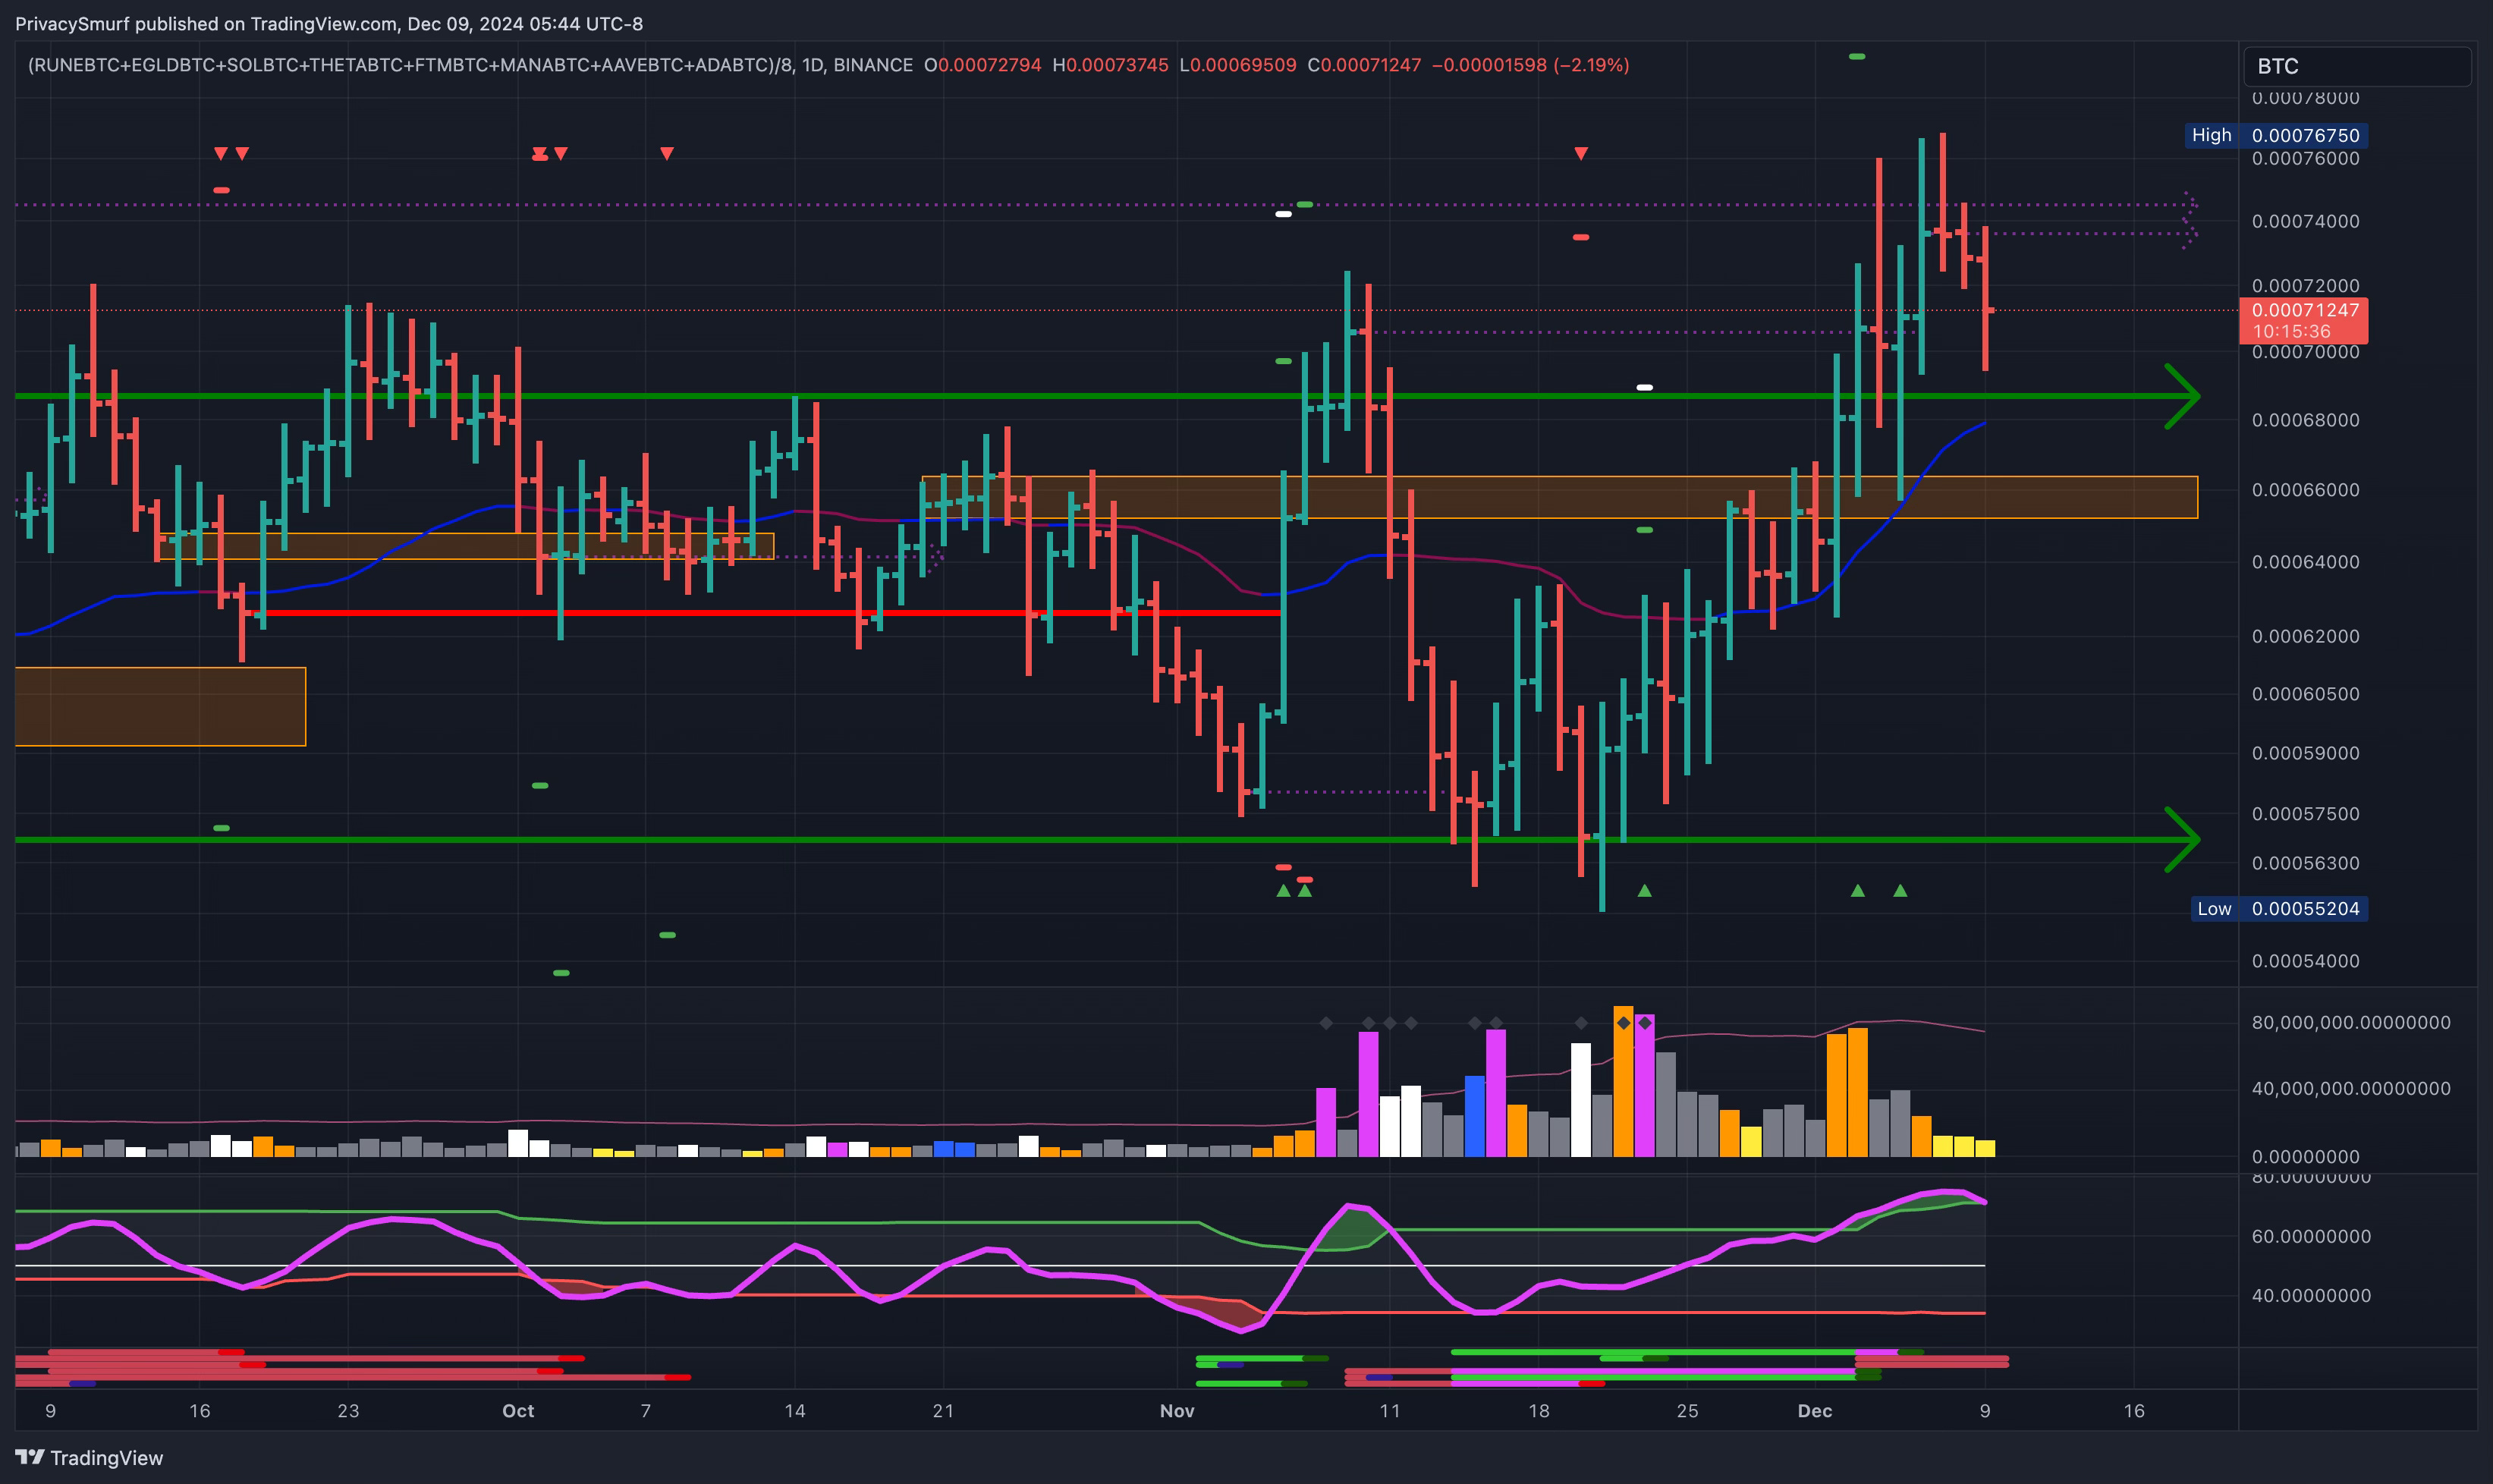
It would be ideal if a new consolidation range appears between the green support line around 0.00068 and the recent resistance starting around 0.0074 on the chart above. I’d look to take more ALT trades on breakouts that occur after that consolidation. Otherwise, I would expect alts to fail and underperform versus BTC.
(MY) LONG TERM CRYPTO
I want to leave this part primarily unchanged from last week. I’m almost finished with the post dedicated to my horizons and rationale. Be on the lookout for that.
I changed the heading of this section a few weeks ago because I think it’s vital for you to recognize that the analysis is from my perspective regarding my time horizons and trading plans. And for me…

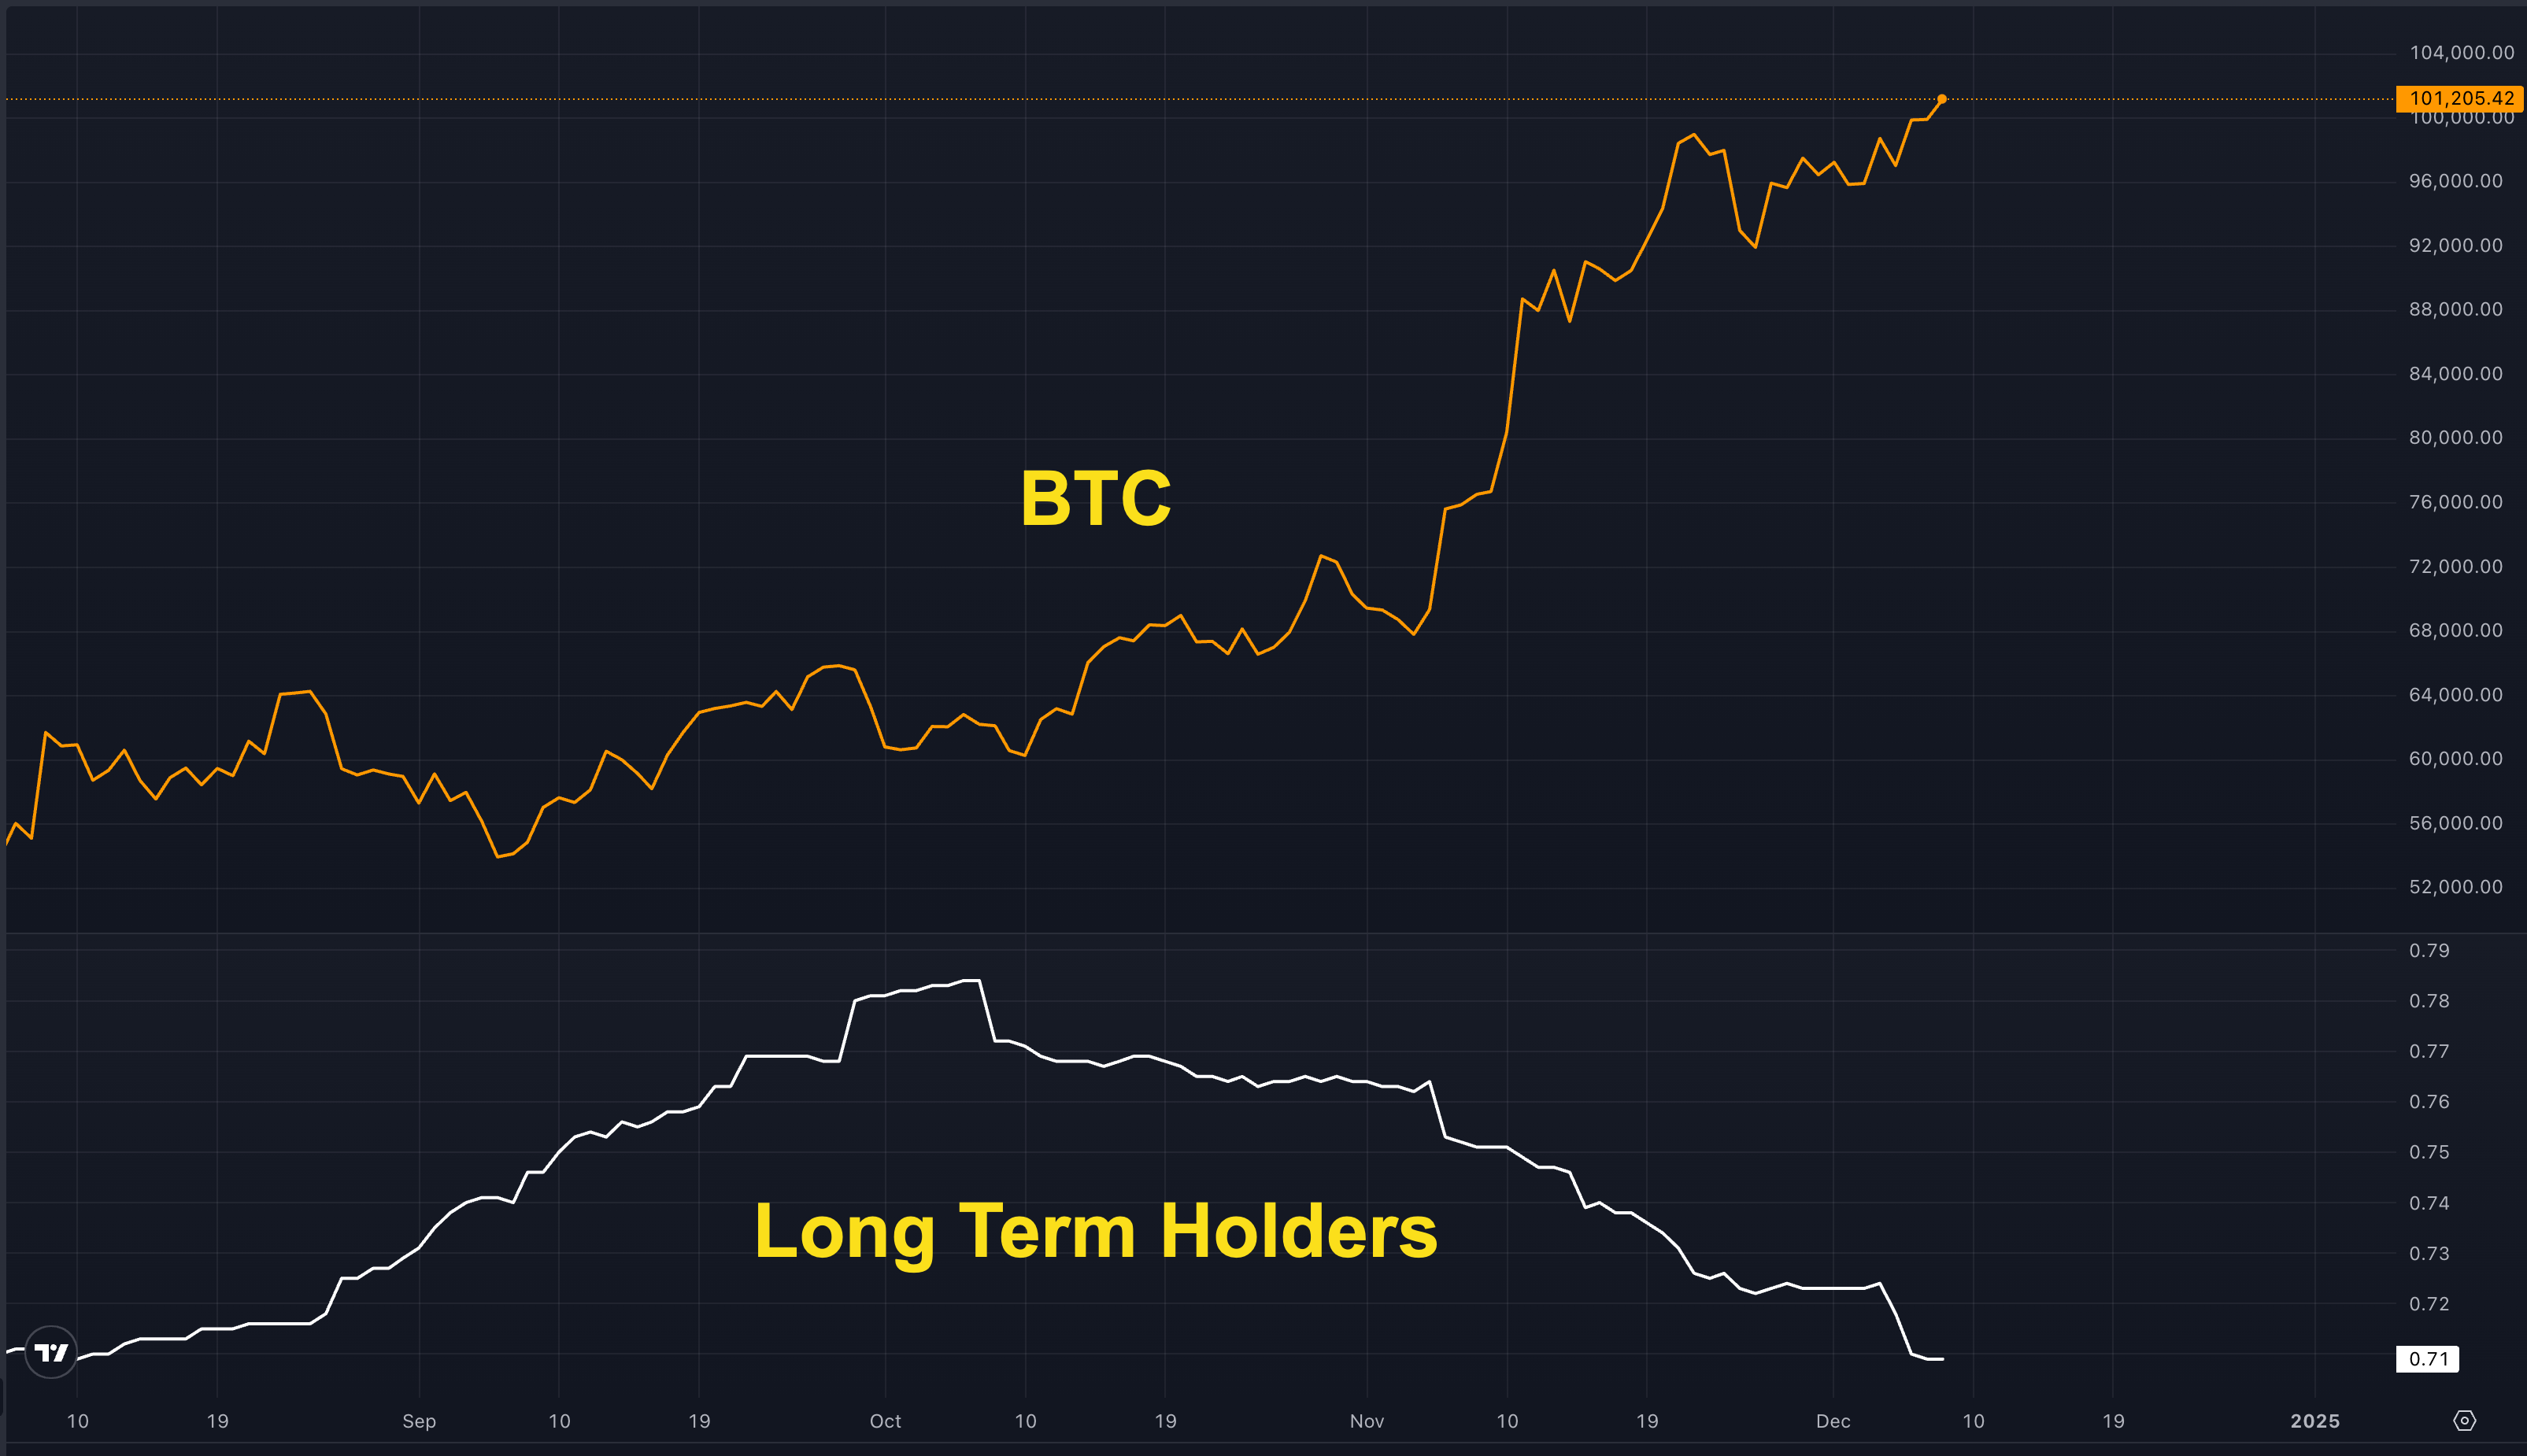
There have been large sales recently from past long-term holders (think CZ and other old whales), although other new long-term holders have absorbed them (think Microstrategy et al.), supposedly . It’s important to remember that support only lasts as long as someone is there to hold you up. As BTC prices go up, old holders keep selling. As soon as the new players stop buying, there’s nothing left to absorb the profit-taking, and prices will tumble.
The daily timeframe has checked all the boxes for an ending, with a new signal possible on the way today. All that is left is the weekly. I’ve explained it before: We may have a double top for this bull market end. For that to be true, we must have the first top, and those signals are stacking up. It’s getting closer to being realized.
I admit I did not expect a 100K price tag for BTC and said as much often. Still, the magical part about, and the key difference between, analysis and trading is that I can think whatever I want as long as I trade the charts and follow objective signals, which have been on point and nothing but bullish. Now is the time to pay attention to those objective signals and for me to measure the risks of following them when they appear.
If you like and want a deeper dive into the metrics I used to include here, check out the new supplemental issues. I'll be posting them to the Substack site, not directly emailing them out to save your inbox some trash collection.

See you in next week’s market update!
@theprivacysmurf
That’s all for this week’s analysis.
Did you miss the Q4 analysis? Check that out here!

Read a post about what everyone is getting wrong about the Bitcoin Halving and BTC price action.

Below are the TradingView chart links for the images above, which I use daily for my BTC, ETH, and ALT trading.